Stinica Airbnb Market Analysis 2026: Short Term Rental Data & Vacation Rental Statistics in Lika-Senj County, Croatia
Is Airbnb profitable in Stinica in 2026? Explore comprehensive Airbnb analytics for Stinica, Lika-Senj County, Croatia to uncover income potential. This 2026 STR market report for Stinica, based on AirROI data from February 2025 to January 2026, reveals key trends in the niche market of 25 active listings.
Whether you're considering an Airbnb investment in Stinica, optimizing your existing vacation rental, or exploring rental arbitrage opportunities, understanding the Stinica Airbnb data is crucial. Leveraging the low regulation environment is key to maximizing your short term rental income potential. Let's dive into the specifics.
Key Stinica Airbnb Performance Metrics Overview
Monthly Airbnb Revenue Variations & Income Potential in Stinica (2026)
Understanding the monthly revenue variations for Airbnb listings in Stinica is key to maximizing your short term rental income potential. Seasonality significantly impacts earnings. Our analysis, based on data from the past 12 months, shows that the peak revenue month for STRs in Stinica is typically August, while March often presents the lowest earnings, highlighting opportunities for strategic pricing adjustments during shoulder and low seasons. Explore the typical Airbnb income in Stinica across different performance tiers:
- Best-in-class properties (Top 10%) achieve $2,849+ monthly, often utilizing dynamic pricing and superior guest experiences.
- Strong performing properties (Top 25%) earn $1,733 or more, indicating effective management and desirable locations/amenities.
- Typical properties (Median) generate around $1,084 per month, representing the average market performance.
- Entry-level properties (Bottom 25%) see earnings around $785, often with potential for optimization.
Average Monthly Airbnb Earnings Trend in Stinica
Stinica Airbnb Occupancy Rate Trends (2026)
Maximize your bookings by understanding the Stinica STR occupancy trends. Seasonal demand shifts significantly influence how often properties are booked. Typically, Augustsees the highest demand (peak season occupancy), while December experiences the lowest (low season). Effective strategies, like adjusting minimum stays or offering promotions, can boost occupancy during slower periods. Here's how different property tiers perform in Stinica:
- Best-in-class properties (Top 10%) achieve 59%+ occupancy, indicating high desirability and potentially optimized availability.
- Strong performing properties (Top 25%) maintain 49% or higher occupancy, suggesting good market fit and guest satisfaction.
- Typical properties (Median) have an occupancy rate around 33%.
- Entry-level properties (Bottom 25%) average 20% occupancy, potentially facing higher vacancy.
Average Monthly Occupancy Rate Trend in Stinica
Average Daily Rate (ADR) Airbnb Trends in Stinica (2026)
Effective short term rental pricing strategy in Stinica involves understanding monthly ADR fluctuations. The Average Daily Rate (ADR) for Airbnb in Stinica typically peaks in August and dips lowest during November. Leveraging Airbnb dynamic pricing tools or strategies based on this seasonality can significantly boost revenue. Here's a look at the typical nightly rates achieved:
- Best-in-class properties (Top 10%) command rates of $331+ per night, often due to premium features or locations.
- Strong performing properties (Top 25%) achieve nightly rates of $176 or more.
- Typical properties (Median) charge around $117 per night.
- Entry-level properties (Bottom 25%) earn around $92 per night.
Average Daily Rate (ADR) Trend by Month in Stinica
Get Live Stinica Market Intelligence 👇

Explore Real-time Analytics
Airbnb Seasonality Analysis & Trends in Stinica (2026)
Peak Season (August, July, September)
- Revenue averages $3,057 per month
- Occupancy rates average 52.1%
- Daily rates average $195
Shoulder Season
- Revenue averages $1,287 per month
- Occupancy maintains around 30.6%
- Daily rates hold near $170
Low Season (January, March, November)
- Revenue drops to average $316 per month
- Occupancy decreases to average 13.4%
- Daily rates adjust to average $163
Seasonality Insights for Stinica
- The Airbnb seasonality in Stinica shows highly seasonal trends requiring careful strategy. While the sections above show seasonal averages, it's also insightful to look at the extremes:
- During the high season, the absolute peak month showcases Stinica's highest earning potential, with monthly revenues capable of climbing to $3,359, occupancy reaching a high of 56.1%, and ADRs peaking at $208.
- Conversely, the slowest single month of the year, typically falling within the low season, marks the market's lowest point. In this month, revenue might dip to $0, occupancy could drop to 0.0%, and ADRs may adjust down to $158.
- Understanding both the seasonal averages and these monthly peaks and troughs in revenue, occupancy, and ADR is crucial for maximizing your Airbnb profit potential in Stinica.
Seasonal Strategies for Maximizing Profit
- Peak Season: Maximize revenue through premium pricing and potentially longer minimum stays. Ensure high availability.
- Low Season: Offer competitive pricing, special promotions (e.g., extended stay discounts), and flexible cancellation policies. Target off-season travelers like remote workers or budget-conscious guests.
- Shoulder Seasons: Implement dynamic pricing that balances peak and low rates. Target weekend travelers or specific events. Offer slightly more flexible terms than peak season.
- Regularly analyze your own performance against these Stinica seasonality benchmarks and adjust your pricing and availability strategy accordingly.
Best Areas for Airbnb Investment in Stinica (2026)
Exploring the top neighborhoods for short-term rentals in Stinica? This section highlights key areas, outlining why they are attractive for hosts and guests, along with notable local attractions. Consider these locations based on your target guest profile and investment strategy.
| Neighborhood / Area | Why Host Here? (Target Guests & Appeal) | Key Attractions & Landmarks |
|---|---|---|
| Stinica Beach | Beautiful coastal area known for its tranquility and stunning views of the Adriatic Sea. Perfect for tourists looking for a peaceful escape close to nature. | Stinica Beach, Velebit National Park, Kozjača Gorge, fishing excursions, hiking trails |
| Klenovica | A charming village next to the sea, popular for its quiet beaches and nature. Great place for families and those looking to explore the surrounding nature and coastline. | Klenovica Beach, water sports, seaside promenades, local seafood restaurants |
| Senj | A historic town with a rich cultural heritage and beautiful old architecture. Offers both beach access and cultural experiences, attracting a diverse range of visitors. | Senj Fortress, Nehaj Tower, beaches, local museums, historic town center |
| Novi Vinodolski | A picturesque coastal town with a rich history and beautiful beaches. Popular for tourists seeking both relaxation and cultural experiences. | Novi Vinodolski Beach, historic churches, scenic walks, local festivals |
| Baška | Famous for its stunning beach and vibrant tourist facilities. Offers a lively atmosphere, making it a favorite for active tourists. | Baška Beach, Vela Plaža, hiking in the surrounding hills, water sports, local dining options |
| Prizna | A small village ideal for those looking to explore the nearby islands and natural parks. Perfect for nature lovers and adventure seekers. | ferry to the islands, natural parks, hiking trails, local wildlife |
| Luka | Quiet village known for its natural beauty and spacious beaches. Excellent for those looking to relax away from crowded tourist hotspots. | Luka Beach, scenic viewpoints, fishing spots, nature walks |
| Slivno | Rural area known for its agricultural landscapes and charm. Attracts visitors interested in traditional Croatian culture and a slower-paced vacation. | local farms, wine tasting, scenic countryside, cultural festivals |
Understanding Airbnb License Requirements & STR Laws in Stinica (2026)
While Stinica, Lika-Senj County, Croatia currently shows low STR regulations, specific Airbnb license requirements might still exist or change. Always verify the latest short term rental regulations and Airbnb license requirements directly with local government authorities for Stinica to ensure full compliance before hosting.
(Source: AirROI data, 2026, finding no licensed listings among those analyzed)
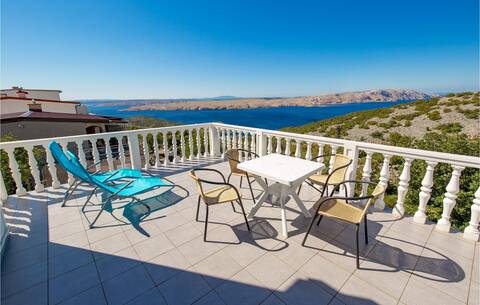
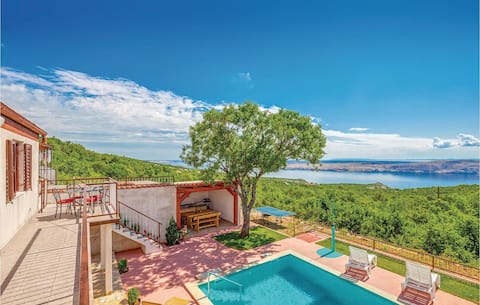
Top Performing Airbnb Properties in Stinica (2026)
Benchmark your potential! Explore examples of top-performing Airbnb properties in Stinicabased on Trailing Twelve Month (TTM) revenue. Analyze their characteristics, revenue, occupancy rate, and ADR to understand what drives success in this market.
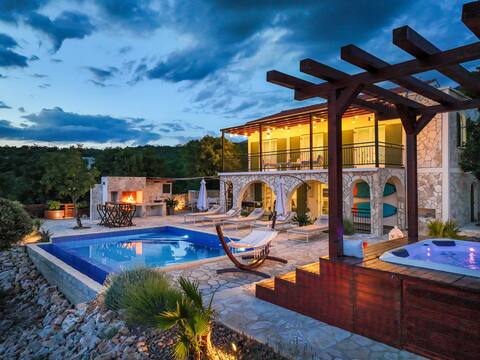
Villa Rita II (villa with a beautiful view)
Entire Place • 3 bedrooms
1 bedroom nice apartment in Jablanac
Entire Place • 1 bedroom

Bajadera by Interhome
Entire Place • 2 bedrooms

Nice apartment in Jablanac with kitchen
Entire Place • 1 bedroom
Cozy home in Jablanac
Entire Place • 2 bedrooms
Nice apartment in Stinica with WiFi
Entire Place • 1 bedroom
Note: Performance varies based on location, size, amenities, seasonality, and management quality. Data reflects the past 12 months.
Top Performing Airbnb Hosts in Stinica (2026)
Learn from the best! This table showcases top-performing Airbnb hosts in Stinica based on the number of properties managed and estimated total revenue over the past year. Analyze their scale and performance metrics.
| Host Name | Properties | Grossing Revenue | Stay Reviews | Avg Rating |
|---|---|---|---|---|
| Lana | 1 | $66,311 | 12 | 4.92/5.0 |
| Novasol | 3 | $30,017 | 21 | 4.72/5.0 |
| Danijela - Interhome | 2 | $23,767 | 7 | 4.54/5.0 |
| Nikola | 3 | $19,872 | 6 | 4.00/5.0 |
| Novasol | 3 | $14,966 | 10 | 5.00/5.0 |
| Novasol | 1 | $14,812 | 5 | 4.80/5.0 |
| Novasol | 1 | $12,166 | 5 | 4.60/5.0 |
| Ivan | 1 | $9,403 | 90 | 4.70/5.0 |
| Davor | 1 | $8,918 | 54 | 4.93/5.0 |
| Asja | 2 | $8,356 | 96 | 4.70/5.0 |
Analyzing the strategies of top hosts, such as their property selection, pricing, and guest communication, can offer valuable lessons for optimizing your own Airbnb operations in Stinica.
Dive Deeper: Advanced Stinica STR Market Data (2026)
Ready to unlock more insights? AirROI provides access to advanced metrics and comprehensive Airbnb data for Stinica. Explore detailed analytics beyond this report to refine your investment strategy, optimize pricing, and maximize your vacation rental profits.
Explore Advanced MetricsStinica Short-Term Rental Market Composition (2026): Property & Room Types
Room Type Distribution
Property Type Distribution
Market Composition Insights for Stinica
- The Stinica Airbnb market composition is heavily skewed towards Entire Home/Apt listings, which make up 96% of the 25 active rentals. This indicates strong guest preference for privacy and space.
- Looking at the property type distribution in Stinica, Apartment/Condo properties are the most common (68%), reflecting the local real estate landscape.
- Houses represent a significant 32% portion, catering likely to families or larger groups.
Stinica Airbnb Room Capacity Analysis (2026): Bedroom Distribution
Distribution of Listings by Number of Bedrooms
Room Capacity Insights for Stinica
- The dominant room capacity in Stinica is 1 bedroom listings, making up 64% of the market. This suggests a strong demand for properties suitable for couples or solo travelers.
- Together, 1 bedroom and 2 bedrooms properties represent 84.0% of the active Airbnb listings in Stinica, indicating a high concentration in these sizes.
- With over half the market (64%) consisting of studios or 1-bedroom units, Stinica is particularly well-suited for individuals or couples.
Stinica Vacation Rental Guest Capacity Trends (2026)
Distribution of Listings by Guest Capacity
Guest Capacity Insights for Stinica
- The most common guest capacity trend in Stinica vacation rentals is listings accommodating 4 guests (48%). This suggests the primary traveler segment is likely small families or groups.
- Properties designed for 4 guests and 2 guests dominate the Stinica STR market, accounting for 72.0% of listings.
- 20.0% of properties accommodate 6+ guests, serving the market segment for larger families or group travel in Stinica.
- On average, properties in Stinica are equipped to host 3.9 guests.
Stinica Airbnb Booking Patterns (2026): Available vs. Booked Days
Available Days Distribution
Booked Days Distribution
Booking Pattern Insights for Stinica
- The most common availability pattern in Stinica falls within the 271-366 days range, representing 84% of listings. This suggests many properties have significant open periods on their calendars.
- Approximately 100.0% of listings show high availability (181+ days open annually), indicating potential for increased bookings or specific owner usage patterns.
- For booked days, the 31-90 days range is most frequent in Stinica (44%), reflecting common guest stay durations or potential owner blocking patterns.
Stinica Airbnb Minimum Stay Requirements Analysis
Distribution of Listings by Minimum Night Requirement
1 Night
2 listings
8% of total
3 Nights
5 listings
20% of total
4-6 Nights
4 listings
16% of total
7-29 Nights
1 listings
4% of total
30+ Nights
13 listings
52% of total
Key Insights
- The most prevalent minimum stay requirement in Stinica is 30+ Nights, adopted by 52% of listings. This highlights the market's preference for longer commitments.
- Very short stays (1-2 nights) are less common (8.0%), suggesting hosts prefer slightly longer bookings to optimize turnover.
- A significant segment (52%) caters to monthly stays (30+ nights) in Stinica, pointing to opportunities in the extended-stay market.
Recommendations
- Align with the market by considering a 30+ Nights minimum stay, as 52% of Stinica hosts use this setting.
- If feasible, allowing 1-night stays, especially midweek or during low season, could capture last-minute bookings, as only 8% currently do.
- Explore offering discounts for stays of 30+ nights to attract the 52% of the market seeking extended stays.
- Adjust minimum nights based on seasonality – potentially shorter during low season and longer during peak demand periods in Stinica.
Stinica Airbnb Cancellation Policy Trends Analysis (2026)
Super Strict 60 Days
8 listings
32% of total
Moderate
3 listings
12% of total
Firm
10 listings
40% of total
Strict
4 listings
16% of total
Cancellation Policy Insights for Stinica
- The prevailing Airbnb cancellation policy trend in Stinica is Firm, used by 40% of listings.
- A majority (56.0%) of hosts in Stinica utilize Firm or Strict policies, indicating a market where hosts prioritize booking security.
Recommendations for Hosts
- Consider adopting a Firm policy to align with the 40% market standard in Stinica.
- Regularly review your cancellation policy against competitors and market demand shifts in Stinica.
Stinica STR Booking Lead Time Analysis (2026)
Average Booking Lead Time by Month
Booking Lead Time Insights for Stinica
- The overall average booking lead time for vacation rentals in Stinica is 56 days.
- Guests book furthest in advance for stays during April (average 135 days), likely coinciding with peak travel demand or local events.
- The shortest booking windows occur for stays in November (average 0 days), indicating more last-minute travel plans during this time.
- Seasonally, Spring (109 days avg.) sees the longest lead times, while Fall (20 days avg.) has the shortest, reflecting typical travel planning cycles.
Recommendations for Hosts
- Use the overall average lead time (56 days) as a baseline for your pricing and availability strategy in Stinica.
- For April stays, consider implementing length-of-stay discounts or slightly higher rates for bookings made less than 135 days out to capitalize on advance planning.
- During November, focus on last-minute booking availability and promotions, as guests book with very short notice (0 days avg.).
- Target marketing efforts for the Spring season well in advance (at least 109 days) to capture early planners.
- Monitor your own booking lead times against these Stinica averages to identify opportunities for dynamic pricing adjustments.
Popular & Essential Airbnb Amenities in Stinica (2026)
Amenity Prevalence
Amenity Insights for Stinica
- Essential amenities in Stinica that guests expect include: Air conditioning, Kitchen. Lacking these (any) could significantly impact bookings.
- Popular amenities like TV, Hangers, Wifi are common but not universal. Offering these can provide a competitive edge.
- Warning: Wifi is not universally provided but is considered essential globally. Ensure reliable Wifi is offered.
Recommendations for Hosts
- Ensure your listing includes all essential amenities for Stinica: Air conditioning, Kitchen.
- Prioritize adding missing essentials: Air conditioning, Kitchen.
- Consider adding popular differentiators like TV or Hangers to increase appeal.
- Highlight unique or less common amenities you offer (e.g., hot tub, dedicated workspace, EV charger) in your listing description and photos.
- Regularly check competitor amenities in Stinica to stay competitive.
Stinica Airbnb Guest Demographics & Profile Analysis (2026)
Guest Profile Summary for Stinica
- The typical guest profile for Airbnb in Stinica consists of predominantly international visitors (100%), with top international origins including Italy, typically belonging to the Post-2000s (Gen Z/Alpha) group (50%), primarily speaking English or German.
- Domestic travelers account for 0.0% of guests.
- Key international markets include Germany (30.8%) and Italy (15.4%).
- Top languages spoken are English (40%) followed by German (27.5%).
- A significant demographic segment is the Post-2000s (Gen Z/Alpha) group, representing 50% of guests.
Recommendations for Hosts
- Focus marketing internationally, particularly towards travelers from Italy.
- Tailor amenities and listing descriptions to appeal to the dominant Post-2000s (Gen Z/Alpha) demographic (e.g., highlight fast WiFi, smart home features, local guides).
- Highlight unique local experiences or amenities relevant to the primary guest profile.
- Consider seasonal promotions aligned with peak travel times for key origin markets.
Nearby Short-Term Rental Market Comparison
How does the Stinica Airbnb market stack up against its neighbors? Compare key performance metrics like average monthly revenue, ADR, and occupancy rates in surrounding areas to understand the broader regional STR landscape.
| Market | Active Properties | Monthly Revenue | Daily Rate | Avg. Occupancy |
|---|---|---|---|---|
| Poljica Brig | 16 | $3,948 | $523.01 | 52% |
| Zemunik Gornji | 12 | $3,347 | $325.85 | 52% |
| Selina | 15 | $3,339 | $351.70 | 49% |
| Murvica | 30 | $3,023 | $359.79 | 45% |
| Crno | 16 | $2,891 | $442.64 | 32% |
| Briševo | 14 | $2,807 | $332.69 | 48% |
| Barat | 28 | $2,692 | $425.82 | 36% |
| Nova Vas - Villanova | 17 | $2,563 | $329.02 | 38% |
| Pusti | 10 | $2,555 | $282.13 | 41% |
| San Costanzo | 19 | $2,546 | $298.61 | 39% |