Čilipi Airbnb Market Analysis 2026: Short Term Rental Data & Vacation Rental Statistics in Dubrovnik-Neretva County, Croatia
Is Airbnb profitable in Čilipi in 2026? Explore comprehensive Airbnb analytics for Čilipi, Dubrovnik-Neretva County, Croatia to uncover income potential. This 2026 STR market report for Čilipi, based on AirROI data from February 2025 to January 2026, reveals key trends in the niche market of 32 active listings.
Whether you're considering an Airbnb investment in Čilipi, optimizing your existing vacation rental, or exploring rental arbitrage opportunities, understanding the Čilipi Airbnb data is crucial. Leveraging the low regulation environment is key to maximizing your short term rental income potential. Let's dive into the specifics.
Key Čilipi Airbnb Performance Metrics Overview
Monthly Airbnb Revenue Variations & Income Potential in Čilipi (2026)
Understanding the monthly revenue variations for Airbnb listings in Čilipi is key to maximizing your short term rental income potential. Seasonality significantly impacts earnings. Our analysis, based on data from the past 12 months, shows that the peak revenue month for STRs in Čilipi is typically August, while February often presents the lowest earnings, highlighting opportunities for strategic pricing adjustments during shoulder and low seasons. Explore the typical Airbnb income in Čilipi across different performance tiers:
- Best-in-class properties (Top 10%) achieve $6,381+ monthly, often utilizing dynamic pricing and superior guest experiences.
- Strong performing properties (Top 25%) earn $4,485 or more, indicating effective management and desirable locations/amenities.
- Typical properties (Median) generate around $2,061 per month, representing the average market performance.
- Entry-level properties (Bottom 25%) see earnings around $1,209, often with potential for optimization.
Average Monthly Airbnb Earnings Trend in Čilipi
Čilipi Airbnb Occupancy Rate Trends (2026)
Maximize your bookings by understanding the Čilipi STR occupancy trends. Seasonal demand shifts significantly influence how often properties are booked. Typically, Augustsees the highest demand (peak season occupancy), while February experiences the lowest (low season). Effective strategies, like adjusting minimum stays or offering promotions, can boost occupancy during slower periods. Here's how different property tiers perform in Čilipi:
- Best-in-class properties (Top 10%) achieve 80%+ occupancy, indicating high desirability and potentially optimized availability.
- Strong performing properties (Top 25%) maintain 66% or higher occupancy, suggesting good market fit and guest satisfaction.
- Typical properties (Median) have an occupancy rate around 45%.
- Entry-level properties (Bottom 25%) average 26% occupancy, potentially facing higher vacancy.
Average Monthly Occupancy Rate Trend in Čilipi
Average Daily Rate (ADR) Airbnb Trends in Čilipi (2026)
Effective short term rental pricing strategy in Čilipi involves understanding monthly ADR fluctuations. The Average Daily Rate (ADR) for Airbnb in Čilipi typically peaks in September and dips lowest during April. Leveraging Airbnb dynamic pricing tools or strategies based on this seasonality can significantly boost revenue. Here's a look at the typical nightly rates achieved:
- Best-in-class properties (Top 10%) command rates of $469+ per night, often due to premium features or locations.
- Strong performing properties (Top 25%) achieve nightly rates of $277 or more.
- Typical properties (Median) charge around $153 per night.
- Entry-level properties (Bottom 25%) earn around $107 per night.
Average Daily Rate (ADR) Trend by Month in Čilipi
Get Live Čilipi Market Intelligence 👇

Explore Real-time Analytics
Airbnb Seasonality Analysis & Trends in Čilipi (2026)
Peak Season (August, July, June)
- Revenue averages $5,776 per month
- Occupancy rates average 69.7%
- Daily rates average $265
Shoulder Season
- Revenue averages $2,672 per month
- Occupancy maintains around 46.0%
- Daily rates hold near $249
Low Season (January, February, December)
- Revenue drops to average $918 per month
- Occupancy decreases to average 27.2%
- Daily rates adjust to average $267
Seasonality Insights for Čilipi
- The Airbnb seasonality in Čilipi shows highly seasonal trends requiring careful strategy. While the sections above show seasonal averages, it's also insightful to look at the extremes:
- During the high season, the absolute peak month showcases Čilipi's highest earning potential, with monthly revenues capable of climbing to $6,743, occupancy reaching a high of 79.4%, and ADRs peaking at $299.
- Conversely, the slowest single month of the year, typically falling within the low season, marks the market's lowest point. In this month, revenue might dip to $478, occupancy could drop to 18.6%, and ADRs may adjust down to $204.
- Understanding both the seasonal averages and these monthly peaks and troughs in revenue, occupancy, and ADR is crucial for maximizing your Airbnb profit potential in Čilipi.
Seasonal Strategies for Maximizing Profit
- Peak Season: Maximize revenue through premium pricing and potentially longer minimum stays. Ensure high availability.
- Low Season: Offer competitive pricing, special promotions (e.g., extended stay discounts), and flexible cancellation policies. Target off-season travelers like remote workers or budget-conscious guests.
- Shoulder Seasons: Implement dynamic pricing that balances peak and low rates. Target weekend travelers or specific events. Offer slightly more flexible terms than peak season.
- Regularly analyze your own performance against these Čilipi seasonality benchmarks and adjust your pricing and availability strategy accordingly.
Best Areas for Airbnb Investment in Čilipi (2026)
Exploring the top neighborhoods for short-term rentals in Čilipi? This section highlights key areas, outlining why they are attractive for hosts and guests, along with notable local attractions. Consider these locations based on your target guest profile and investment strategy.
| Neighborhood / Area | Why Host Here? (Target Guests & Appeal) | Key Attractions & Landmarks |
|---|---|---|
| Čilipi Village | A charming village known for its traditional architecture and proximity to Dubrovnik Airport. It's ideal for travelers looking for a peaceful stay while being close to tourist attractions. | Cilipi Cultural Summer, Franciscan Monastery, Local Wine Cellars, Scenic Walking Trails |
| Konavle Valley | Famous for its beautiful landscapes, traditional stone houses, and agricultural heritage. Great for guests looking to experience rural Croatia with stunning views and activities. | Konavle Riding Club, Wine Tasting Tours, Konavoski Dvori Restaurant, Hiking Trails |
| Dubrovnik Old Town | A UNESCO World Heritage site filled with history, architecture, and culture. It's the most sought-after location for tourists visiting Dubrovnik, making it perfect for short-term rentals. | Walls of Dubrovnik, Sponza Palace, Rector's Palace, Stradun Street, Franciscan Monastery |
| Mlini | A picturesque coastal town with beaches and restaurants. It's ideal for families and beachgoers who want a quieter alternative to Dubrovnik while still being close to the city. | Mlini Beach, Church of Our Lady of the Snows, Seafront Promenade, Srebreno Beach |
| Cavtat | A beautiful coastal town with a vibrant waterfront, Cavtat is great for those looking to explore history and enjoy the Mediterranean lifestyle, with easy access to Dubrovnik. | Cavtat Harbor, Mausoleum of the Račić Family, House of Bukovac, Mediterranean Cuisine Restaurants |
| Plat | A small coastal village that offers a serene environment and stunning views of the Adriatic. Perfect for travelers seeking a peaceful retreat close to amenities. | Plat Beach, Water Sports Activities, Local Taverns and Restaurants |
| Trsteno | Known for its historic arboretum and beautiful summer residences. It's a lesser-known gem that attracts those seeking nature and tranquility. | Trsteno Arboretum, St. Vitus Church, Historical Gardens, Seaside Walks |
| Zupa Dubrovačka | A region with a mix of coastal and inland attractions, excellent for travelers seeking varied experiences from beach time to local culture. | Beaches of Zupa, Diverse Culinary Scene, Cultural Events, Traditional Markets |
Understanding Airbnb License Requirements & STR Laws in Čilipi (2026)
While Čilipi, Dubrovnik-Neretva County, Croatia currently shows low STR regulations, specific Airbnb license requirements might still exist or change. Always verify the latest short term rental regulations and Airbnb license requirements directly with local government authorities for Čilipi to ensure full compliance before hosting.
(Source: AirROI data, 2026, finding no licensed listings among those analyzed)
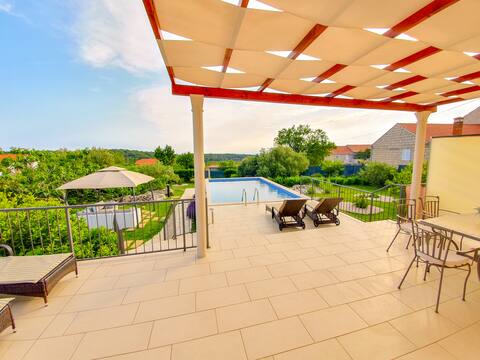
Top Performing Airbnb Properties in Čilipi (2026)
Benchmark your potential! Explore examples of top-performing Airbnb properties in Čilipibased on Trailing Twelve Month (TTM) revenue. Analyze their characteristics, revenue, occupancy rate, and ADR to understand what drives success in this market.

Villa Green & Blue-Complete Privacy & Private Pool
Entire Place • 5 bedrooms
Sunny Villa -pool, garden near Dubrovnik 4 bedroom
Entire Place • 4 bedrooms

Villa Dalma
Entire Place • 4 bedrooms

Villa Giulia, private pool, near Dubrovnik.
Entire Place • 3 bedrooms

Villa Lucija, family gateway in Dubrovnik riviera
Entire Place • 3 bedrooms

Villa Grand Pinea, private pool, near Dubrovnik
Entire Place • 5 bedrooms
Note: Performance varies based on location, size, amenities, seasonality, and management quality. Data reflects the past 12 months.
Top Performing Airbnb Hosts in Čilipi (2026)
Learn from the best! This table showcases top-performing Airbnb hosts in Čilipi based on the number of properties managed and estimated total revenue over the past year. Analyze their scale and performance metrics.
| Host Name | Properties | Grossing Revenue | Stay Reviews | Avg Rating |
|---|---|---|---|---|
| Anita | 1 | $80,930 | 11 | 5.00/5.0 |
| Marina | 1 | $70,038 | 41 | 4.98/5.0 |
| Ana | 1 | $69,822 | 32 | 5.00/5.0 |
| Kata | 3 | $63,079 | 70 | 4.99/5.0 |
| Marlous | 1 | $62,864 | 64 | 5.00/5.0 |
| Stipica | 1 | $49,286 | 23 | 4.96/5.0 |
| Antun | 2 | $45,078 | 122 | 4.96/5.0 |
| Vesna | 1 | $44,743 | 13 | 5.00/5.0 |
| Nikola | 1 | $43,545 | 11 | 5.00/5.0 |
| Žana | 1 | $38,294 | 74 | 5.00/5.0 |
Analyzing the strategies of top hosts, such as their property selection, pricing, and guest communication, can offer valuable lessons for optimizing your own Airbnb operations in Čilipi.
Dive Deeper: Advanced Čilipi STR Market Data (2026)
Ready to unlock more insights? AirROI provides access to advanced metrics and comprehensive Airbnb data for Čilipi. Explore detailed analytics beyond this report to refine your investment strategy, optimize pricing, and maximize your vacation rental profits.
Explore Advanced MetricsČilipi Short-Term Rental Market Composition (2026): Property & Room Types
Room Type Distribution
Property Type Distribution
Market Composition Insights for Čilipi
- The Čilipi Airbnb market composition is heavily skewed towards Entire Home/Apt listings, which make up 93.8% of the 32 active rentals. This indicates strong guest preference for privacy and space.
- Looking at the property type distribution in Čilipi, Apartment/Condo properties are the most common (53.1%), reflecting the local real estate landscape.
- Houses represent a significant 43.8% portion, catering likely to families or larger groups.
- Smaller segments like others (combined 3.1%) offer potential for unique stay experiences.
Čilipi Airbnb Room Capacity Analysis (2026): Bedroom Distribution
Distribution of Listings by Number of Bedrooms
Room Capacity Insights for Čilipi
- The dominant room capacity in Čilipi is 1 bedroom listings, making up 34.4% of the market. This suggests a strong demand for properties suitable for couples or solo travelers.
- Together, 1 bedroom and 2 bedrooms properties represent 56.3% of the active Airbnb listings in Čilipi, indicating a high concentration in these sizes.
- A significant 40.7% of listings offer 3+ bedrooms, catering to larger groups and families seeking more space in Čilipi.
Čilipi Vacation Rental Guest Capacity Trends (2026)
Distribution of Listings by Guest Capacity
Guest Capacity Insights for Čilipi
- The most common guest capacity trend in Čilipi vacation rentals is listings accommodating 6 guests (31.3%). This suggests the primary traveler segment is likely larger groups.
- Properties designed for 6 guests and 2 guests dominate the Čilipi STR market, accounting for 50.1% of listings.
- 47.0% of properties accommodate 6+ guests, serving the market segment for larger families or group travel in Čilipi.
- On average, properties in Čilipi are equipped to host 4.7 guests.
Čilipi Airbnb Booking Patterns (2026): Available vs. Booked Days
Available Days Distribution
Booked Days Distribution
Booking Pattern Insights for Čilipi
- The most common availability pattern in Čilipi falls within the 181-270 days range, representing 46.9% of listings. This suggests many properties have significant open periods on their calendars.
- Approximately 81.3% of listings show high availability (181+ days open annually), indicating potential for increased bookings or specific owner usage patterns.
- For booked days, the 91-180 days range is most frequent in Čilipi (46.9%), reflecting common guest stay durations or potential owner blocking patterns.
- A notable 21.9% of properties secure long booking periods (181+ days booked per year), highlighting successful long-term rental strategies or significant owner usage.
Čilipi Airbnb Minimum Stay Requirements Analysis
Distribution of Listings by Minimum Night Requirement
1 Night
14 listings
43.8% of total
2 Nights
1 listings
3.1% of total
4-6 Nights
4 listings
12.5% of total
30+ Nights
13 listings
40.6% of total
Key Insights
- The most prevalent minimum stay requirement in Čilipi is 1 Night, adopted by 43.8% of listings. This highlights the market's preference for shorter, flexible bookings.
- A significant segment (40.6%) caters to monthly stays (30+ nights) in Čilipi, pointing to opportunities in the extended-stay market.
Recommendations
- Align with the market by considering a 1 Night minimum stay, as 43.8% of Čilipi hosts use this setting.
- Explore offering discounts for stays of 30+ nights to attract the 40.6% of the market seeking extended stays.
- Adjust minimum nights based on seasonality – potentially shorter during low season and longer during peak demand periods in Čilipi.
Čilipi Airbnb Cancellation Policy Trends Analysis (2026)
Non-refundable
1 listings
3.1% of total
Super Strict 60 Days
1 listings
3.1% of total
Flexible
3 listings
9.4% of total
Moderate
10 listings
31.3% of total
Firm
14 listings
43.8% of total
Strict
3 listings
9.4% of total
Cancellation Policy Insights for Čilipi
- The prevailing Airbnb cancellation policy trend in Čilipi is Firm, used by 43.8% of listings.
- A majority (53.2%) of hosts in Čilipi utilize Firm or Strict policies, indicating a market where hosts prioritize booking security.
- Strict cancellation policies are quite rare (9.4%), potentially making listings with this policy less competitive unless justified by high demand or property type.
Recommendations for Hosts
- Consider adopting a Firm policy to align with the 43.8% market standard in Čilipi.
- Using a Strict policy might deter some guests, as only 9.4% of listings use it. Evaluate if potential revenue protection outweighs possible lower booking rates.
- Regularly review your cancellation policy against competitors and market demand shifts in Čilipi.
Čilipi STR Booking Lead Time Analysis (2026)
Average Booking Lead Time by Month
Booking Lead Time Insights for Čilipi
- The overall average booking lead time for vacation rentals in Čilipi is 90 days.
- Guests book furthest in advance for stays during August (average 109 days), likely coinciding with peak travel demand or local events.
- The shortest booking windows occur for stays in January (average 6 days), indicating more last-minute travel plans during this time.
- Seasonally, Spring (99 days avg.) sees the longest lead times, while Winter (24 days avg.) has the shortest, reflecting typical travel planning cycles.
Recommendations for Hosts
- Use the overall average lead time (90 days) as a baseline for your pricing and availability strategy in Čilipi.
- For August stays, consider implementing length-of-stay discounts or slightly higher rates for bookings made less than 109 days out to capitalize on advance planning.
- During January, focus on last-minute booking availability and promotions, as guests book with very short notice (6 days avg.).
- Target marketing efforts for the Spring season well in advance (at least 99 days) to capture early planners.
- Monitor your own booking lead times against these Čilipi averages to identify opportunities for dynamic pricing adjustments.
Popular & Essential Airbnb Amenities in Čilipi (2026)
Amenity Prevalence
Amenity Insights for Čilipi
- Essential amenities in Čilipi that guests expect include: TV, Free parking on premises, Air conditioning, Wifi. Lacking these (any) could significantly impact bookings.
- Popular amenities like Kitchen, Hair dryer, Washer are common but not universal. Offering these can provide a competitive edge.
Recommendations for Hosts
- Ensure your listing includes all essential amenities for Čilipi: TV, Free parking on premises, Air conditioning, Wifi.
- Consider adding popular differentiators like Kitchen or Hair dryer to increase appeal.
- Highlight unique or less common amenities you offer (e.g., hot tub, dedicated workspace, EV charger) in your listing description and photos.
- Regularly check competitor amenities in Čilipi to stay competitive.
Čilipi Airbnb Guest Demographics & Profile Analysis (2026)
Guest Profile Summary for Čilipi
- The typical guest profile for Airbnb in Čilipi consists of predominantly international visitors (99%), with top international origins including United Kingdom, typically belonging to the Post-2000s (Gen Z/Alpha) group (50%), primarily speaking English or French.
- Domestic travelers account for 1.2% of guests.
- Key international markets include United States (19.8%) and United Kingdom (18.5%).
- Top languages spoken are English (46.3%) followed by French (9.3%).
- A significant demographic segment is the Post-2000s (Gen Z/Alpha) group, representing 50% of guests.
Recommendations for Hosts
- Focus marketing internationally, particularly towards travelers from United Kingdom.
- Tailor amenities and listing descriptions to appeal to the dominant Post-2000s (Gen Z/Alpha) demographic (e.g., highlight fast WiFi, smart home features, local guides).
- Highlight unique local experiences or amenities relevant to the primary guest profile.
- Consider seasonal promotions aligned with peak travel times for key origin markets.
Nearby Short-Term Rental Market Comparison
How does the Čilipi Airbnb market stack up against its neighbors? Compare key performance metrics like average monthly revenue, ADR, and occupancy rates in surrounding areas to understand the broader regional STR landscape.
| Market | Active Properties | Monthly Revenue | Daily Rate | Avg. Occupancy |
|---|---|---|---|---|
| Grubine | 29 | $3,472 | $394.57 | 52% |
| Ledenice | 13 | $2,597 | $403.12 | 39% |
| Močići | 31 | $2,398 | $214.17 | 48% |
| Lapčići | 13 | $2,375 | $331.21 | 40% |
| Majkovi | 21 | $2,320 | $268.88 | 43% |
| Postranje | 15 | $2,302 | $329.19 | 42% |
| Rijeka Reževići | 16 | $2,300 | $280.54 | 47% |
| Krimovice | 30 | $2,288 | $374.55 | 35% |
| Zmijavci | 30 | $2,191 | $402.05 | 39% |
| Donji Proložac | 19 | $2,136 | $425.52 | 42% |