Pavón Airbnb Market Analysis 2026: Short Term Rental Data & Vacation Rental Statistics in Puntarenas Province, Costa Rica
Is Airbnb profitable in Pavón in 2026? Explore comprehensive Airbnb analytics for Pavón, Puntarenas Province, Costa Rica to uncover income potential. This 2026 STR market report for Pavón, based on AirROI data from February 2025 to January 2026, reveals key trends in the market of 205 active listings.
Whether you're considering an Airbnb investment in Pavón, optimizing your existing vacation rental, or exploring rental arbitrage opportunities, understanding the Pavón Airbnb data is crucial. Leveraging the low regulation environment is key to maximizing your short term rental income potential. Let's dive into the specifics.
Key Pavón Airbnb Performance Metrics Overview
Monthly Airbnb Revenue Variations & Income Potential in Pavón (2026)
Understanding the monthly revenue variations for Airbnb listings in Pavón is key to maximizing your short term rental income potential. Seasonality significantly impacts earnings. Our analysis, based on data from the past 12 months, shows that the peak revenue month for STRs in Pavón is typically May, while October often presents the lowest earnings, highlighting opportunities for strategic pricing adjustments during shoulder and low seasons. Explore the typical Airbnb income in Pavón across different performance tiers:
- Best-in-class properties (Top 10%) achieve $3,541+ monthly, often utilizing dynamic pricing and superior guest experiences.
- Strong performing properties (Top 25%) earn $1,954 or more, indicating effective management and desirable locations/amenities.
- Typical properties (Median) generate around $972 per month, representing the average market performance.
- Entry-level properties (Bottom 25%) see earnings around $444, often with potential for optimization.
Average Monthly Airbnb Earnings Trend in Pavón
Pavón Airbnb Occupancy Rate Trends (2026)
Maximize your bookings by understanding the Pavón STR occupancy trends. Seasonal demand shifts significantly influence how often properties are booked. Typically, Aprilsees the highest demand (peak season occupancy), while October experiences the lowest (low season). Effective strategies, like adjusting minimum stays or offering promotions, can boost occupancy during slower periods. Here's how different property tiers perform in Pavón:
- Best-in-class properties (Top 10%) achieve 70%+ occupancy, indicating high desirability and potentially optimized availability.
- Strong performing properties (Top 25%) maintain 49% or higher occupancy, suggesting good market fit and guest satisfaction.
- Typical properties (Median) have an occupancy rate around 28%.
- Entry-level properties (Bottom 25%) average 13% occupancy, potentially facing higher vacancy.
Average Monthly Occupancy Rate Trend in Pavón
Average Daily Rate (ADR) Airbnb Trends in Pavón (2026)
Effective short term rental pricing strategy in Pavón involves understanding monthly ADR fluctuations. The Average Daily Rate (ADR) for Airbnb in Pavón typically peaks in January and dips lowest during August. Leveraging Airbnb dynamic pricing tools or strategies based on this seasonality can significantly boost revenue. Here's a look at the typical nightly rates achieved:
- Best-in-class properties (Top 10%) command rates of $287+ per night, often due to premium features or locations.
- Strong performing properties (Top 25%) achieve nightly rates of $144 or more.
- Typical properties (Median) charge around $93 per night.
- Entry-level properties (Bottom 25%) earn around $66 per night.
Average Daily Rate (ADR) Trend by Month in Pavón
Get Live Pavón Market Intelligence 👇

Explore Real-time Analytics
Airbnb Seasonality Analysis & Trends in Pavón (2026)
Peak Season (May, April, March)
- Revenue averages $2,052 per month
- Occupancy rates average 42.3%
- Daily rates average $142
Shoulder Season
- Revenue averages $1,574 per month
- Occupancy maintains around 33.0%
- Daily rates hold near $143
Low Season (September, October, November)
- Revenue drops to average $1,077 per month
- Occupancy decreases to average 23.8%
- Daily rates adjust to average $142
Seasonality Insights for Pavón
- The Airbnb seasonality in Pavón shows highly seasonal trends requiring careful strategy. While the sections above show seasonal averages, it's also insightful to look at the extremes:
- During the high season, the absolute peak month showcases Pavón's highest earning potential, with monthly revenues capable of climbing to $2,102, occupancy reaching a high of 44.4%, and ADRs peaking at $146.
- Conversely, the slowest single month of the year, typically falling within the low season, marks the market's lowest point. In this month, revenue might dip to $915, occupancy could drop to 20.7%, and ADRs may adjust down to $140.
- Understanding both the seasonal averages and these monthly peaks and troughs in revenue, occupancy, and ADR is crucial for maximizing your Airbnb profit potential in Pavón.
Seasonal Strategies for Maximizing Profit
- Peak Season: Maximize revenue through premium pricing and potentially longer minimum stays. Ensure high availability.
- Low Season: Offer competitive pricing, special promotions (e.g., extended stay discounts), and flexible cancellation policies. Target off-season travelers like remote workers or budget-conscious guests.
- Shoulder Seasons: Implement dynamic pricing that balances peak and low rates. Target weekend travelers or specific events. Offer slightly more flexible terms than peak season.
- Regularly analyze your own performance against these Pavón seasonality benchmarks and adjust your pricing and availability strategy accordingly.
Best Areas for Airbnb Investment in Pavón (2026)
Exploring the top neighborhoods for short-term rentals in Pavón? This section highlights key areas, outlining why they are attractive for hosts and guests, along with notable local attractions. Consider these locations based on your target guest profile and investment strategy.
| Neighborhood / Area | Why Host Here? (Target Guests & Appeal) | Key Attractions & Landmarks |
|---|---|---|
| Pavón Beach | A beautiful beach destination with stunning sunsets, ideal for travelers looking for relaxation and nature. It's known for its natural beauty and calm atmosphere, making it a perfect getaway spot. | Playa Pavón, Sunset views, Kayak tours, Costa Rica's tropical wildlife, Snorkeling opportunities |
| Golfo Dulce | An unspoiled tropical paradise perfect for eco-tourism and adventure seekers. The area is rich in biodiversity and offers various outdoor activities like hiking and dolphin watching. | Golfo Dulce shoreline, Corcovado National Park, Wildlife watching, Kayaking, Dolphin tours |
| Puerto Jiménez | A bustling town that serves as a gateway to the Osa Peninsula and Corcovado National Park. It attracts tourists interested in ecotourism, providing various accommodations and services. | Corcovado National Park, Osa Wildlife Sanctuary, Local markets, Beach activities, Fishing tours |
| Drake Bay | Known for its remote beaches and incredible natural landscapes. A fantastic location for travelers looking to explore national parks and enjoy tranquil beachfront activities. | Corcovado National Park, Cano Island, Snorkeling and diving, Wildlife excursions, Turtle watching |
| Golfito | A charming town with a rich history as a banana-exporting port. It offers unique attractions and is close to nature reserves, appealing to both history and nature lovers. | Golfito Wildlife Refuge, Historical banana plantation tours, Sport fishing, Eco-tours |
| Zancudo | A picturesque beach town ideal for serene stays and water activities. Zancudo Beach offers a laid-back atmosphere with beautiful surroundings for relaxation and outdoor adventures. | Zancudo Beach, Surfing, Fishing, Nature trails, Local dining |
| Sierpe | A quaint town known for its river tours leading into mangroves and wildlife areas. It's a great spot for those looking for adventure and eco-friendly activities. | Sierpe River tours, Mangrove forests, Wildlife spotting, Boat trips, Local cuisine |
| Cabuya | A small coastal village known for its unique natural landmarks, including the Cabo Blanco Nature Reserve nearby. It attracts those who appreciate stunning landscapes and outdoor activities. | Cabo Blanco Nature Reserve, Beaches, Hiking trails, Tidal pools, Enjoying local culture |
Understanding Airbnb License Requirements & STR Laws in Pavón (2026)
While Pavón, Puntarenas Province, Costa Rica currently shows low STR regulations, specific Airbnb license requirements might still exist or change. Always verify the latest short term rental regulations and Airbnb license requirements directly with local government authorities for Pavón to ensure full compliance before hosting.
(Source: AirROI data, 2026, finding no licensed listings among those analyzed)
Top Performing Airbnb Properties in Pavón (2026)
Benchmark your potential! Explore examples of top-performing Airbnb properties in Pavónbased on Trailing Twelve Month (TTM) revenue. Analyze their characteristics, revenue, occupancy rate, and ADR to understand what drives success in this market.
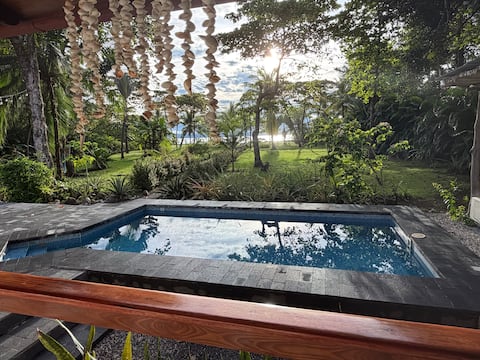
Oceanfront Oasis | Villa | Private Pool, AC, WiFi
Entire Place • 2 bedrooms

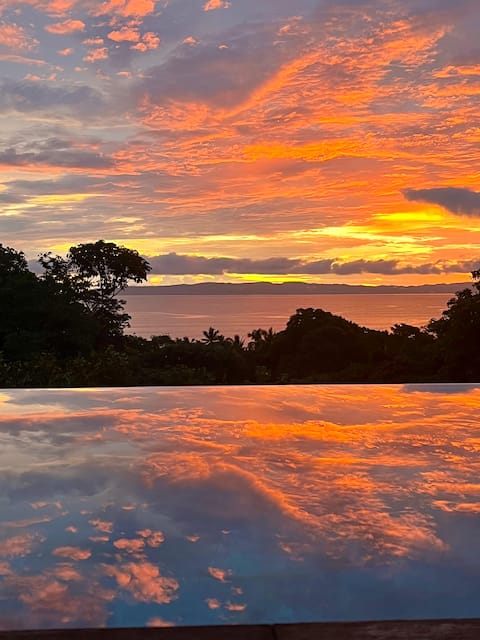
Spectacular Views of the Pavones Surf Break
Entire Place • 4 bedrooms
Tropical getaway, pool and ocean view Pavones
Entire Place • 3 bedrooms

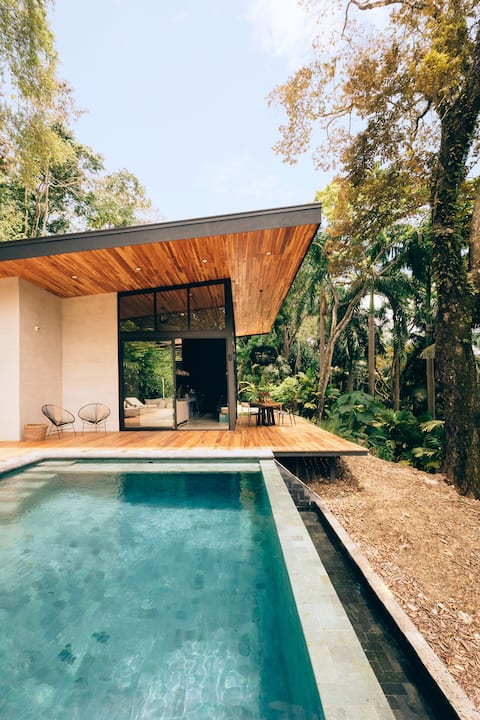
Luxury Jungle Paradise + Pool + Fast Wi-Fi + Surf
Entire Place • 2 bedrooms
Piña Hills - Close to surf + Pool + FAST internet
Entire Place • 3 bedrooms
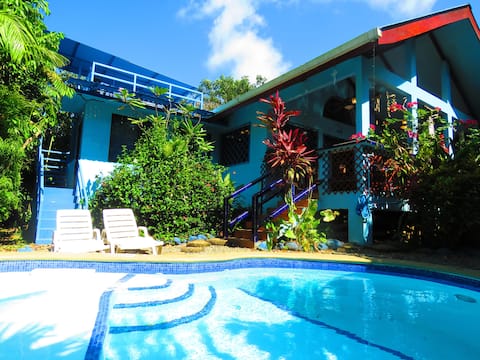
2 Houses with Pool, Casa Azul and Aloha, AC, WiFi
Entire Place • 3 bedrooms
Note: Performance varies based on location, size, amenities, seasonality, and management quality. Data reflects the past 12 months.
Top Performing Airbnb Hosts in Pavón (2026)
Learn from the best! This table showcases top-performing Airbnb hosts in Pavón based on the number of properties managed and estimated total revenue over the past year. Analyze their scale and performance metrics.
| Host Name | Properties | Grossing Revenue | Stay Reviews | Avg Rating |
|---|---|---|---|---|
| Gustavo | 5 | $182,610 | 167 | 4.84/5.0 |
| Hans Willians | 7 | $150,072 | 32 | 4.98/5.0 |
| Kelly | 4 | $117,039 | 323 | 4.96/5.0 |
| Jamie | 5 | $93,318 | 228 | 4.95/5.0 |
| Sarah | 1 | $71,875 | 108 | 4.98/5.0 |
| Taly | 3 | $64,954 | 27 | 5.00/5.0 |
| Jerome Mathieu | 1 | $61,526 | 7 | 5.00/5.0 |
| Denise | 2 | $53,265 | 183 | 4.98/5.0 |
| Nadiah | 1 | $51,876 | 24 | 4.92/5.0 |
| Ian | 3 | $51,621 | 126 | 4.91/5.0 |
Analyzing the strategies of top hosts, such as their property selection, pricing, and guest communication, can offer valuable lessons for optimizing your own Airbnb operations in Pavón.
Dive Deeper: Advanced Pavón STR Market Data (2026)
Ready to unlock more insights? AirROI provides access to advanced metrics and comprehensive Airbnb data for Pavón. Explore detailed analytics beyond this report to refine your investment strategy, optimize pricing, and maximize your vacation rental profits.
Explore Advanced MetricsPavón Short-Term Rental Market Composition (2026): Property & Room Types
Room Type Distribution
Property Type Distribution
Market Composition Insights for Pavón
- The Pavón Airbnb market composition is heavily skewed towards Entire Home/Apt listings, which make up 76.6% of the 205 active rentals. This indicates strong guest preference for privacy and space.
- Looking at the property type distribution in Pavón, House properties are the most common (62.9%), reflecting the local real estate landscape.
- Houses represent a significant 62.9% portion, catering likely to families or larger groups.
- The presence of 12.7% Hotel/Boutique listings indicates integration with traditional hospitality.
- Smaller segments like unique stays, others (combined 3.0%) offer potential for unique stay experiences.
Pavón Airbnb Room Capacity Analysis (2026): Bedroom Distribution
Distribution of Listings by Number of Bedrooms
Room Capacity Insights for Pavón
- The dominant room capacity in Pavón is 1 bedroom listings, making up 37.6% of the market. This suggests a strong demand for properties suitable for couples or solo travelers.
- Together, 1 bedroom and 2 bedrooms properties represent 65.4% of the active Airbnb listings in Pavón, indicating a high concentration in these sizes.
- A significant 22.9% of listings offer 3+ bedrooms, catering to larger groups and families seeking more space in Pavón.
Pavón Vacation Rental Guest Capacity Trends (2026)
Distribution of Listings by Guest Capacity
Guest Capacity Insights for Pavón
- The most common guest capacity trend in Pavón vacation rentals is listings accommodating 4 guests (22.9%). This suggests the primary traveler segment is likely small families or groups.
- Properties designed for 4 guests and 2 guests dominate the Pavón STR market, accounting for 44.4% of listings.
- 30.7% of properties accommodate 6+ guests, serving the market segment for larger families or group travel in Pavón.
- On average, properties in Pavón are equipped to host 4.1 guests.
Pavón Airbnb Booking Patterns (2026): Available vs. Booked Days
Available Days Distribution
Booked Days Distribution
Booking Pattern Insights for Pavón
- The most common availability pattern in Pavón falls within the 271-366 days range, representing 71.2% of listings. This suggests many properties have significant open periods on their calendars.
- Approximately 96.1% of listings show high availability (181+ days open annually), indicating potential for increased bookings or specific owner usage patterns.
- For booked days, the 31-90 days range is most frequent in Pavón (37.1%), reflecting common guest stay durations or potential owner blocking patterns.
- A notable 4.9% of properties secure long booking periods (181+ days booked per year), highlighting successful long-term rental strategies or significant owner usage.
Pavón Airbnb Minimum Stay Requirements Analysis
Distribution of Listings by Minimum Night Requirement
1 Night
70 listings
34.1% of total
2 Nights
59 listings
28.8% of total
3 Nights
23 listings
11.2% of total
4-6 Nights
13 listings
6.3% of total
7-29 Nights
2 listings
1% of total
30+ Nights
38 listings
18.5% of total
Key Insights
- The most prevalent minimum stay requirement in Pavón is 1 Night, adopted by 34.1% of listings. This highlights the market's preference for shorter, flexible bookings.
- A strong majority (62.9%) of the Pavón Airbnb data shows acceptance of very short stays (1-2 nights), indicating a dynamic, high-turnover market.
- A significant segment (18.5%) caters to monthly stays (30+ nights) in Pavón, pointing to opportunities in the extended-stay market.
Recommendations
- Align with the market by considering a 1 Night minimum stay, as 34.1% of Pavón hosts use this setting.
- Explore offering discounts for stays of 30+ nights to attract the 18.5% of the market seeking extended stays.
- Adjust minimum nights based on seasonality – potentially shorter during low season and longer during peak demand periods in Pavón.
Pavón Airbnb Cancellation Policy Trends Analysis (2026)
Limited
1 listings
0.5% of total
Super Strict 30 Days
4 listings
2% of total
Flexible
58 listings
28.3% of total
Moderate
40 listings
19.5% of total
Firm
61 listings
29.8% of total
Strict
41 listings
20% of total
Cancellation Policy Insights for Pavón
- The prevailing Airbnb cancellation policy trend in Pavón is Firm, used by 29.8% of listings.
- There's a relatively balanced mix between guest-friendly (47.8%) and stricter (49.8%) policies, offering choices for different guest needs.
Recommendations for Hosts
- Consider adopting a Firm policy to align with the 29.8% market standard in Pavón.
- Regularly review your cancellation policy against competitors and market demand shifts in Pavón.
Pavón STR Booking Lead Time Analysis (2026)
Average Booking Lead Time by Month
Booking Lead Time Insights for Pavón
- The overall average booking lead time for vacation rentals in Pavón is 44 days.
- Guests book furthest in advance for stays during December (average 62 days), likely coinciding with peak travel demand or local events.
- The shortest booking windows occur for stays in October (average 28 days), indicating more last-minute travel plans during this time.
- Seasonally, Winter (55 days avg.) sees the longest lead times, while Fall (36 days avg.) has the shortest, reflecting typical travel planning cycles.
Recommendations for Hosts
- Use the overall average lead time (44 days) as a baseline for your pricing and availability strategy in Pavón.
- For December stays, consider implementing length-of-stay discounts or slightly higher rates for bookings made less than 62 days out to capitalize on advance planning.
- Target marketing efforts for the Winter season well in advance (at least 55 days) to capture early planners.
- Monitor your own booking lead times against these Pavón averages to identify opportunities for dynamic pricing adjustments.
Popular & Essential Airbnb Amenities in Pavón (2026)
Amenity Prevalence
Amenity Insights for Pavón
- Essential amenities in Pavón that guests expect include: Wifi, Free parking on premises. Lacking these (any) could significantly impact bookings.
- Popular amenities like Kitchen, Coffee maker, Refrigerator are common but not universal. Offering these can provide a competitive edge.
Recommendations for Hosts
- Ensure your listing includes all essential amenities for Pavón: Wifi, Free parking on premises.
- Prioritize adding missing essentials: Wifi, Free parking on premises.
- Consider adding popular differentiators like Kitchen or Coffee maker to increase appeal.
- Highlight unique or less common amenities you offer (e.g., hot tub, dedicated workspace, EV charger) in your listing description and photos.
- Regularly check competitor amenities in Pavón to stay competitive.
Pavón Airbnb Guest Demographics & Profile Analysis (2026)
Guest Profile Summary for Pavón
- The typical guest profile for Airbnb in Pavón consists of predominantly international visitors (80%), with top international origins including Costa Rica, typically belonging to the Post-2000s (Gen Z/Alpha) group (50%), primarily speaking English or Spanish.
- Domestic travelers account for 19.6% of guests.
- Key international markets include United States (47.4%) and Costa Rica (19.6%).
- Top languages spoken are English (47.8%) followed by Spanish (28.4%).
- A significant demographic segment is the Post-2000s (Gen Z/Alpha) group, representing 50% of guests.
Recommendations for Hosts
- Focus marketing internationally, particularly towards travelers from Costa Rica.
- Tailor amenities and listing descriptions to appeal to the dominant Post-2000s (Gen Z/Alpha) demographic (e.g., highlight fast WiFi, smart home features, local guides).
- Highlight unique local experiences or amenities relevant to the primary guest profile.
- Consider seasonal promotions aligned with peak travel times for key origin markets.
Nearby Short-Term Rental Market Comparison
How does the Pavón Airbnb market stack up against its neighbors? Compare key performance metrics like average monthly revenue, ADR, and occupancy rates in surrounding areas to understand the broader regional STR landscape.
| Market | Active Properties | Monthly Revenue | Daily Rate | Avg. Occupancy |
|---|---|---|---|---|
| Osa | 10 | $3,418 | $586.45 | 32% |
| Savegre de Aguirre | 15 | $2,740 | $372.47 | 36% |
| Quepos | 1,172 | $2,594 | $246.50 | 39% |
| Caldera | 36 | $2,490 | $270.58 | 33% |
| Jacó | 2,135 | $2,188 | $296.12 | 33% |
| Savegre | 186 | $2,150 | $256.31 | 34% |
| Bahía Ballena | 1,282 | $2,099 | $237.59 | 37% |
| Tárcoles | 294 | $1,978 | $253.51 | 30% |
| El Roble | 22 | $1,805 | $219.87 | 32% |
| Parrita | 552 | $1,561 | $213.28 | 31% |