El Hormiguero Airbnb Market Analysis 2026: Short Term Rental Data & Vacation Rental Statistics in Valle del Cauca, Colombia
Is Airbnb profitable in El Hormiguero in 2026? Explore comprehensive Airbnb analytics for El Hormiguero, Valle del Cauca, Colombia to uncover income potential. This 2026 STR market report for El Hormiguero, based on AirROI data from February 2025 to January 2026, reveals key trends in the niche market of 104 active listings.
Whether you're considering an Airbnb investment in El Hormiguero, optimizing your existing vacation rental, or exploring rental arbitrage opportunities, understanding the El Hormiguero Airbnb data is crucial. Navigating the high regulation landscape is key to maximizing your short term rental income potential. Let's dive into the specifics.
Key El Hormiguero Airbnb Performance Metrics Overview
Monthly Airbnb Revenue Variations & Income Potential in El Hormiguero (2026)
Understanding the monthly revenue variations for Airbnb listings in El Hormiguero is key to maximizing your short term rental income potential. Seasonality significantly impacts earnings. Our analysis, based on data from the past 12 months, shows that the peak revenue month for STRs in El Hormiguero is typically December, while May often presents the lowest earnings, highlighting opportunities for strategic pricing adjustments during shoulder and low seasons. Explore the typical Airbnb income in El Hormiguero across different performance tiers:
- Best-in-class properties (Top 10%) achieve $972+ monthly, often utilizing dynamic pricing and superior guest experiences.
- Strong performing properties (Top 25%) earn $631 or more, indicating effective management and desirable locations/amenities.
- Typical properties (Median) generate around $341 per month, representing the average market performance.
- Entry-level properties (Bottom 25%) see earnings around $143, often with potential for optimization.
Average Monthly Airbnb Earnings Trend in El Hormiguero
El Hormiguero Airbnb Occupancy Rate Trends (2026)
Maximize your bookings by understanding the El Hormiguero STR occupancy trends. Seasonal demand shifts significantly influence how often properties are booked. Typically, Julysees the highest demand (peak season occupancy), while January experiences the lowest (low season). Effective strategies, like adjusting minimum stays or offering promotions, can boost occupancy during slower periods. Here's how different property tiers perform in El Hormiguero:
- Best-in-class properties (Top 10%) achieve 75%+ occupancy, indicating high desirability and potentially optimized availability.
- Strong performing properties (Top 25%) maintain 54% or higher occupancy, suggesting good market fit and guest satisfaction.
- Typical properties (Median) have an occupancy rate around 31%.
- Entry-level properties (Bottom 25%) average 15% occupancy, potentially facing higher vacancy.
Average Monthly Occupancy Rate Trend in El Hormiguero
Average Daily Rate (ADR) Airbnb Trends in El Hormiguero (2026)
Effective short term rental pricing strategy in El Hormiguero involves understanding monthly ADR fluctuations. The Average Daily Rate (ADR) for Airbnb in El Hormiguero typically peaks in December and dips lowest during February. Leveraging Airbnb dynamic pricing tools or strategies based on this seasonality can significantly boost revenue. Here's a look at the typical nightly rates achieved:
- Best-in-class properties (Top 10%) command rates of $56+ per night, often due to premium features or locations.
- Strong performing properties (Top 25%) achieve nightly rates of $46 or more.
- Typical properties (Median) charge around $37 per night.
- Entry-level properties (Bottom 25%) earn around $29 per night.
Average Daily Rate (ADR) Trend by Month in El Hormiguero
Get Live El Hormiguero Market Intelligence 👇

Explore Real-time Analytics
Airbnb Seasonality Analysis & Trends in El Hormiguero (2026)
Peak Season (December, July, August)
- Revenue averages $528 per month
- Occupancy rates average 38.1%
- Daily rates average $41
Shoulder Season
- Revenue averages $429 per month
- Occupancy maintains around 33.6%
- Daily rates hold near $41
Low Season (February, March, May)
- Revenue drops to average $378 per month
- Occupancy decreases to average 36.8%
- Daily rates adjust to average $38
Seasonality Insights for El Hormiguero
- The Airbnb seasonality in El Hormiguero shows moderate seasonality with distinct peak and low periods. While the sections above show seasonal averages, it's also insightful to look at the extremes:
- During the high season, the absolute peak month showcases El Hormiguero's highest earning potential, with monthly revenues capable of climbing to $581, occupancy reaching a high of 43.4%, and ADRs peaking at $45.
- Conversely, the slowest single month of the year, typically falling within the low season, marks the market's lowest point. In this month, revenue might dip to $349, occupancy could drop to 27.8%, and ADRs may adjust down to $37.
- Understanding both the seasonal averages and these monthly peaks and troughs in revenue, occupancy, and ADR is crucial for maximizing your Airbnb profit potential in El Hormiguero.
Seasonal Strategies for Maximizing Profit
- Peak Season: Maximize revenue through premium pricing and potentially longer minimum stays. Ensure high availability.
- Low Season: Offer competitive pricing, special promotions (e.g., extended stay discounts), and flexible cancellation policies. Target off-season travelers like remote workers or budget-conscious guests.
- Shoulder Seasons: Implement dynamic pricing that balances peak and low rates. Target weekend travelers or specific events. Offer slightly more flexible terms than peak season.
- Regularly analyze your own performance against these El Hormiguero seasonality benchmarks and adjust your pricing and availability strategy accordingly.
Best Areas for Airbnb Investment in El Hormiguero (2026)
Exploring the top neighborhoods for short-term rentals in El Hormiguero? This section highlights key areas, outlining why they are attractive for hosts and guests, along with notable local attractions. Consider these locations based on your target guest profile and investment strategy.
| Neighborhood / Area | Why Host Here? (Target Guests & Appeal) | Key Attractions & Landmarks |
|---|---|---|
| El Hormiguero Centro | The heart of El Hormiguero, offering easy access to local shops, restaurants, and cultural sites. Ideal for those wanting to experience local life and convenience. | Plaza Principal, Local markets, Café del Parque, La Iglesia de San Juan Bautista |
| La Quebrada | A scenic area known for its beautiful landscapes and tranquility. Perfect for guests seeking a peaceful retreat close to nature. | Natural parks, Hiking trails, River visits, Bird watching opportunities |
| Las Palmas | A residential neighborhood with a friendly atmosphere, attracting families and long-term visitors. Good for those looking for a homely stay with amenities nearby. | Community parks, Family-friendly cafes, Local schools |
| El Trébol | A vibrant working-class area with a rich community feel. Great for guests who want to mingle with locals and experience authentic Colombian culture. | Street food vendors, Local music scene, Community festivals |
| Valle de Cauca | The surrounding area is rich in biodiversity and culture, offering guests a mix of adventure and relaxation opportunities in a beautiful setting. | Café plantations, Nature reserves, Cultural events |
| La Naranja | Known for its citrus orchards and agricultural charm, this area provides a unique rural experience away from the busy urban centers. | Agricultural tours, Citrus tasting, Rural traditions |
| El Chaparral | Offers stunning views and a cooler climate, making it a desirable getaway for visitors looking to escape the heat and enjoy nature. | Scenic viewpoints, Cool breezes, Tranquil hikes |
| Puerto Nuevo | A coastal area offering beaches and recreational activities. Ideal for guests looking for outdoor adventures such as fishing or beach sports. | Beach access, Fishing spots, Watersports activities |
Understanding Airbnb License Requirements & STR Laws in El Hormiguero (2026)
Yes, El Hormiguero, Valle del Cauca, Colombia enforces high STR regulations. Obtaining a license and ensuring compliance is almost certainly required according to current 2026 STR laws. Always verify the latest short term rental regulations and Airbnb license requirements directly with local government authorities for El Hormiguero to ensure full compliance before hosting.
(Source: AirROI data, 2026, based on 89% licensed listings)
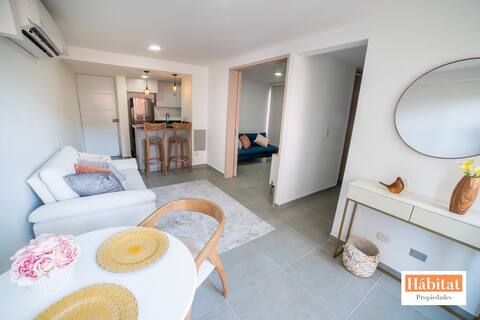
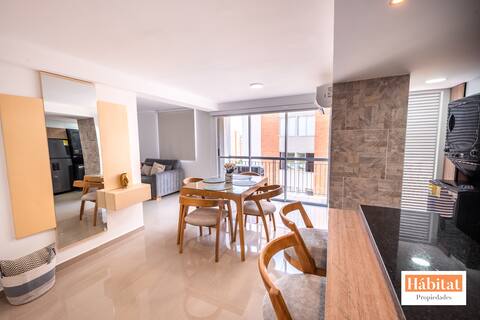
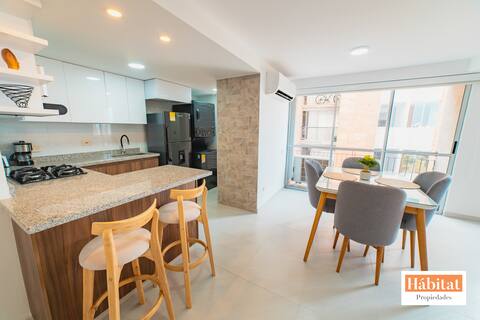
Top Performing Airbnb Properties in El Hormiguero (2026)
Benchmark your potential! Explore examples of top-performing Airbnb properties in El Hormiguerobased on Trailing Twelve Month (TTM) revenue. Analyze their characteristics, revenue, occupancy rate, and ADR to understand what drives success in this market.

Modern Condo in south of Cali favorite experience
Entire Place • 2 bedrooms
New Apto With Beautiful Details
Entire Place • 2 bedrooms
Cozy Brand New Apt
Entire Place • 2 bedrooms
Beautiful Brand New Apt
Entire Place • 2 bedrooms

Fresh apt in a shopping area with full 500 MB WiFi GYM
Entire Place • 3 bedrooms

Modern Apartment in Valle del Lili
Entire Place • 3 bedrooms
Note: Performance varies based on location, size, amenities, seasonality, and management quality. Data reflects the past 12 months.
Top Performing Airbnb Hosts in El Hormiguero (2026)
Learn from the best! This table showcases top-performing Airbnb hosts in El Hormiguero based on the number of properties managed and estimated total revenue over the past year. Analyze their scale and performance metrics.
| Host Name | Properties | Grossing Revenue | Stay Reviews | Avg Rating |
|---|---|---|---|---|
| Juan | 6 | $43,671 | 187 | 4.84/5.0 |
| Edinson | 2 | $15,739 | 56 | 4.84/5.0 |
| Andres Fernando | 4 | $15,527 | 163 | 4.75/5.0 |
| Cuamora | 1 | $10,305 | 73 | 4.92/5.0 |
| José Luis | 1 | $8,936 | 177 | 4.81/5.0 |
| Lucia | 1 | $8,681 | 86 | 4.93/5.0 |
| M. Celeste | 1 | $8,473 | 89 | 4.74/5.0 |
| Rene | 2 | $8,117 | 49 | 4.88/5.0 |
| Jhon Faber | 1 | $8,067 | 52 | 4.87/5.0 |
| Host Cali-Bogota | 4 | $8,005 | 138 | 4.72/5.0 |
Analyzing the strategies of top hosts, such as their property selection, pricing, and guest communication, can offer valuable lessons for optimizing your own Airbnb operations in El Hormiguero.
Dive Deeper: Advanced El Hormiguero STR Market Data (2026)
Ready to unlock more insights? AirROI provides access to advanced metrics and comprehensive Airbnb data for El Hormiguero. Explore detailed analytics beyond this report to refine your investment strategy, optimize pricing, and maximize your vacation rental profits.
Explore Advanced MetricsEl Hormiguero Short-Term Rental Market Composition (2026): Property & Room Types
Room Type Distribution
Property Type Distribution
Market Composition Insights for El Hormiguero
- The El Hormiguero Airbnb market composition is heavily skewed towards Entire Home/Apt listings, which make up 92.3% of the 104 active rentals. This indicates strong guest preference for privacy and space.
- Looking at the property type distribution in El Hormiguero, Apartment/Condo properties are the most common (94.2%), reflecting the local real estate landscape.
- Smaller segments like house, hotel/boutique (combined 5.8%) offer potential for unique stay experiences.
El Hormiguero Airbnb Room Capacity Analysis (2026): Bedroom Distribution
Distribution of Listings by Number of Bedrooms
Room Capacity Insights for El Hormiguero
- The dominant room capacity in El Hormiguero is 2 bedrooms listings, making up 45.2% of the market. This suggests a strong demand for properties suitable for couples or solo travelers.
- Together, 2 bedrooms and 3 bedrooms properties represent 84.6% of the active Airbnb listings in El Hormiguero, indicating a high concentration in these sizes.
- A significant 40.4% of listings offer 3+ bedrooms, catering to larger groups and families seeking more space in El Hormiguero.
El Hormiguero Vacation Rental Guest Capacity Trends (2026)
Distribution of Listings by Guest Capacity
Guest Capacity Insights for El Hormiguero
- The most common guest capacity trend in El Hormiguero vacation rentals is listings accommodating 5 guests (35.6%). This suggests the primary traveler segment is likely larger groups.
- Properties designed for 5 guests and 4 guests dominate the El Hormiguero STR market, accounting for 63.5% of listings.
- 18.3% of properties accommodate 6+ guests, serving the market segment for larger families or group travel in El Hormiguero.
- On average, properties in El Hormiguero are equipped to host 4.3 guests.
El Hormiguero Airbnb Booking Patterns (2026): Available vs. Booked Days
Available Days Distribution
Booked Days Distribution
Booking Pattern Insights for El Hormiguero
- The most common availability pattern in El Hormiguero falls within the 271-366 days range, representing 68.3% of listings. This suggests many properties have significant open periods on their calendars.
- Approximately 93.3% of listings show high availability (181+ days open annually), indicating potential for increased bookings or specific owner usage patterns.
- For booked days, the 1-30 days range is most frequent in El Hormiguero (32.7%), reflecting common guest stay durations or potential owner blocking patterns.
- A notable 6.7% of properties secure long booking periods (181+ days booked per year), highlighting successful long-term rental strategies or significant owner usage.
El Hormiguero Airbnb Minimum Stay Requirements Analysis
Distribution of Listings by Minimum Night Requirement
1 Night
11 listings
10.6% of total
2 Nights
17 listings
16.3% of total
3 Nights
3 listings
2.9% of total
4-6 Nights
20 listings
19.2% of total
7-29 Nights
24 listings
23.1% of total
30+ Nights
29 listings
27.9% of total
Key Insights
- The most prevalent minimum stay requirement in El Hormiguero is 30+ Nights, adopted by 27.9% of listings. This highlights the market's preference for longer commitments.
- A significant segment (27.9%) caters to monthly stays (30+ nights) in El Hormiguero, pointing to opportunities in the extended-stay market.
Recommendations
- Align with the market by considering a 30+ Nights minimum stay, as 27.9% of El Hormiguero hosts use this setting.
- If feasible, allowing 1-night stays, especially midweek or during low season, could capture last-minute bookings, as only 10.6% currently do.
- Explore offering discounts for stays of 30+ nights to attract the 27.9% of the market seeking extended stays.
- Adjust minimum nights based on seasonality – potentially shorter during low season and longer during peak demand periods in El Hormiguero.
El Hormiguero Airbnb Cancellation Policy Trends Analysis (2026)
Limited
2 listings
1.9% of total
Flexible
54 listings
51.9% of total
Moderate
20 listings
19.2% of total
Firm
21 listings
20.2% of total
Strict
7 listings
6.7% of total
Cancellation Policy Insights for El Hormiguero
- The prevailing Airbnb cancellation policy trend in El Hormiguero is Flexible, used by 51.9% of listings.
- The market strongly favors guest-friendly terms, with 71.1% of listings offering Flexible or Moderate policies. This suggests guests in El Hormiguero may expect booking flexibility.
- Strict cancellation policies are quite rare (6.7%), potentially making listings with this policy less competitive unless justified by high demand or property type.
Recommendations for Hosts
- Consider adopting a Flexible policy to align with the 51.9% market standard in El Hormiguero.
- Given the high prevalence of Flexible policies (51.9%), offering this can enhance booking appeal, especially during shoulder seasons.
- Using a Strict policy might deter some guests, as only 6.7% of listings use it. Evaluate if potential revenue protection outweighs possible lower booking rates.
- Regularly review your cancellation policy against competitors and market demand shifts in El Hormiguero.
El Hormiguero STR Booking Lead Time Analysis (2026)
Average Booking Lead Time by Month
Booking Lead Time Insights for El Hormiguero
- The overall average booking lead time for vacation rentals in El Hormiguero is 16 days.
- Guests book furthest in advance for stays during December (average 58 days), likely coinciding with peak travel demand or local events.
- The shortest booking windows occur for stays in September (average 7 days), indicating more last-minute travel plans during this time.
- Seasonally, Winter (31 days avg.) sees the longest lead times, while Fall (12 days avg.) has the shortest, reflecting typical travel planning cycles.
Recommendations for Hosts
- Use the overall average lead time (16 days) as a baseline for your pricing and availability strategy in El Hormiguero.
- For December stays, consider implementing length-of-stay discounts or slightly higher rates for bookings made less than 58 days out to capitalize on advance planning.
- During September, focus on last-minute booking availability and promotions, as guests book with very short notice (7 days avg.).
- Target marketing efforts for the Winter season well in advance (at least 31 days) to capture early planners.
- Monitor your own booking lead times against these El Hormiguero averages to identify opportunities for dynamic pricing adjustments.
Popular & Essential Airbnb Amenities in El Hormiguero (2026)
Amenity Prevalence
Amenity Insights for El Hormiguero
- Essential amenities in El Hormiguero that guests expect include: Wifi, TV, Kitchen, Washer. Lacking these (any) could significantly impact bookings.
- Popular amenities like Pool, Free parking on premises, Dishes and silverware are common but not universal. Offering these can provide a competitive edge.
- A pool is a highly desired but not standard amenity, making it a key feature for attracting guests seeking leisure in El Hormiguero.
Recommendations for Hosts
- Ensure your listing includes all essential amenities for El Hormiguero: Wifi, TV, Kitchen, Washer.
- Prioritize adding missing essentials: TV, Kitchen, Washer.
- Consider adding popular differentiators like Pool or Free parking on premises to increase appeal.
- Highlight unique or less common amenities you offer (e.g., hot tub, dedicated workspace, EV charger) in your listing description and photos.
- Regularly check competitor amenities in El Hormiguero to stay competitive.
El Hormiguero Airbnb Guest Demographics & Profile Analysis (2026)
Guest Profile Summary for El Hormiguero
- The typical guest profile for Airbnb in El Hormiguero consists of a mix of domestic (65%) and international guests, often arriving from nearby Bogotá, typically belonging to the Post-2000s (Gen Z/Alpha) group (50%), primarily speaking Spanish or English.
- Domestic travelers account for 64.6% of guests.
- Key international markets include Colombia (64.6%) and United States (19.6%).
- Top languages spoken are Spanish (48.2%) followed by English (34.1%).
- A significant demographic segment is the Post-2000s (Gen Z/Alpha) group, representing 50% of guests.
Recommendations for Hosts
- Target domestic marketing efforts towards travelers from Bogotá and Cali.
- Tailor amenities and listing descriptions to appeal to the dominant Post-2000s (Gen Z/Alpha) demographic (e.g., highlight fast WiFi, smart home features, local guides).
- Highlight unique local experiences or amenities relevant to the primary guest profile.
- Consider seasonal promotions aligned with peak travel times for key origin markets.
Nearby Short-Term Rental Market Comparison
How does the El Hormiguero Airbnb market stack up against its neighbors? Compare key performance metrics like average monthly revenue, ADR, and occupancy rates in surrounding areas to understand the broader regional STR landscape.
| Market | Active Properties | Monthly Revenue | Daily Rate | Avg. Occupancy |
|---|---|---|---|---|
| La Buitrera | 15 | $1,161 | $146.95 | 26% |
| Calima Lake | 18 | $775 | $217.48 | 16% |
| Quimbaya | 193 | $756 | $133.90 | 24% |
| Calima | 196 | $699 | $178.59 | 17% |
| El Cerrito | 55 | $675 | $124.19 | 22% |
| Restrepo | 20 | $670 | $179.01 | 19% |
| Alcalá | 29 | $633 | $204.86 | 18% |
| Pance | 28 | $625 | $81.74 | 34% |
| Montenegro | 276 | $618 | $136.40 | 23% |
| La Tebaida | 219 | $568 | $115.52 | 25% |