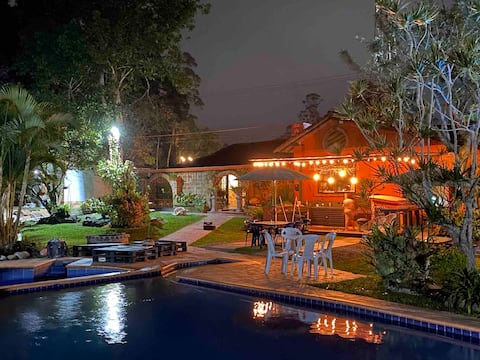
Piedecuesta Airbnb Market Analysis 2026: Short Term Rental Data & Vacation Rental Statistics in Santander, Colombia
Is Airbnb profitable in Piedecuesta in 2026? Explore comprehensive Airbnb analytics for Piedecuesta, Santander, Colombia to uncover income potential. This 2026 STR market report for Piedecuesta, based on AirROI data from February 2025 to January 2026, reveals key trends in the niche market of 98 active listings.
Whether you're considering an Airbnb investment in Piedecuesta, optimizing your existing vacation rental, or exploring rental arbitrage opportunities, understanding the Piedecuesta Airbnb data is crucial. Navigating the high regulation landscape is key to maximizing your short term rental income potential. Let's dive into the specifics.
Key Piedecuesta Airbnb Performance Metrics Overview
Monthly Airbnb Revenue Variations & Income Potential in Piedecuesta (2026)
Understanding the monthly revenue variations for Airbnb listings in Piedecuesta is key to maximizing your short term rental income potential. Seasonality significantly impacts earnings. Our analysis, based on data from the past 12 months, shows that the peak revenue month for STRs in Piedecuesta is typically December, while February often presents the lowest earnings, highlighting opportunities for strategic pricing adjustments during shoulder and low seasons. Explore the typical Airbnb income in Piedecuesta across different performance tiers:
- Best-in-class properties (Top 10%) achieve $1,782+ monthly, often utilizing dynamic pricing and superior guest experiences.
- Strong performing properties (Top 25%) earn $845 or more, indicating effective management and desirable locations/amenities.
- Typical properties (Median) generate around $384 per month, representing the average market performance.
- Entry-level properties (Bottom 25%) see earnings around $171, often with potential for optimization.
Average Monthly Airbnb Earnings Trend in Piedecuesta
Piedecuesta Airbnb Occupancy Rate Trends (2026)
Maximize your bookings by understanding the Piedecuesta STR occupancy trends. Seasonal demand shifts significantly influence how often properties are booked. Typically, Augustsees the highest demand (peak season occupancy), while January experiences the lowest (low season). Effective strategies, like adjusting minimum stays or offering promotions, can boost occupancy during slower periods. Here's how different property tiers perform in Piedecuesta:
- Best-in-class properties (Top 10%) achieve 63%+ occupancy, indicating high desirability and potentially optimized availability.
- Strong performing properties (Top 25%) maintain 35% or higher occupancy, suggesting good market fit and guest satisfaction.
- Typical properties (Median) have an occupancy rate around 18%.
- Entry-level properties (Bottom 25%) average 9% occupancy, potentially facing higher vacancy.
Average Monthly Occupancy Rate Trend in Piedecuesta
Average Daily Rate (ADR) Airbnb Trends in Piedecuesta (2026)
Effective short term rental pricing strategy in Piedecuesta involves understanding monthly ADR fluctuations. The Average Daily Rate (ADR) for Airbnb in Piedecuesta typically peaks in December and dips lowest during February. Leveraging Airbnb dynamic pricing tools or strategies based on this seasonality can significantly boost revenue. Here's a look at the typical nightly rates achieved:
- Best-in-class properties (Top 10%) command rates of $197+ per night, often due to premium features or locations.
- Strong performing properties (Top 25%) achieve nightly rates of $135 or more.
- Typical properties (Median) charge around $69 per night.
- Entry-level properties (Bottom 25%) earn around $36 per night.
Average Daily Rate (ADR) Trend by Month in Piedecuesta
Get Live Piedecuesta Market Intelligence 👇

Explore Real-time Analytics
Airbnb Seasonality Analysis & Trends in Piedecuesta (2026)
Peak Season (December, April, March)
- Revenue averages $883 per month
- Occupancy rates average 27.4%
- Daily rates average $98
Shoulder Season
- Revenue averages $737 per month
- Occupancy maintains around 26.7%
- Daily rates hold near $98
Low Season (January, February, May)
- Revenue drops to average $602 per month
- Occupancy decreases to average 22.3%
- Daily rates adjust to average $98
Seasonality Insights for Piedecuesta
- The Airbnb seasonality in Piedecuesta shows moderate seasonality with distinct peak and low periods. While the sections above show seasonal averages, it's also insightful to look at the extremes:
- During the high season, the absolute peak month showcases Piedecuesta's highest earning potential, with monthly revenues capable of climbing to $944, occupancy reaching a high of 29.8%, and ADRs peaking at $104.
- Conversely, the slowest single month of the year, typically falling within the low season, marks the market's lowest point. In this month, revenue might dip to $551, occupancy could drop to 20.6%, and ADRs may adjust down to $93.
- Understanding both the seasonal averages and these monthly peaks and troughs in revenue, occupancy, and ADR is crucial for maximizing your Airbnb profit potential in Piedecuesta.
Seasonal Strategies for Maximizing Profit
- Peak Season: Maximize revenue through premium pricing and potentially longer minimum stays. Ensure high availability.
- Low Season: Offer competitive pricing, special promotions (e.g., extended stay discounts), and flexible cancellation policies. Target off-season travelers like remote workers or budget-conscious guests.
- Shoulder Seasons: Implement dynamic pricing that balances peak and low rates. Target weekend travelers or specific events. Offer slightly more flexible terms than peak season.
- Regularly analyze your own performance against these Piedecuesta seasonality benchmarks and adjust your pricing and availability strategy accordingly.
Best Areas for Airbnb Investment in Piedecuesta (2026)
Exploring the top neighborhoods for short-term rentals in Piedecuesta? This section highlights key areas, outlining why they are attractive for hosts and guests, along with notable local attractions. Consider these locations based on your target guest profile and investment strategy.
| Neighborhood / Area | Why Host Here? (Target Guests & Appeal) | Key Attractions & Landmarks |
|---|---|---|
| Cerro Buitradero | A scenic area with beautiful views of the surrounding mountains, attracting nature lovers and hikers. It's perfect for those looking to escape the city and enjoy a peaceful retreat. | Cerro Buitradero viewpoint, Nature trails, Birdwatching spots |
| Parque Principal | The main park in Piedecuesta, a central gathering spot for locals with numerous events and activities. Ideal for tourists wanting a feel for local life and culture. | Local markets, Cultural events, Food stalls, Festivals |
| La Cumbre | An upscale neighborhood known for its tranquility and lush greenery. Suitable for families and those looking for a more residential experience while still being close to attractions. | Local parks, Private homes, Community events |
| Valle del Cauca | A picturesque valley area with wide-open spaces and natural beauty, popular for outdoor activities and providing a serene environment for relaxation. | Hiking trails, Scenic views, Nature photography |
| La Meseta | A higher altitude area that offers cooler temperatures and stunning views, popular among tourists seeking a getaway from the heat. | Overlook points, Walking trails, Wildflower meadows |
| Centro Histórico | The historic center of Piedecuesta offers a glimpse into the local traditions and architecture. Great for tourists interested in history and culture. | Old churches, Historic buildings, Local eateries |
| Los Nogales | A residential area that is gaining popularity and offers amenities like shopping and dining, making it convenient for short-term stays. | Shopping centers, Restaurants, Cafes |
| El Poblado | A charming neighborhood known for its vibrant community and nightlife, appealing to younger tourists looking for entertainment and social interaction. | Bars, Live music venues, Social clubs |
Understanding Airbnb License Requirements & STR Laws in Piedecuesta (2026)
Yes, Piedecuesta, Santander, Colombia enforces high STR regulations. Obtaining a license and ensuring compliance is almost certainly required according to current 2026 STR laws. Always verify the latest short term rental regulations and Airbnb license requirements directly with local government authorities for Piedecuesta to ensure full compliance before hosting.
(Source: AirROI data, 2026, based on 94% licensed listings)
Top Performing Airbnb Properties in Piedecuesta (2026)
Benchmark your potential! Explore examples of top-performing Airbnb properties in Piedecuestabased on Trailing Twelve Month (TTM) revenue. Analyze their characteristics, revenue, occupancy rate, and ADR to understand what drives success in this market.

Large country house near Bucaramanga
Entire Place • 5 bedrooms

Ruitoque Beautiful Magic House full of nature
Entire Place • 5 bedrooms
Hacienda las Trucas
Entire Place • 7 bedrooms

San Sebastián, Boutique Farm
Entire Place • 4 bedrooms

Country house in a condominium complex
Entire Place • 3 bedrooms

New lake Cabin Ruitoque Golf Country Club
Entire Place • 3 bedrooms
Note: Performance varies based on location, size, amenities, seasonality, and management quality. Data reflects the past 12 months.
Top Performing Airbnb Hosts in Piedecuesta (2026)
Learn from the best! This table showcases top-performing Airbnb hosts in Piedecuesta based on the number of properties managed and estimated total revenue over the past year. Analyze their scale and performance metrics.
| Host Name | Properties | Grossing Revenue | Stay Reviews | Avg Rating |
|---|---|---|---|---|
| Angel | 1 | $50,635 | 39 | 4.87/5.0 |
| Hernan | 1 | $32,796 | 44 | 4.82/5.0 |
| Andres | 1 | $26,740 | 16 | 4.75/5.0 |
| Juan | 1 | $22,056 | 41 | 4.83/5.0 |
| Eider | 1 | $19,052 | 15 | 4.93/5.0 |
| Luz Amparo | 1 | $16,316 | 9 | 4.89/5.0 |
| Paola | 1 | $15,956 | 70 | 4.86/5.0 |
| Paula | 1 | $15,375 | 6 | 4.83/5.0 |
| Julian | 1 | $15,297 | 18 | 5.00/5.0 |
| Nestor Orlando | 1 | $13,701 | 4 | 5.00/5.0 |
Analyzing the strategies of top hosts, such as their property selection, pricing, and guest communication, can offer valuable lessons for optimizing your own Airbnb operations in Piedecuesta.
Dive Deeper: Advanced Piedecuesta STR Market Data (2026)
Ready to unlock more insights? AirROI provides access to advanced metrics and comprehensive Airbnb data for Piedecuesta. Explore detailed analytics beyond this report to refine your investment strategy, optimize pricing, and maximize your vacation rental profits.
Explore Advanced MetricsPiedecuesta Short-Term Rental Market Composition (2026): Property & Room Types
Room Type Distribution
Property Type Distribution
Market Composition Insights for Piedecuesta
- The Piedecuesta Airbnb market composition is heavily skewed towards Entire Home/Apt listings, which make up 91.8% of the 98 active rentals. This indicates strong guest preference for privacy and space.
- Looking at the property type distribution in Piedecuesta, Apartment/Condo properties are the most common (36.7%), reflecting the local real estate landscape.
- Houses represent a significant 28.6% portion, catering likely to families or larger groups.
- The presence of 5.1% Hotel/Boutique listings indicates integration with traditional hospitality.
Piedecuesta Airbnb Room Capacity Analysis (2026): Bedroom Distribution
Distribution of Listings by Number of Bedrooms
Room Capacity Insights for Piedecuesta
- The dominant room capacity in Piedecuesta is 3 bedrooms listings, making up 37.8% of the market. This suggests a strong demand for properties suitable for families or small groups.
- Together, 3 bedrooms and 1 bedroom properties represent 58.2% of the active Airbnb listings in Piedecuesta, indicating a high concentration in these sizes.
- A significant 60.2% of listings offer 3+ bedrooms, catering to larger groups and families seeking more space in Piedecuesta.
Piedecuesta Vacation Rental Guest Capacity Trends (2026)
Distribution of Listings by Guest Capacity
Guest Capacity Insights for Piedecuesta
- The most common guest capacity trend in Piedecuesta vacation rentals is listings accommodating 8+ guests (41.8%). This suggests the primary traveler segment is likely larger groups.
- Properties designed for 8+ guests and 6 guests dominate the Piedecuesta STR market, accounting for 57.1% of listings.
- 61.2% of properties accommodate 6+ guests, serving the market segment for larger families or group travel in Piedecuesta.
- On average, properties in Piedecuesta are equipped to host 5.8 guests.
Piedecuesta Airbnb Booking Patterns (2026): Available vs. Booked Days
Available Days Distribution
Booked Days Distribution
Booking Pattern Insights for Piedecuesta
- The most common availability pattern in Piedecuesta falls within the 271-366 days range, representing 79.6% of listings. This suggests many properties have significant open periods on their calendars.
- Approximately 95.9% of listings show high availability (181+ days open annually), indicating potential for increased bookings or specific owner usage patterns.
- For booked days, the 1-30 days range is most frequent in Piedecuesta (40.8%), reflecting common guest stay durations or potential owner blocking patterns.
- A notable 4.1% of properties secure long booking periods (181+ days booked per year), highlighting successful long-term rental strategies or significant owner usage.
Piedecuesta Airbnb Minimum Stay Requirements Analysis
Distribution of Listings by Minimum Night Requirement
1 Night
61 listings
62.2% of total
2 Nights
12 listings
12.2% of total
3 Nights
2 listings
2% of total
4-6 Nights
1 listings
1% of total
7-29 Nights
3 listings
3.1% of total
30+ Nights
19 listings
19.4% of total
Key Insights
- The most prevalent minimum stay requirement in Piedecuesta is 1 Night, adopted by 62.2% of listings. This highlights the market's preference for shorter, flexible bookings.
- A strong majority (74.4%) of the Piedecuesta Airbnb data shows acceptance of very short stays (1-2 nights), indicating a dynamic, high-turnover market.
- A significant segment (19.4%) caters to monthly stays (30+ nights) in Piedecuesta, pointing to opportunities in the extended-stay market.
Recommendations
- Align with the market by considering a 1 Night minimum stay, as 62.2% of Piedecuesta hosts use this setting.
- Explore offering discounts for stays of 30+ nights to attract the 19.4% of the market seeking extended stays.
- Adjust minimum nights based on seasonality – potentially shorter during low season and longer during peak demand periods in Piedecuesta.
Piedecuesta Airbnb Cancellation Policy Trends Analysis (2026)
Limited
5 listings
5.1% of total
Flexible
41 listings
41.8% of total
Moderate
27 listings
27.6% of total
Firm
18 listings
18.4% of total
Strict
7 listings
7.1% of total
Cancellation Policy Insights for Piedecuesta
- The prevailing Airbnb cancellation policy trend in Piedecuesta is Flexible, used by 41.8% of listings.
- There's a relatively balanced mix between guest-friendly (69.4%) and stricter (25.5%) policies, offering choices for different guest needs.
- Strict cancellation policies are quite rare (7.1%), potentially making listings with this policy less competitive unless justified by high demand or property type.
Recommendations for Hosts
- Consider adopting a Flexible policy to align with the 41.8% market standard in Piedecuesta.
- Using a Strict policy might deter some guests, as only 7.1% of listings use it. Evaluate if potential revenue protection outweighs possible lower booking rates.
- Regularly review your cancellation policy against competitors and market demand shifts in Piedecuesta.
Piedecuesta STR Booking Lead Time Analysis (2026)
Average Booking Lead Time by Month
Booking Lead Time Insights for Piedecuesta
- The overall average booking lead time for vacation rentals in Piedecuesta is 23 days.
- Guests book furthest in advance for stays during December (average 44 days), likely coinciding with peak travel demand or local events.
- The shortest booking windows occur for stays in March (average 13 days), indicating more last-minute travel plans during this time.
- Seasonally, Winter (31 days avg.) sees the longest lead times, while Spring (17 days avg.) has the shortest, reflecting typical travel planning cycles.
Recommendations for Hosts
- Use the overall average lead time (23 days) as a baseline for your pricing and availability strategy in Piedecuesta.
- For December stays, consider implementing length-of-stay discounts or slightly higher rates for bookings made less than 44 days out to capitalize on advance planning.
- During March, focus on last-minute booking availability and promotions, as guests book with very short notice (13 days avg.).
- Target marketing efforts for the Winter season well in advance (at least 31 days) to capture early planners.
- Monitor your own booking lead times against these Piedecuesta averages to identify opportunities for dynamic pricing adjustments.
Popular & Essential Airbnb Amenities in Piedecuesta (2026)
Amenity Prevalence
Amenity Insights for Piedecuesta
- Popular amenities like Kitchen, Wifi, Free parking on premises are common but not universal. Offering these can provide a competitive edge.
- Warning: Wifi is not universally provided but is considered essential globally. Ensure reliable Wifi is offered.
Recommendations for Hosts
- Consider adding popular differentiators like Kitchen or Wifi to increase appeal.
- Highlight unique or less common amenities you offer (e.g., hot tub, dedicated workspace, EV charger) in your listing description and photos.
- Regularly check competitor amenities in Piedecuesta to stay competitive.
Piedecuesta Airbnb Guest Demographics & Profile Analysis (2026)
Guest Profile Summary for Piedecuesta
- The typical guest profile for Airbnb in Piedecuesta consists of a mix of domestic (64%) and international guests, often arriving from nearby Bucaramanga, typically belonging to the Post-2000s (Gen Z/Alpha) group (50%), primarily speaking Spanish or English.
- Domestic travelers account for 64.2% of guests.
- Key international markets include Colombia (64.2%) and United States (17%).
- Top languages spoken are Spanish (50.8%) followed by English (35%).
- A significant demographic segment is the Post-2000s (Gen Z/Alpha) group, representing 50% of guests.
Recommendations for Hosts
- Target domestic marketing efforts towards travelers from Bucaramanga and Bogotá.
- Tailor amenities and listing descriptions to appeal to the dominant Post-2000s (Gen Z/Alpha) demographic (e.g., highlight fast WiFi, smart home features, local guides).
- Highlight unique local experiences or amenities relevant to the primary guest profile.
- Consider seasonal promotions aligned with peak travel times for key origin markets.
Nearby Short-Term Rental Market Comparison
How does the Piedecuesta Airbnb market stack up against its neighbors? Compare key performance metrics like average monthly revenue, ADR, and occupancy rates in surrounding areas to understand the broader regional STR landscape.
| Market | Active Properties | Monthly Revenue | Daily Rate | Avg. Occupancy |
|---|---|---|---|---|
| Quebradanegra | 22 | $977 | $189.40 | 16% |
| Villeta | 325 | $860 | $181.51 | 20% |
| Nimaima | 34 | $843 | $195.06 | 19% |
| Vergara | 11 | $773 | $106.11 | 25% |
| Nocaima | 66 | $736 | $168.35 | 18% |
| Honda | 144 | $710 | $143.86 | 22% |
| Doradal | 38 | $656 | $155.33 | 23% |
| Chocontá | 57 | $610 | $164.52 | 15% |
| Vereda El Espinal | 19 | $571 | $91.60 | 26% |
| El Roble | 11 | $561 | $160.50 | 21% |