El Socorro Airbnb Market Analysis 2025: Short Term Rental Data & Vacation Rental Statistics in Santander, Colombia
Is Airbnb profitable in El Socorro in 2025? Explore comprehensive Airbnb analytics for El Socorro, Santander, Colombia to uncover income potential. This 2025 STR market report for El Socorro, based on AirROI data from December 2024 to November 2025, reveals key trends in the niche market of 20 active listings.
Whether you're considering an Airbnb investment in El Socorro, optimizing your existing vacation rental, or exploring rental arbitrage opportunities, understanding the El Socorro Airbnb data is crucial. Navigating the high regulation landscape is key to maximizing your short term rental income potential. Let's dive into the specifics.
Key El Socorro Airbnb Performance Metrics Overview
Monthly Airbnb Revenue Variations & Income Potential in El Socorro (2025)
Understanding the monthly revenue variations for Airbnb listings in El Socorro is key to maximizing your short term rental income potential. Seasonality significantly impacts earnings. Our analysis, based on data from the past 12 months, shows that the peak revenue month for STRs in El Socorro is typically January, while September often presents the lowest earnings, highlighting opportunities for strategic pricing adjustments during shoulder and low seasons. Explore the typical Airbnb income in El Socorro across different performance tiers:
- Best-in-class properties (Top 10%) achieve $807+ monthly, often utilizing dynamic pricing and superior guest experiences.
- Strong performing properties (Top 25%) earn $568 or more, indicating effective management and desirable locations/amenities.
- Typical properties (Median) generate around $185 per month, representing the average market performance.
- Entry-level properties (Bottom 25%) see earnings around $85, often with potential for optimization.
Average Monthly Airbnb Earnings Trend in El Socorro
El Socorro Airbnb Occupancy Rate Trends (2025)
Maximize your bookings by understanding the El Socorro STR occupancy trends. Seasonal demand shifts significantly influence how often properties are booked. Typically, Decembersees the highest demand (peak season occupancy), while September experiences the lowest (low season). Effective strategies, like adjusting minimum stays or offering promotions, can boost occupancy during slower periods. Here's how different property tiers perform in El Socorro:
- Best-in-class properties (Top 10%) achieve 39%+ occupancy, indicating high desirability and potentially optimized availability.
- Strong performing properties (Top 25%) maintain 24% or higher occupancy, suggesting good market fit and guest satisfaction.
- Typical properties (Median) have an occupancy rate around 11%.
- Entry-level properties (Bottom 25%) average 7% occupancy, potentially facing higher vacancy.
Average Monthly Occupancy Rate Trend in El Socorro
Average Daily Rate (ADR) Airbnb Trends in El Socorro (2025)
Effective short term rental pricing strategy in El Socorro involves understanding monthly ADR fluctuations. The Average Daily Rate (ADR) for Airbnb in El Socorro typically peaks in September and dips lowest during March. Leveraging Airbnb dynamic pricing tools or strategies based on this seasonality can significantly boost revenue. Here's a look at the typical nightly rates achieved:
- Best-in-class properties (Top 10%) command rates of $130+ per night, often due to premium features or locations.
- Strong performing properties (Top 25%) achieve nightly rates of $90 or more.
- Typical properties (Median) charge around $52 per night.
- Entry-level properties (Bottom 25%) earn around $26 per night.
Average Daily Rate (ADR) Trend by Month in El Socorro
Get Live El Socorro Market Intelligence 👇

Explore Real-time Analytics
Airbnb Seasonality Analysis & Trends in El Socorro (2025)
Peak Season (January, December, October)
- Revenue averages $574 per month
- Occupancy rates average 26.4%
- Daily rates average $77
Shoulder Season
- Revenue averages $310 per month
- Occupancy maintains around 16.8%
- Daily rates hold near $70
Low Season (May, September, November)
- Revenue drops to average $163 per month
- Occupancy decreases to average 9.6%
- Daily rates adjust to average $92
Seasonality Insights for El Socorro
- The Airbnb seasonality in El Socorro shows highly seasonal trends requiring careful strategy. While the sections above show seasonal averages, it's also insightful to look at the extremes:
- During the high season, the absolute peak month showcases El Socorro's highest earning potential, with monthly revenues capable of climbing to $629, occupancy reaching a high of 31.3%, and ADRs peaking at $106.
- Conversely, the slowest single month of the year, typically falling within the low season, marks the market's lowest point. In this month, revenue might dip to $90, occupancy could drop to 6.1%, and ADRs may adjust down to $61.
- Understanding both the seasonal averages and these monthly peaks and troughs in revenue, occupancy, and ADR is crucial for maximizing your Airbnb profit potential in El Socorro.
Seasonal Strategies for Maximizing Profit
- Peak Season: Maximize revenue through premium pricing and potentially longer minimum stays. Ensure high availability.
- Low Season: Offer competitive pricing, special promotions (e.g., extended stay discounts), and flexible cancellation policies. Target off-season travelers like remote workers or budget-conscious guests.
- Shoulder Seasons: Implement dynamic pricing that balances peak and low rates. Target weekend travelers or specific events. Offer slightly more flexible terms than peak season.
- Regularly analyze your own performance against these El Socorro seasonality benchmarks and adjust your pricing and availability strategy accordingly.
Best Areas for Airbnb Investment in El Socorro (2025)
Exploring the top neighborhoods for short-term rentals in El Socorro? This section highlights key areas, outlining why they are attractive for hosts and guests, along with notable local attractions. Consider these locations based on your target guest profile and investment strategy.
| Neighborhood / Area | Why Host Here? (Target Guests & Appeal) | Key Attractions & Landmarks |
|---|---|---|
| El Socorro Center | The central area of El Socorro, featuring local shops, restaurants, and easy access to public transport. Ideal for tourists looking to explore the town and its culture. | Plaza de El Socorro, Parroquia San Pedro Apóstol, Calle de los Siete Pueblos, local eateries, El Socorro Park |
| San Juan | A residential neighborhood with a mix of traditional architecture and modern amenities. Attracts families and travelers who prefer a quieter atmosphere while still being close to the heart of El Socorro. | Cerro del Cacique, local markets, nature trails, restaurants serving local cuisine, San Juan Church |
| El Salado | Known for its scenic views and natural beauty, this area is perfect for nature lovers and eco-tourists. Ideal for guests looking for outdoor activities and tranquility. | El Salado Waterfalls, hiking trails, camping sites, bird watching, stunning viewpoints |
| Pueblo Viejo | The historic neighborhood with preserved colonial architecture. Great for tourists interested in history and culture, providing a glimpse into the past of El Socorro. | Historical colonial buildings, Cultural festivals, Museo del Oro, local handicrafts, artisanal shops |
| Mirador | A viewpoint area popular for its panoramic views of the surrounding landscape. Attractive for visitors wanting to enjoy nature and photography opportunities. | Mirador de El Socorro, hiking paths, picnic spots, local flora, birdwatching |
| La Playa | This area is known for its recreational spaces and is popular among locals and visitors alike looking to relax and enjoy outdoor activities. | El Socorro Lake, walking trails, barbecue areas, playgrounds, sports facilities |
| El Tejar | A growing neighborhood with modern amenities, ideal for those looking for a blend of urban living and nature. Appeals to young professionals and families. | new shopping centers, local cafes, parks, community events, fitness facilities |
| Los Naranjos | A peaceful residential area featuring green spaces, making it suitable for families and tourists who seek a quieter stay while being close to urban amenities. | Los Naranjos Park, family-friendly activities, community markets, scenic walks, local restaurants |
Understanding Airbnb License Requirements & STR Laws in El Socorro (2025)
Yes, El Socorro, Santander, Colombia enforces high STR regulations. Obtaining a license and ensuring compliance is almost certainly required according to current 2025 STR laws. Always verify the latest short term rental regulations and Airbnb license requirements directly with local government authorities for El Socorro to ensure full compliance before hosting.
(Source: AirROI data, 2025, based on 85% licensed listings)
Top Performing Airbnb Properties in El Socorro (2025)
Benchmark your potential! Explore examples of top-performing Airbnb properties in El Socorrobased on Trailing Twelve Month (TTM) revenue. Analyze their characteristics, revenue, occupancy rate, and ADR to understand what drives success in this market.

El Carmen farmhouse
Entire Place • 5 bedrooms

La Cabana Socorro
Entire Place • 3 bedrooms
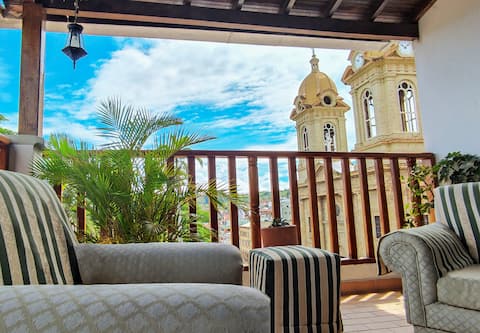
Spectacular views
Entire Place • 2 bedrooms

comfortable family apartment
Entire Place • 3 bedrooms
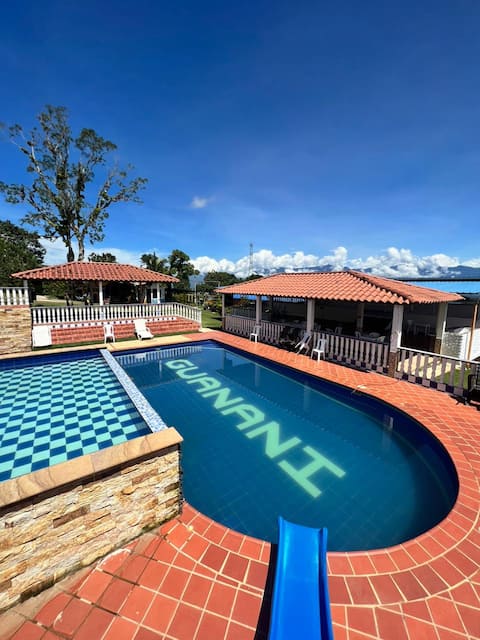
Cabin for up to 8 people in Guanani
Entire Place • 2 bedrooms
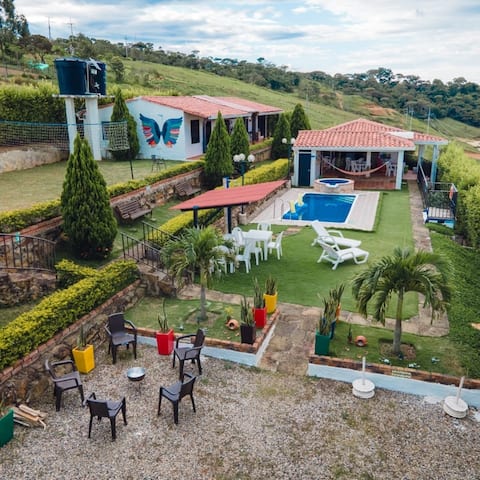
Villa San Gabriel Cabins RNT 85570
Entire Place • 4 bedrooms
Note: Performance varies based on location, size, amenities, seasonality, and management quality. Data reflects the past 12 months.
Top Performing Airbnb Hosts in El Socorro (2025)
Learn from the best! This table showcases top-performing Airbnb hosts in El Socorro based on the number of properties managed and estimated total revenue over the past year. Analyze their scale and performance metrics.
| Host Name | Properties | Grossing Revenue | Stay Reviews | Avg Rating |
|---|---|---|---|---|
| Claudia Juliana | 1 | $6,941 | 36 | 4.97/5.0 |
| Paula | 1 | $6,029 | 5 | 5.00/5.0 |
| Caro | 1 | $4,893 | 21 | 4.95/5.0 |
| Julio Desiderio | 1 | $4,831 | 21 | 5.00/5.0 |
| Sandra | 1 | $4,289 | 1 | Not Rated |
| Jenny Fabiana | 1 | $3,444 | 2 | Not Rated |
| Alejandro | 1 | $2,821 | 4 | 5.00/5.0 |
| Casa Blanca | 1 | $2,624 | 1 | Not Rated |
| Mateo | 1 | $2,558 | 10 | 4.90/5.0 |
| Diego Fernando | 1 | $1,853 | 1 | Not Rated |
Analyzing the strategies of top hosts, such as their property selection, pricing, and guest communication, can offer valuable lessons for optimizing your own Airbnb operations in El Socorro.
Dive Deeper: Advanced El Socorro STR Market Data (2025)
Ready to unlock more insights? AirROI provides access to advanced metrics and comprehensive Airbnb data for El Socorro. Explore detailed analytics beyond this report to refine your investment strategy, optimize pricing, and maximize your vacation rental profits.
Explore Advanced MetricsEl Socorro Short-Term Rental Market Composition (2025): Property & Room Types
Room Type Distribution
Property Type Distribution
Market Composition Insights for El Socorro
- The El Socorro Airbnb market composition is heavily skewed towards Entire Home/Apt listings, which make up 85% of the 20 active rentals. This indicates strong guest preference for privacy and space.
- Looking at the property type distribution in El Socorro, Outdoor/Unique properties are the most common (40%), reflecting the local real estate landscape.
- Houses represent a significant 35% portion, catering likely to families or larger groups.
- The presence of 10% Hotel/Boutique listings indicates integration with traditional hospitality.
El Socorro Airbnb Room Capacity Analysis (2025): Bedroom Distribution
Distribution of Listings by Number of Bedrooms
Room Capacity Insights for El Socorro
- The dominant room capacity in El Socorro is 2 bedrooms listings, making up 30% of the market. This suggests a strong demand for properties suitable for couples or solo travelers.
- Together, 2 bedrooms and 3 bedrooms properties represent 60.0% of the active Airbnb listings in El Socorro, indicating a high concentration in these sizes.
- A significant 60.0% of listings offer 3+ bedrooms, catering to larger groups and families seeking more space in El Socorro.
El Socorro Vacation Rental Guest Capacity Trends (2025)
Distribution of Listings by Guest Capacity
Guest Capacity Insights for El Socorro
- The most common guest capacity trend in El Socorro vacation rentals is listings accommodating 8+ guests (35%). This suggests the primary traveler segment is likely larger groups.
- Properties designed for 8+ guests and 5 guests dominate the El Socorro STR market, accounting for 55.0% of listings.
- 65.0% of properties accommodate 6+ guests, serving the market segment for larger families or group travel in El Socorro.
- On average, properties in El Socorro are equipped to host 6.0 guests.
El Socorro Airbnb Booking Patterns (2025): Available vs. Booked Days
Available Days Distribution
Booked Days Distribution
Booking Pattern Insights for El Socorro
- The most common availability pattern in El Socorro falls within the 271-366 days range, representing 90% of listings. This suggests many properties have significant open periods on their calendars.
- Approximately 100.0% of listings show high availability (181+ days open annually), indicating potential for increased bookings or specific owner usage patterns.
- For booked days, the 1-30 days range is most frequent in El Socorro (70%), reflecting common guest stay durations or potential owner blocking patterns.
El Socorro Airbnb Minimum Stay Requirements Analysis
Distribution of Listings by Minimum Night Requirement
1 Night
16 listings
80% of total
2 Nights
3 listings
15% of total
30+ Nights
1 listings
5% of total
Key Insights
- The most prevalent minimum stay requirement in El Socorro is 1 Night, adopted by 80% of listings. This highlights the market's preference for shorter, flexible bookings.
- A strong majority (95.0%) of the El Socorro Airbnb data shows acceptance of very short stays (1-2 nights), indicating a dynamic, high-turnover market.
Recommendations
- Align with the market by considering a 1 Night minimum stay, as 80% of El Socorro hosts use this setting.
- Adjust minimum nights based on seasonality – potentially shorter during low season and longer during peak demand periods in El Socorro.
El Socorro Airbnb Cancellation Policy Trends Analysis (2025)
Flexible
10 listings
52.6% of total
Moderate
5 listings
26.3% of total
Firm
4 listings
21.1% of total
Cancellation Policy Insights for El Socorro
- The prevailing Airbnb cancellation policy trend in El Socorro is Flexible, used by 52.6% of listings.
- The market strongly favors guest-friendly terms, with 78.9% of listings offering Flexible or Moderate policies. This suggests guests in El Socorro may expect booking flexibility.
Recommendations for Hosts
- Consider adopting a Flexible policy to align with the 52.6% market standard in El Socorro.
- Given the high prevalence of Flexible policies (52.6%), offering this can enhance booking appeal, especially during shoulder seasons.
- Regularly review your cancellation policy against competitors and market demand shifts in El Socorro.
El Socorro STR Booking Lead Time Analysis (2025)
Average Booking Lead Time by Month
Booking Lead Time Insights for El Socorro
- The overall average booking lead time for vacation rentals in El Socorro is 27 days.
- Guests book furthest in advance for stays during July (average 45 days), likely coinciding with peak travel demand or local events.
- The shortest booking windows occur for stays in November (average 4 days), indicating more last-minute travel plans during this time.
- Seasonally, Summer (34 days avg.) sees the longest lead times, while Fall (9 days avg.) has the shortest, reflecting typical travel planning cycles.
Recommendations for Hosts
- Use the overall average lead time (27 days) as a baseline for your pricing and availability strategy in El Socorro.
- For July stays, consider implementing length-of-stay discounts or slightly higher rates for bookings made less than 45 days out to capitalize on advance planning.
- During November, focus on last-minute booking availability and promotions, as guests book with very short notice (4 days avg.).
- Target marketing efforts for the Summer season well in advance (at least 34 days) to capture early planners.
- Monitor your own booking lead times against these El Socorro averages to identify opportunities for dynamic pricing adjustments.
Popular & Essential Airbnb Amenities in El Socorro (2025)
Amenity Prevalence
Amenity Insights for El Socorro
- Essential amenities in El Socorro that guests expect include: TV. Lacking these (this) could significantly impact bookings.
- Popular amenities like Wifi, Kitchen, Pets allowed are common but not universal. Offering these can provide a competitive edge.
- Warning: Wifi is not universally provided but is considered essential globally. Ensure reliable Wifi is offered.
Recommendations for Hosts
- Ensure your listing includes all essential amenities for El Socorro: TV.
- Consider adding popular differentiators like Wifi or Kitchen to increase appeal.
- Highlight unique or less common amenities you offer (e.g., hot tub, dedicated workspace, EV charger) in your listing description and photos.
- Regularly check competitor amenities in El Socorro to stay competitive.
El Socorro Airbnb Guest Demographics & Profile Analysis (2025)
Guest Profile Summary for El Socorro
- The typical guest profile for Airbnb in El Socorro consists of primarily domestic travelers (83%), often arriving from nearby Bogotá, typically belonging to the Post-2000s (Gen Z/Alpha) group (50%), primarily speaking Spanish or English.
- Domestic travelers account for 83.3% of guests.
- Key international markets include Colombia (83.3%) and United States (11.1%).
- Top languages spoken are Spanish (54.1%) followed by English (29.7%).
- A significant demographic segment is the Post-2000s (Gen Z/Alpha) group, representing 50% of guests.
Recommendations for Hosts
- Target domestic marketing efforts towards travelers from Bogotá and Bogota.
- Tailor amenities and listing descriptions to appeal to the dominant Post-2000s (Gen Z/Alpha) demographic (e.g., highlight fast WiFi, smart home features, local guides).
- Highlight unique local experiences or amenities relevant to the primary guest profile.
- Consider seasonal promotions aligned with peak travel times for key origin markets.
Nearby Short-Term Rental Market Comparison
How does the El Socorro Airbnb market stack up against its neighbors? Compare key performance metrics like average monthly revenue, ADR, and occupancy rates in surrounding areas to understand the broader regional STR landscape.
| Market | Active Properties | Monthly Revenue | Daily Rate | Avg. Occupancy |
|---|---|---|---|---|
| Nimaima | 30 | $1,046 | $202.08 | 21% |
| Villeta | 329 | $914 | $183.32 | 21% |
| Quebradanegra | 22 | $854 | $213.45 | 19% |
| Vergara | 12 | $754 | $98.60 | 24% |
| Nocaima | 73 | $733 | $164.94 | 18% |
| Honda | 145 | $725 | $146.22 | 22% |
| Chocontá | 60 | $666 | $165.28 | 16% |
| Vereda El Espinal | 21 | $617 | $83.62 | 26% |
| Pacho | 20 | $594 | $104.02 | 21% |
| Los Santos | 65 | $571 | $151.45 | 18% |