Bogota, Capital District Airbnb Market Analysis 2026: Short Term Rental Data & Vacation Rental Statistics in RAP (Especial) Central, Colombia
Is Airbnb profitable in Bogota, Capital District in 2026? Explore comprehensive Airbnb analytics for Bogota, Capital District, RAP (Especial) Central, Colombia to uncover income potential. This 2026 STR market report for Bogota, Capital District, based on AirROI data from February 2025 to January 2026, reveals key trends in the bustling market of 3,219 active listings.
Whether you're considering an Airbnb investment in Bogota, Capital District, optimizing your existing vacation rental, or exploring rental arbitrage opportunities, understanding the Bogota, Capital District Airbnb data is crucial. Navigating the high regulation landscape is key to maximizing your short term rental income potential. Let's dive into the specifics.
Key Bogota, Capital District Airbnb Performance Metrics Overview
Monthly Airbnb Revenue Variations & Income Potential in Bogota, Capital District (2026)
Understanding the monthly revenue variations for Airbnb listings in Bogota, Capital District is key to maximizing your short term rental income potential. Seasonality significantly impacts earnings. Our analysis, based on data from the past 12 months, shows that the peak revenue month for STRs in Bogota, Capital District is typically August, while January often presents the lowest earnings, highlighting opportunities for strategic pricing adjustments during shoulder and low seasons. Explore the typical Airbnb income in Bogota, Capital District across different performance tiers:
- Best-in-class properties (Top 10%) achieve $1,381+ monthly, often utilizing dynamic pricing and superior guest experiences.
- Strong performing properties (Top 25%) earn $814 or more, indicating effective management and desirable locations/amenities.
- Typical properties (Median) generate around $417 per month, representing the average market performance.
- Entry-level properties (Bottom 25%) see earnings around $181, often with potential for optimization.
Average Monthly Airbnb Earnings Trend in Bogota, Capital District
Bogota, Capital District Airbnb Occupancy Rate Trends (2026)
Maximize your bookings by understanding the Bogota, Capital District STR occupancy trends. Seasonal demand shifts significantly influence how often properties are booked. Typically, Februarysees the highest demand (peak season occupancy), while January experiences the lowest (low season). Effective strategies, like adjusting minimum stays or offering promotions, can boost occupancy during slower periods. Here's how different property tiers perform in Bogota, Capital District:
- Best-in-class properties (Top 10%) achieve 82%+ occupancy, indicating high desirability and potentially optimized availability.
- Strong performing properties (Top 25%) maintain 64% or higher occupancy, suggesting good market fit and guest satisfaction.
- Typical properties (Median) have an occupancy rate around 38%.
- Entry-level properties (Bottom 25%) average 17% occupancy, potentially facing higher vacancy.
Average Monthly Occupancy Rate Trend in Bogota, Capital District
Average Daily Rate (ADR) Airbnb Trends in Bogota, Capital District (2026)
Effective short term rental pricing strategy in Bogota, Capital District involves understanding monthly ADR fluctuations. The Average Daily Rate (ADR) for Airbnb in Bogota, Capital District typically peaks in September and dips lowest during February. Leveraging Airbnb dynamic pricing tools or strategies based on this seasonality can significantly boost revenue. Here's a look at the typical nightly rates achieved:
- Best-in-class properties (Top 10%) command rates of $80+ per night, often due to premium features or locations.
- Strong performing properties (Top 25%) achieve nightly rates of $54 or more.
- Typical properties (Median) charge around $36 per night.
- Entry-level properties (Bottom 25%) earn around $25 per night.
Average Daily Rate (ADR) Trend by Month in Bogota, Capital District
Get Live Bogota, Capital District Market Intelligence 👇
 Central/Bogota, Capital District.png)
Explore Real-time Analytics
Airbnb Seasonality Analysis & Trends in Bogota, Capital District (2026)
Peak Season (August, July, March)
- Revenue averages $682 per month
- Occupancy rates average 43.6%
- Daily rates average $48
Shoulder Season
- Revenue averages $631 per month
- Occupancy maintains around 41.9%
- Daily rates hold near $48
Low Season (January, April, June)
- Revenue drops to average $585 per month
- Occupancy decreases to average 38.8%
- Daily rates adjust to average $48
Seasonality Insights for Bogota, Capital District
- The Airbnb seasonality in Bogota, Capital District shows relatively stable year-round demand. While the sections above show seasonal averages, it's also insightful to look at the extremes:
- During the high season, the absolute peak month showcases Bogota, Capital District's highest earning potential, with monthly revenues capable of climbing to $689, occupancy reaching a high of 47.4%, and ADRs peaking at $49.
- Conversely, the slowest single month of the year, typically falling within the low season, marks the market's lowest point. In this month, revenue might dip to $571, occupancy could drop to 36.1%, and ADRs may adjust down to $46.
- Understanding both the seasonal averages and these monthly peaks and troughs in revenue, occupancy, and ADR is crucial for maximizing your Airbnb profit potential in Bogota, Capital District.
Seasonal Strategies for Maximizing Profit
- Peak Season: Maximize revenue through premium pricing and potentially longer minimum stays. Ensure high availability.
- Low Season: Offer competitive pricing, special promotions (e.g., extended stay discounts), and flexible cancellation policies. Target off-season travelers like remote workers or budget-conscious guests.
- Shoulder Seasons: Implement dynamic pricing that balances peak and low rates. Target weekend travelers or specific events. Offer slightly more flexible terms than peak season.
- Regularly analyze your own performance against these Bogota, Capital District seasonality benchmarks and adjust your pricing and availability strategy accordingly.
Best Areas for Airbnb Investment in Bogota, Capital District (2026)
Exploring the top neighborhoods for short-term rentals in Bogota, Capital District? This section highlights key areas, outlining why they are attractive for hosts and guests, along with notable local attractions. Consider these locations based on your target guest profile and investment strategy.
| Neighborhood / Area | Why Host Here? (Target Guests & Appeal) | Key Attractions & Landmarks |
|---|---|---|
| La Candelaria | Historical and cultural heart of Bogotá, featuring colonial architecture and numerous museums. It attracts tourists interested in history, art, and local culture. | Gold Museum, Botero Museum, Plaza de Bolívar, Casa de Nariño, Colombian National Capitol |
| Chapinero | A diverse and vibrant neighborhood known for its nightlife and culinary scene. It attracts a young crowd and is popular among expats and locals alike. | Parque de los Hippies, Andino Shopping Mall, Zona T, Calle 85 bars and restaurants, Los Andes University |
| Zona Rosa | A lively area known for its shopping and entertainment options, including bars and nightclubs. It's a favorite among both tourists and locals looking for nightlife. | Andino Shopping Mall, Retiro Shopping Center, Zona T nightlife, El Parque de la 93, National University of Colombia |
| Usaquén | Charming neighborhood with a mix of old and new, known for its artisan market and restaurants. It attracts visitors looking for a more relaxed atmosphere with local charm. | Usaquén Market, Los Años Locos restaurant, Hacienda Santa Barbara, Parque de Usaquén, Cultural events and fairs |
| Teusaquillo | Quiet, residential area with beautiful parks and streets, popular among families and professionals. It offers proximity to the city center and cultural sites. | Parque Simón Bolívar, Centro Internacional, Museo Nacional, El Campín Stadium, Cafes and eateries |
| Suba | A suburban area with a unique feel, offering a blend of natural and urban settings. It's popular among families and those looking for peaceful surroundings. | Parque La Roca, Centro Comercial Plaza Imperial, Dorado Plaza Mall, Parque de los Novios, El Parque de Suba |
| Engativá | A well-connected neighborhood known for its residential developments and access to transportation. It's increasingly attractive to visitors seeking affordability and convenience. | Malibú Shopping Center, Parque Engativá, Plaza de las Américas, Centro Comercial Gran Estación, Local restaurants |
| Barrios Unidos | Known for its vibrant community and culture, this neighborhood is gaining popularity as an affordable option for visitors seeking a local experience. | Parque de los Niños, Centro Comercial Plaza de las Américas, Calixto Pérez Park, Cultural events, Local dining options |
Understanding Airbnb License Requirements & STR Laws in Bogota, Capital District (2026)
Yes, Bogota, Capital District, RAP (Especial) Central, Colombia enforces high STR regulations. Obtaining a license and ensuring compliance is almost certainly required according to current 2026 STR laws. Always verify the latest short term rental regulations and Airbnb license requirements directly with local government authorities for Bogota, Capital District to ensure full compliance before hosting.
(Source: AirROI data, 2026, based on 87% licensed listings)
Top Performing Airbnb Properties in Bogota, Capital District (2026)
Benchmark your potential! Explore examples of top-performing Airbnb properties in Bogota, Capital Districtbased on Trailing Twelve Month (TTM) revenue. Analyze their characteristics, revenue, occupancy rate, and ADR to understand what drives success in this market.
Amazing apartment zona T
Entire Place • 3 bedrooms
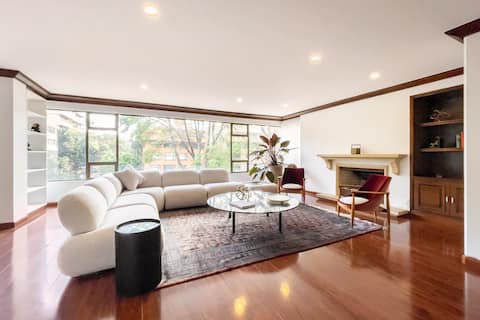
Exclusive apartment in the best area of Bogotá
Entire Place • 4 bedrooms

Exclusive Pent House in the best area of Bogotá
Entire Place • 4 bedrooms

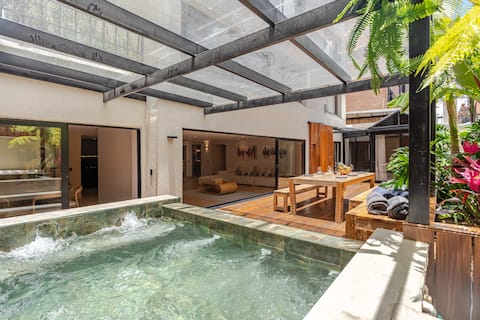
4 Bedroom Penthouse with Jacuzzi/Sauna/Terrace
Entire Place • 4 bedrooms

NOK Modern Apartment 4BR in Usaquien
Entire Place • 3 bedrooms

Amazing apartment+jacuzzi+Cinema+ Private Terrace
Entire Place • 2 bedrooms
Note: Performance varies based on location, size, amenities, seasonality, and management quality. Data reflects the past 12 months.
Top Performing Airbnb Hosts in Bogota, Capital District (2026)
Learn from the best! This table showcases top-performing Airbnb hosts in Bogota, Capital District based on the number of properties managed and estimated total revenue over the past year. Analyze their scale and performance metrics.
| Host Name | Properties | Grossing Revenue | Stay Reviews | Avg Rating |
|---|---|---|---|---|
| Fernando | 9 | $320,139 | 280 | 4.63/5.0 |
| Sebastian | 13 | $226,817 | 1197 | 4.81/5.0 |
| Juan | 32 | $220,340 | 2602 | 4.74/5.0 |
| Espacioya | 67 | $213,266 | 2212 | 4.40/5.0 |
| Andres | 2 | $176,266 | 143 | 4.97/5.0 |
| Holtz | 18 | $160,080 | 838 | 4.71/5.0 |
| David | 6 | $155,678 | 513 | 4.93/5.0 |
| Brandon | 7 | $142,631 | 398 | 4.95/5.0 |
| Camila | 5 | $135,626 | 361 | 4.91/5.0 |
| Juan Sebastián | 9 | $133,724 | 285 | 4.84/5.0 |
Analyzing the strategies of top hosts, such as their property selection, pricing, and guest communication, can offer valuable lessons for optimizing your own Airbnb operations in Bogota, Capital District.
Dive Deeper: Advanced Bogota, Capital District STR Market Data (2026)
Ready to unlock more insights? AirROI provides access to advanced metrics and comprehensive Airbnb data for Bogota, Capital District. Explore detailed analytics beyond this report to refine your investment strategy, optimize pricing, and maximize your vacation rental profits.
Explore Advanced MetricsBogota, Capital District Short-Term Rental Market Composition (2026): Property & Room Types
Room Type Distribution
Property Type Distribution
Market Composition Insights for Bogota, Capital District
- The Bogota, Capital District Airbnb market composition is heavily skewed towards Entire Home/Apt listings, which make up 83.5% of the 3,219 active rentals. This indicates strong guest preference for privacy and space.
- Looking at the property type distribution in Bogota, Capital District, Apartment/Condo properties are the most common (86.8%), reflecting the local real estate landscape.
- Smaller segments like hotel/boutique, others, outdoor/unique (combined 4.7%) offer potential for unique stay experiences.
Bogota, Capital District Airbnb Room Capacity Analysis (2026): Bedroom Distribution
Distribution of Listings by Number of Bedrooms
Room Capacity Insights for Bogota, Capital District
- The dominant room capacity in Bogota, Capital District is 1 bedroom listings, making up 58.6% of the market. This suggests a strong demand for properties suitable for couples or solo travelers.
- Together, 1 bedroom and 2 bedrooms properties represent 79.5% of the active Airbnb listings in Bogota, Capital District, indicating a high concentration in these sizes.
- With over half the market (58.6%) consisting of studios or 1-bedroom units, Bogota, Capital District is particularly well-suited for individuals or couples.
- Listings with 3+ bedrooms (8.8%) represent a smaller niche, potentially indicating an underserved market for larger group accommodations in Bogota, Capital District.
Bogota, Capital District Vacation Rental Guest Capacity Trends (2026)
Distribution of Listings by Guest Capacity
Guest Capacity Insights for Bogota, Capital District
- The most common guest capacity trend in Bogota, Capital District vacation rentals is listings accommodating 2 guests (36.7%). This suggests the primary traveler segment is likely couples or solo travelers.
- Properties designed for 2 guests and 4 guests dominate the Bogota, Capital District STR market, accounting for 55.1% of listings.
- On average, properties in Bogota, Capital District are equipped to host 2.9 guests.
Bogota, Capital District Airbnb Booking Patterns (2026): Available vs. Booked Days
Available Days Distribution
Booked Days Distribution
Booking Pattern Insights for Bogota, Capital District
- The most common availability pattern in Bogota, Capital District falls within the 271-366 days range, representing 55.3% of listings. This suggests many properties have significant open periods on their calendars.
- Approximately 80.5% of listings show high availability (181+ days open annually), indicating potential for increased bookings or specific owner usage patterns.
- For booked days, the 31-90 days range is most frequent in Bogota, Capital District (27.2%), reflecting common guest stay durations or potential owner blocking patterns.
- A notable 20.3% of properties secure long booking periods (181+ days booked per year), highlighting successful long-term rental strategies or significant owner usage.
Bogota, Capital District Airbnb Minimum Stay Requirements Analysis
Distribution of Listings by Minimum Night Requirement
1 Night
1366 listings
42.4% of total
2 Nights
565 listings
17.6% of total
3 Nights
178 listings
5.5% of total
4-6 Nights
160 listings
5% of total
7-29 Nights
234 listings
7.3% of total
30+ Nights
715 listings
22.2% of total
Key Insights
- The most prevalent minimum stay requirement in Bogota, Capital District is 1 Night, adopted by 42.4% of listings. This highlights the market's preference for shorter, flexible bookings.
- A significant segment (22.2%) caters to monthly stays (30+ nights) in Bogota, Capital District, pointing to opportunities in the extended-stay market.
Recommendations
- Align with the market by considering a 1 Night minimum stay, as 42.4% of Bogota, Capital District hosts use this setting.
- Explore offering discounts for stays of 30+ nights to attract the 22.2% of the market seeking extended stays.
- Adjust minimum nights based on seasonality – potentially shorter during low season and longer during peak demand periods in Bogota, Capital District.
Bogota, Capital District Airbnb Cancellation Policy Trends Analysis (2026)
Limited
52 listings
1.6% of total
Super Strict 60 Days
20 listings
0.6% of total
Super Strict 30 Days
1 listings
0% of total
Flexible
1198 listings
37.5% of total
Moderate
932 listings
29.2% of total
Firm
698 listings
21.8% of total
Strict
296 listings
9.3% of total
Cancellation Policy Insights for Bogota, Capital District
- The prevailing Airbnb cancellation policy trend in Bogota, Capital District is Flexible, used by 37.5% of listings.
- There's a relatively balanced mix between guest-friendly (66.7%) and stricter (31.1%) policies, offering choices for different guest needs.
- Strict cancellation policies are quite rare (9.3%), potentially making listings with this policy less competitive unless justified by high demand or property type.
Recommendations for Hosts
- Consider adopting a Flexible policy to align with the 37.5% market standard in Bogota, Capital District.
- Using a Strict policy might deter some guests, as only 9.3% of listings use it. Evaluate if potential revenue protection outweighs possible lower booking rates.
- Regularly review your cancellation policy against competitors and market demand shifts in Bogota, Capital District.
Bogota, Capital District STR Booking Lead Time Analysis (2026)
Average Booking Lead Time by Month
Booking Lead Time Insights for Bogota, Capital District
- The overall average booking lead time for vacation rentals in Bogota, Capital District is 20 days.
- Guests book furthest in advance for stays during December (average 27 days), likely coinciding with peak travel demand or local events.
- The shortest booking windows occur for stays in June (average 18 days), indicating more last-minute travel plans during this time.
- Seasonally, Winter (24 days avg.) sees the longest lead times, while Spring (18 days avg.) has the shortest, reflecting typical travel planning cycles.
Recommendations for Hosts
- Use the overall average lead time (20 days) as a baseline for your pricing and availability strategy in Bogota, Capital District.
- Target marketing efforts for the Winter season well in advance (at least 24 days) to capture early planners.
- Monitor your own booking lead times against these Bogota, Capital District averages to identify opportunities for dynamic pricing adjustments.
Popular & Essential Airbnb Amenities in Bogota, Capital District (2026)
Amenity Prevalence
Amenity Insights for Bogota, Capital District
- Essential amenities in Bogota, Capital District that guests expect include: Wifi. Lacking these (this) could significantly impact bookings.
- Popular amenities like TV, Kitchen, Hot water are common but not universal. Offering these can provide a competitive edge.
Recommendations for Hosts
- Ensure your listing includes all essential amenities for Bogota, Capital District: Wifi.
- Prioritize adding missing essentials: Wifi.
- Consider adding popular differentiators like TV or Kitchen to increase appeal.
- Highlight unique or less common amenities you offer (e.g., hot tub, dedicated workspace, EV charger) in your listing description and photos.
- Regularly check competitor amenities in Bogota, Capital District to stay competitive.
Bogota, Capital District Airbnb Guest Demographics & Profile Analysis (2026)
Guest Profile Summary for Bogota, Capital District
- The typical guest profile for Airbnb in Bogota, Capital District consists of predominantly international visitors (68%), with top international origins including United States, typically belonging to the Post-2000s (Gen Z/Alpha) group (50%), primarily speaking Spanish or English.
- Domestic travelers account for 32.3% of guests.
- Key international markets include Colombia (32.3%) and United States (25.4%).
- Top languages spoken are Spanish (41.9%) followed by English (38.8%).
- A significant demographic segment is the Post-2000s (Gen Z/Alpha) group, representing 50% of guests.
Recommendations for Hosts
- Focus marketing internationally, particularly towards travelers from United States.
- Offer listing details and communication support in Spanish.
- Tailor amenities and listing descriptions to appeal to the dominant Post-2000s (Gen Z/Alpha) demographic (e.g., highlight fast WiFi, smart home features, local guides).
- Highlight unique local experiences or amenities relevant to the primary guest profile.
- Consider seasonal promotions aligned with peak travel times for key origin markets.
Nearby Short-Term Rental Market Comparison
How does the Bogota, Capital District Airbnb market stack up against its neighbors? Compare key performance metrics like average monthly revenue, ADR, and occupancy rates in surrounding areas to understand the broader regional STR landscape.
| Market | Active Properties | Monthly Revenue | Daily Rate | Avg. Occupancy |
|---|---|---|---|---|
| Cauca Viejo | 26 | $2,181 | $298.12 | 27% |
| Anapoima | 286 | $1,775 | $279.24 | 26% |
| Apulo | 105 | $1,505 | $270.37 | 22% |
| Cundinamarca | 11 | $1,424 | $201.05 | 23% |
| La Pintada | 20 | $1,381 | $258.80 | 24% |
| Fredonia | 14 | $1,284 | $201.88 | 23% |
| Nilo | 73 | $1,138 | $246.56 | 21% |
| Quebradanegra | 22 | $977 | $189.40 | 16% |
| El Imperio | 14 | $900 | $193.43 | 19% |
| Villeta | 325 | $860 | $181.51 | 20% |