Salento Airbnb Market Analysis 2026: Short Term Rental Data & Vacation Rental Statistics in Quindío, Colombia
Is Airbnb profitable in Salento in 2026? Explore comprehensive Airbnb analytics for Salento, Quindío, Colombia to uncover income potential. This 2026 STR market report for Salento, based on AirROI data from February 2025 to January 2026, reveals key trends in the market of 508 active listings.
Whether you're considering an Airbnb investment in Salento, optimizing your existing vacation rental, or exploring rental arbitrage opportunities, understanding the Salento Airbnb data is crucial. Navigating the high regulation landscape is key to maximizing your short term rental income potential. Let's dive into the specifics.
Key Salento Airbnb Performance Metrics Overview
Monthly Airbnb Revenue Variations & Income Potential in Salento (2026)
Understanding the monthly revenue variations for Airbnb listings in Salento is key to maximizing your short term rental income potential. Seasonality significantly impacts earnings. Our analysis, based on data from the past 12 months, shows that the peak revenue month for STRs in Salento is typically August, while May often presents the lowest earnings, highlighting opportunities for strategic pricing adjustments during shoulder and low seasons. Explore the typical Airbnb income in Salento across different performance tiers:
- Best-in-class properties (Top 10%) achieve $1,772+ monthly, often utilizing dynamic pricing and superior guest experiences.
- Strong performing properties (Top 25%) earn $977 or more, indicating effective management and desirable locations/amenities.
- Typical properties (Median) generate around $512 per month, representing the average market performance.
- Entry-level properties (Bottom 25%) see earnings around $223, often with potential for optimization.
Average Monthly Airbnb Earnings Trend in Salento
Salento Airbnb Occupancy Rate Trends (2026)
Maximize your bookings by understanding the Salento STR occupancy trends. Seasonal demand shifts significantly influence how often properties are booked. Typically, Februarysees the highest demand (peak season occupancy), while May experiences the lowest (low season). Effective strategies, like adjusting minimum stays or offering promotions, can boost occupancy during slower periods. Here's how different property tiers perform in Salento:
- Best-in-class properties (Top 10%) achieve 73%+ occupancy, indicating high desirability and potentially optimized availability.
- Strong performing properties (Top 25%) maintain 54% or higher occupancy, suggesting good market fit and guest satisfaction.
- Typical properties (Median) have an occupancy rate around 29%.
- Entry-level properties (Bottom 25%) average 13% occupancy, potentially facing higher vacancy.
Average Monthly Occupancy Rate Trend in Salento
Average Daily Rate (ADR) Airbnb Trends in Salento (2026)
Effective short term rental pricing strategy in Salento involves understanding monthly ADR fluctuations. The Average Daily Rate (ADR) for Airbnb in Salento typically peaks in January and dips lowest during February. Leveraging Airbnb dynamic pricing tools or strategies based on this seasonality can significantly boost revenue. Here's a look at the typical nightly rates achieved:
- Best-in-class properties (Top 10%) command rates of $151+ per night, often due to premium features or locations.
- Strong performing properties (Top 25%) achieve nightly rates of $93 or more.
- Typical properties (Median) charge around $54 per night.
- Entry-level properties (Bottom 25%) earn around $35 per night.
Average Daily Rate (ADR) Trend by Month in Salento
Get Live Salento Market Intelligence 👇

Explore Real-time Analytics
Airbnb Seasonality Analysis & Trends in Salento (2026)
Peak Season (August, July, December)
- Revenue averages $951 per month
- Occupancy rates average 39.2%
- Daily rates average $78
Shoulder Season
- Revenue averages $774 per month
- Occupancy maintains around 35.7%
- Daily rates hold near $76
Low Season (May, September, October)
- Revenue drops to average $655 per month
- Occupancy decreases to average 29.5%
- Daily rates adjust to average $74
Seasonality Insights for Salento
- The Airbnb seasonality in Salento shows moderate seasonality with distinct peak and low periods. While the sections above show seasonal averages, it's also insightful to look at the extremes:
- During the high season, the absolute peak month showcases Salento's highest earning potential, with monthly revenues capable of climbing to $978, occupancy reaching a high of 43.5%, and ADRs peaking at $86.
- Conversely, the slowest single month of the year, typically falling within the low season, marks the market's lowest point. In this month, revenue might dip to $619, occupancy could drop to 28.4%, and ADRs may adjust down to $72.
- Understanding both the seasonal averages and these monthly peaks and troughs in revenue, occupancy, and ADR is crucial for maximizing your Airbnb profit potential in Salento.
Seasonal Strategies for Maximizing Profit
- Peak Season: Maximize revenue through premium pricing and potentially longer minimum stays. Ensure high availability.
- Low Season: Offer competitive pricing, special promotions (e.g., extended stay discounts), and flexible cancellation policies. Target off-season travelers like remote workers or budget-conscious guests.
- Shoulder Seasons: Implement dynamic pricing that balances peak and low rates. Target weekend travelers or specific events. Offer slightly more flexible terms than peak season.
- Regularly analyze your own performance against these Salento seasonality benchmarks and adjust your pricing and availability strategy accordingly.
Best Areas for Airbnb Investment in Salento (2026)
Exploring the top neighborhoods for short-term rentals in Salento? This section highlights key areas, outlining why they are attractive for hosts and guests, along with notable local attractions. Consider these locations based on your target guest profile and investment strategy.
| Neighborhood / Area | Why Host Here? (Target Guests & Appeal) | Key Attractions & Landmarks |
|---|---|---|
| Salento Town | Charming colonial town famous for its vibrant buildings, coffee culture, and tourism. It serves as the gateway to the Cocora Valley and attracts visitors looking for a picturesque experience. | Cocora Valley, Bocafé Coffee Farm, Los Nevados National Natural Park, Salento's Main Square, Mirador de Salento |
| Cocora Valley | Renowned for its stunning landscapes and tall wax palm trees, Cocora Valley is a must-visit for nature lovers and hikers, offering unique photo opportunities and adventure activities. | Wax Palm Trees, Hiking Trails, Birdwatching, Horseback Riding, Scenic Views |
| Finca de Café | Coffee farms around Salento provide immersive experiences into the coffee-making process. These farms are popular among tourists seeking authentic Colombian coffee culture. | Coffee Tours, Coffee Tasting, Traditional Coffee Production, Countryside Views, Cultural Workshops |
| Los Nevados National Park | A vast national park ideal for adventure and ecotourism, catering to those looking for mountain expeditions and natural beauty. It attracts outdoor enthusiasts from various locations. | Snow-capped Peaks, Trekking Trails, Hot Springs, Diverse Flora and Fauna, Lakes and Lagunas |
| Filandia | A nearby traditional town with a less commercial vibe than Salento, Filandia offers beautiful landscapes and colorful architecture, ideal for travelers seeking a more tranquil escape. | Mirador Torre 360, Filandia's Main Square, Traditional Handicrafts, Coffee Plantations, Coffee Cultural Landscape |
| Manizales | A major city in the coffee region, offering urban amenities and close proximity to nature. Manizales appeals to travelers interested in both city life and outdoor activities. | Manizales Cathedral, Recinto del Pensamiento, Cable Car, Torre Panoramica, Tatama National Park |
| Quindío Botanical Garden | This expansive garden near Salento features diverse plant species native to the region and is perfect for nature enthusiasts and families looking for educational experiences. | Native Flora, Birdwatching, Nature Walks, Family-friendly Activities, Educational Tours |
| Pereira | The capital of Risaralda, close to Quindío, offers shopping, nightlife, and attractions that appeal to urban tourists. It serves as a practical base for exploring the coffee region. | Pereira's Main Plaza, Bolivar Square, Botero Plaza, Viaduct over Otún River, Shopping Centers |
Understanding Airbnb License Requirements & STR Laws in Salento (2026)
Yes, Salento, Quindío, Colombia enforces high STR regulations. Obtaining a license and ensuring compliance is almost certainly required according to current 2026 STR laws. Always verify the latest short term rental regulations and Airbnb license requirements directly with local government authorities for Salento to ensure full compliance before hosting.
(Source: AirROI data, 2026, based on 95% licensed listings)
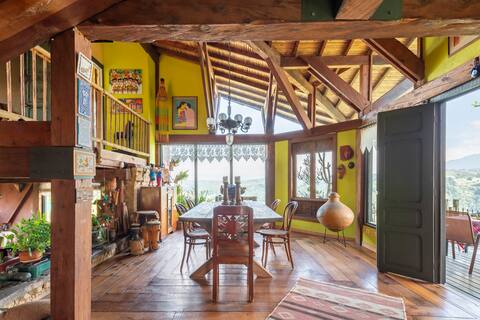
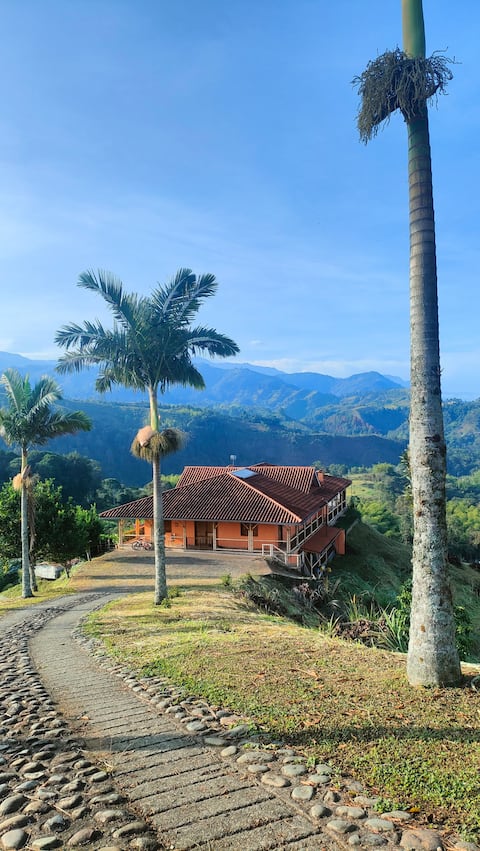
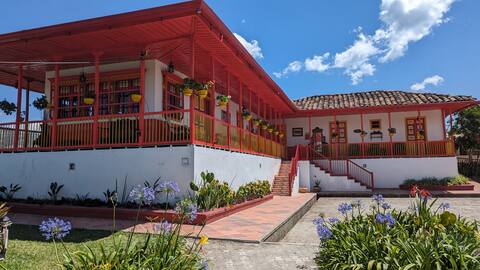
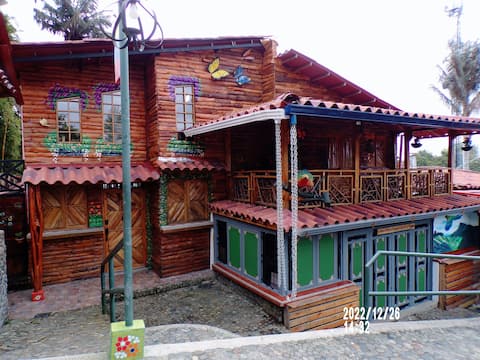
Top Performing Airbnb Properties in Salento (2026)
Benchmark your potential! Explore examples of top-performing Airbnb properties in Salentobased on Trailing Twelve Month (TTM) revenue. Analyze their characteristics, revenue, occupancy rate, and ADR to understand what drives success in this market.

A hidden gem in Salento
Entire Place • 3 bedrooms

The Coffee Triangle: Salento, Cocora and Finlandia
Entire Place • 5 bedrooms
La Bohemia, floating over Cocora Valley.
Entire Place • 5 bedrooms
Buenavista Estate + Mountains + Views + Breakfast
Private Room • 5 bedrooms
Coronel's Peak Coffee Townhouse
Entire Place • 4 bedrooms
The Charming Mountain Cabin
Entire Place • 4 bedrooms
Note: Performance varies based on location, size, amenities, seasonality, and management quality. Data reflects the past 12 months.
Top Performing Airbnb Hosts in Salento (2026)
Learn from the best! This table showcases top-performing Airbnb hosts in Salento based on the number of properties managed and estimated total revenue over the past year. Analyze their scale and performance metrics.
| Host Name | Properties | Grossing Revenue | Stay Reviews | Avg Rating |
|---|---|---|---|---|
| Laura Alejandra | 8 | $155,213 | 1582 | 4.89/5.0 |
| Braulio | 4 | $133,188 | 1517 | 4.80/5.0 |
| Angela | 10 | $108,714 | 985 | 4.84/5.0 |
| Parallelo | 5 | $94,463 | 627 | 4.89/5.0 |
| Carmen | 6 | $86,244 | 467 | 4.92/5.0 |
| Glamping Salento | 4 | $69,992 | 25 | 4.72/5.0 |
| Andres Fernando | 6 | $69,448 | 174 | 4.96/5.0 |
| Juan Sebastian | 4 | $68,872 | 282 | 4.97/5.0 |
| Margarita Y Julian De ALOJADOS | 1 | $67,930 | 30 | 4.93/5.0 |
| Jhenny Alejandra | 6 | $65,892 | 389 | 4.81/5.0 |
Analyzing the strategies of top hosts, such as their property selection, pricing, and guest communication, can offer valuable lessons for optimizing your own Airbnb operations in Salento.
Dive Deeper: Advanced Salento STR Market Data (2026)
Ready to unlock more insights? AirROI provides access to advanced metrics and comprehensive Airbnb data for Salento. Explore detailed analytics beyond this report to refine your investment strategy, optimize pricing, and maximize your vacation rental profits.
Explore Advanced MetricsSalento Short-Term Rental Market Composition (2026): Property & Room Types
Room Type Distribution
Property Type Distribution
Market Composition Insights for Salento
- The Salento Airbnb market composition is heavily skewed towards Entire Home/Apt listings, which make up 50.8% of the 508 active rentals. This indicates strong guest preference for privacy and space.
- However, a notable 47.4% share for Private Rooms suggests opportunities for budget-conscious travelers or hosts renting out spare rooms.
- Looking at the property type distribution in Salento, Hotel/Boutique properties are the most common (31.1%), reflecting the local real estate landscape.
- Houses represent a significant 29.5% portion, catering likely to families or larger groups.
- The presence of 31.1% Hotel/Boutique listings indicates integration with traditional hospitality.
- Smaller segments like others, unique stays (combined 2.2%) offer potential for unique stay experiences.
Salento Airbnb Room Capacity Analysis (2026): Bedroom Distribution
Distribution of Listings by Number of Bedrooms
Room Capacity Insights for Salento
- The dominant room capacity in Salento is 1 bedroom listings, making up 42.7% of the market. This suggests a strong demand for properties suitable for couples or solo travelers.
- Together, 1 bedroom and 3 bedrooms properties represent 60.0% of the active Airbnb listings in Salento, indicating a high concentration in these sizes.
- A significant 23.9% of listings offer 3+ bedrooms, catering to larger groups and families seeking more space in Salento.
Salento Vacation Rental Guest Capacity Trends (2026)
Distribution of Listings by Guest Capacity
Guest Capacity Insights for Salento
- The most common guest capacity trend in Salento vacation rentals is listings accommodating 2 guests (26%). This suggests the primary traveler segment is likely couples or solo travelers.
- Properties designed for 2 guests and 8+ guests dominate the Salento STR market, accounting for 41.9% of listings.
- 29.5% of properties accommodate 6+ guests, serving the market segment for larger families or group travel in Salento.
- On average, properties in Salento are equipped to host 3.6 guests.
Salento Airbnb Booking Patterns (2026): Available vs. Booked Days
Available Days Distribution
Booked Days Distribution
Booking Pattern Insights for Salento
- The most common availability pattern in Salento falls within the 271-366 days range, representing 63.2% of listings. This suggests many properties have significant open periods on their calendars.
- Approximately 84.5% of listings show high availability (181+ days open annually), indicating potential for increased bookings or specific owner usage patterns.
- For booked days, the 31-90 days range is most frequent in Salento (33.5%), reflecting common guest stay durations or potential owner blocking patterns.
- A notable 17.1% of properties secure long booking periods (181+ days booked per year), highlighting successful long-term rental strategies or significant owner usage.
Salento Airbnb Minimum Stay Requirements Analysis
Distribution of Listings by Minimum Night Requirement
1 Night
417 listings
82.1% of total
2 Nights
31 listings
6.1% of total
3 Nights
2 listings
0.4% of total
4-6 Nights
1 listings
0.2% of total
7-29 Nights
1 listings
0.2% of total
30+ Nights
56 listings
11% of total
Key Insights
- The most prevalent minimum stay requirement in Salento is 1 Night, adopted by 82.1% of listings. This highlights the market's preference for shorter, flexible bookings.
- A strong majority (88.2%) of the Salento Airbnb data shows acceptance of very short stays (1-2 nights), indicating a dynamic, high-turnover market.
- A significant segment (11%) caters to monthly stays (30+ nights) in Salento, pointing to opportunities in the extended-stay market.
Recommendations
- Align with the market by considering a 1 Night minimum stay, as 82.1% of Salento hosts use this setting.
- Explore offering discounts for stays of 30+ nights to attract the 11% of the market seeking extended stays.
- Adjust minimum nights based on seasonality – potentially shorter during low season and longer during peak demand periods in Salento.
Salento Airbnb Cancellation Policy Trends Analysis (2026)
Limited
21 listings
4.1% of total
Super Strict 30 Days
1 listings
0.2% of total
Flexible
284 listings
55.9% of total
Moderate
117 listings
23% of total
Firm
76 listings
15% of total
Strict
9 listings
1.8% of total
Cancellation Policy Insights for Salento
- The prevailing Airbnb cancellation policy trend in Salento is Flexible, used by 55.9% of listings.
- The market strongly favors guest-friendly terms, with 78.9% of listings offering Flexible or Moderate policies. This suggests guests in Salento may expect booking flexibility.
- Strict cancellation policies are quite rare (1.8%), potentially making listings with this policy less competitive unless justified by high demand or property type.
Recommendations for Hosts
- Consider adopting a Flexible policy to align with the 55.9% market standard in Salento.
- Given the high prevalence of Flexible policies (55.9%), offering this can enhance booking appeal, especially during shoulder seasons.
- Using a Strict policy might deter some guests, as only 1.8% of listings use it. Evaluate if potential revenue protection outweighs possible lower booking rates.
- Regularly review your cancellation policy against competitors and market demand shifts in Salento.
Salento STR Booking Lead Time Analysis (2026)
Average Booking Lead Time by Month
Booking Lead Time Insights for Salento
- The overall average booking lead time for vacation rentals in Salento is 35 days.
- Guests book furthest in advance for stays during November (average 48 days), likely coinciding with peak travel demand or local events.
- The shortest booking windows occur for stays in June (average 24 days), indicating more last-minute travel plans during this time.
- Seasonally, Fall (42 days avg.) sees the longest lead times, while Spring (27 days avg.) has the shortest, reflecting typical travel planning cycles.
Recommendations for Hosts
- Use the overall average lead time (35 days) as a baseline for your pricing and availability strategy in Salento.
- For November stays, consider implementing length-of-stay discounts or slightly higher rates for bookings made less than 48 days out to capitalize on advance planning.
- Target marketing efforts for the Fall season well in advance (at least 42 days) to capture early planners.
- Monitor your own booking lead times against these Salento averages to identify opportunities for dynamic pricing adjustments.
Popular & Essential Airbnb Amenities in Salento (2026)
Amenity Prevalence
Amenity Insights for Salento
- Essential amenities in Salento that guests expect include: Wifi. Lacking these (this) could significantly impact bookings.
- Popular amenities like Hot water, TV, First aid kit are common but not universal. Offering these can provide a competitive edge.
Recommendations for Hosts
- Ensure your listing includes all essential amenities for Salento: Wifi.
- Prioritize adding missing essentials: Wifi.
- Consider adding popular differentiators like Hot water or TV to increase appeal.
- Highlight unique or less common amenities you offer (e.g., hot tub, dedicated workspace, EV charger) in your listing description and photos.
- Regularly check competitor amenities in Salento to stay competitive.
Salento Airbnb Guest Demographics & Profile Analysis (2026)
Guest Profile Summary for Salento
- The typical guest profile for Airbnb in Salento consists of predominantly international visitors (74%), with top international origins including United States, typically belonging to the Post-2000s (Gen Z/Alpha) group (50%), primarily speaking English or Spanish.
- Domestic travelers account for 25.6% of guests.
- Key international markets include Colombia (25.6%) and United States (18.7%).
- Top languages spoken are English (37.8%) followed by Spanish (36.7%).
- A significant demographic segment is the Post-2000s (Gen Z/Alpha) group, representing 50% of guests.
Recommendations for Hosts
- Focus marketing internationally, particularly towards travelers from United States.
- Tailor amenities and listing descriptions to appeal to the dominant Post-2000s (Gen Z/Alpha) demographic (e.g., highlight fast WiFi, smart home features, local guides).
- Highlight unique local experiences or amenities relevant to the primary guest profile.
- Consider seasonal promotions aligned with peak travel times for key origin markets.
Nearby Short-Term Rental Market Comparison
How does the Salento Airbnb market stack up against its neighbors? Compare key performance metrics like average monthly revenue, ADR, and occupancy rates in surrounding areas to understand the broader regional STR landscape.
| Market | Active Properties | Monthly Revenue | Daily Rate | Avg. Occupancy |
|---|---|---|---|---|
| Cauca Viejo | 26 | $2,181 | $298.12 | 27% |
| Anapoima | 286 | $1,775 | $279.24 | 26% |
| Apulo | 105 | $1,505 | $270.37 | 22% |
| Cundinamarca | 11 | $1,424 | $201.05 | 23% |
| La Pintada | 20 | $1,381 | $258.80 | 24% |
| Fredonia | 14 | $1,284 | $201.88 | 23% |
| La Buitrera | 15 | $1,161 | $146.95 | 26% |
| Nilo | 73 | $1,138 | $246.56 | 21% |
| Quebradanegra | 22 | $977 | $189.40 | 16% |
| El Imperio | 14 | $900 | $193.43 | 19% |