Filandia Airbnb Market Analysis 2026: Short Term Rental Data & Vacation Rental Statistics in Quindío, Colombia
Is Airbnb profitable in Filandia in 2026? Explore comprehensive Airbnb analytics for Filandia, Quindío, Colombia to uncover income potential. This 2026 STR market report for Filandia, based on AirROI data from February 2025 to January 2026, reveals key trends in the market of 202 active listings.
Whether you're considering an Airbnb investment in Filandia, optimizing your existing vacation rental, or exploring rental arbitrage opportunities, understanding the Filandia Airbnb data is crucial. Navigating the high regulation landscape is key to maximizing your short term rental income potential. Let's dive into the specifics.
Key Filandia Airbnb Performance Metrics Overview
Monthly Airbnb Revenue Variations & Income Potential in Filandia (2026)
Understanding the monthly revenue variations for Airbnb listings in Filandia is key to maximizing your short term rental income potential. Seasonality significantly impacts earnings. Our analysis, based on data from the past 12 months, shows that the peak revenue month for STRs in Filandia is typically December, while October often presents the lowest earnings, highlighting opportunities for strategic pricing adjustments during shoulder and low seasons. Explore the typical Airbnb income in Filandia across different performance tiers:
- Best-in-class properties (Top 10%) achieve $1,528+ monthly, often utilizing dynamic pricing and superior guest experiences.
- Strong performing properties (Top 25%) earn $728 or more, indicating effective management and desirable locations/amenities.
- Typical properties (Median) generate around $345 per month, representing the average market performance.
- Entry-level properties (Bottom 25%) see earnings around $150, often with potential for optimization.
Average Monthly Airbnb Earnings Trend in Filandia
Filandia Airbnb Occupancy Rate Trends (2026)
Maximize your bookings by understanding the Filandia STR occupancy trends. Seasonal demand shifts significantly influence how often properties are booked. Typically, Januarysees the highest demand (peak season occupancy), while May experiences the lowest (low season). Effective strategies, like adjusting minimum stays or offering promotions, can boost occupancy during slower periods. Here's how different property tiers perform in Filandia:
- Best-in-class properties (Top 10%) achieve 52%+ occupancy, indicating high desirability and potentially optimized availability.
- Strong performing properties (Top 25%) maintain 34% or higher occupancy, suggesting good market fit and guest satisfaction.
- Typical properties (Median) have an occupancy rate around 19%.
- Entry-level properties (Bottom 25%) average 10% occupancy, potentially facing higher vacancy.
Average Monthly Occupancy Rate Trend in Filandia
Average Daily Rate (ADR) Airbnb Trends in Filandia (2026)
Effective short term rental pricing strategy in Filandia involves understanding monthly ADR fluctuations. The Average Daily Rate (ADR) for Airbnb in Filandia typically peaks in December and dips lowest during February. Leveraging Airbnb dynamic pricing tools or strategies based on this seasonality can significantly boost revenue. Here's a look at the typical nightly rates achieved:
- Best-in-class properties (Top 10%) command rates of $146+ per night, often due to premium features or locations.
- Strong performing properties (Top 25%) achieve nightly rates of $104 or more.
- Typical properties (Median) charge around $58 per night.
- Entry-level properties (Bottom 25%) earn around $35 per night.
Average Daily Rate (ADR) Trend by Month in Filandia
Get Live Filandia Market Intelligence 👇

Explore Real-time Analytics
Airbnb Seasonality Analysis & Trends in Filandia (2026)
Peak Season (December, July, January)
- Revenue averages $779 per month
- Occupancy rates average 26.8%
- Daily rates average $81
Shoulder Season
- Revenue averages $643 per month
- Occupancy maintains around 24.4%
- Daily rates hold near $77
Low Season (February, May, October)
- Revenue drops to average $535 per month
- Occupancy decreases to average 21.0%
- Daily rates adjust to average $76
Seasonality Insights for Filandia
- The Airbnb seasonality in Filandia shows moderate seasonality with distinct peak and low periods. While the sections above show seasonal averages, it's also insightful to look at the extremes:
- During the high season, the absolute peak month showcases Filandia's highest earning potential, with monthly revenues capable of climbing to $802, occupancy reaching a high of 27.3%, and ADRs peaking at $84.
- Conversely, the slowest single month of the year, typically falling within the low season, marks the market's lowest point. In this month, revenue might dip to $468, occupancy could drop to 15.9%, and ADRs may adjust down to $73.
- Understanding both the seasonal averages and these monthly peaks and troughs in revenue, occupancy, and ADR is crucial for maximizing your Airbnb profit potential in Filandia.
Seasonal Strategies for Maximizing Profit
- Peak Season: Maximize revenue through premium pricing and potentially longer minimum stays. Ensure high availability.
- Low Season: Offer competitive pricing, special promotions (e.g., extended stay discounts), and flexible cancellation policies. Target off-season travelers like remote workers or budget-conscious guests.
- Shoulder Seasons: Implement dynamic pricing that balances peak and low rates. Target weekend travelers or specific events. Offer slightly more flexible terms than peak season.
- Regularly analyze your own performance against these Filandia seasonality benchmarks and adjust your pricing and availability strategy accordingly.
Best Areas for Airbnb Investment in Filandia (2026)
Exploring the top neighborhoods for short-term rentals in Filandia? This section highlights key areas, outlining why they are attractive for hosts and guests, along with notable local attractions. Consider these locations based on your target guest profile and investment strategy.
| Neighborhood / Area | Why Host Here? (Target Guests & Appeal) | Key Attractions & Landmarks |
|---|---|---|
| Centro Histórico | The historical center of Filandia offers charming colonial architecture and a vibrant local atmosphere, making it a prime spot for tourists exploring Colombian culture and heritage. | Filandia's Plaza Principal, Church of Our Lady of the Rosary, Café La Palma, Local artisan shops, Calle de los Artesanos, Mirador de la Cruz |
| El Mirador | This area offers stunning views of the surrounding mountains and coffee farms, attracting nature lovers and visitors looking for picturesque scenery and tranquility. | Mirador del Quindio, Coffee plantations tours, Hiking trails, Bamboo and Nature Park |
| Manizales Road | A popular route for travelers heading to nearby attractions, featuring various eateries and convenient accommodations for passing tourists. | Los Nevados National Park, Termales del Ruiz, Cafés and restaurants along the route, Cultural landmarks, Scenic viewpoints |
| Café de Colombia | A focus on the coffee culture that defines the region; this area is perfect for guests wanting to experience local coffee growing and tasting. | Coffee farm tours, Coffee tasting experiences, Café shops, Nature trails, Cultural workshops |
| La Montaña | An escape for nature enthusiasts, La Montaña is ideal for those seeking outdoor adventures such as hiking and bird watching in lush forests. | Hiking and trekking trails, Bird watching, Natural parks, Camping sites |
| Caldas Road | A scenic drive linking various tourist attractions, providing easy access to recreation spots and accommodations with stunning views. | Cafés and local goods along the route, Natural hot springs, Scenic overlooks, Cultural festivals |
| El Jardín | This area boasts beautiful gardens and a peaceful environment, catering to visitors looking for relaxation and a connection with nature. | Botanical gardens, Nature workshops, Local artisan markets, Photography spots |
| Quindío Botanical Garden | A unique attraction focusing on the region's diverse plant life. Ideal for eco-tourists and families looking for educational fun. | Plant exhibitions, Kids' play areas, Guided tours, Workshops on sustainability |
Understanding Airbnb License Requirements & STR Laws in Filandia (2026)
Yes, Filandia, Quindío, Colombia enforces high STR regulations. Obtaining a license and ensuring compliance is almost certainly required according to current 2026 STR laws. Always verify the latest short term rental regulations and Airbnb license requirements directly with local government authorities for Filandia to ensure full compliance before hosting.
(Source: AirROI data, 2026, based on 94% licensed listings)
Top Performing Airbnb Properties in Filandia (2026)
Benchmark your potential! Explore examples of top-performing Airbnb properties in Filandiabased on Trailing Twelve Month (TTM) revenue. Analyze their characteristics, revenue, occupancy rate, and ADR to understand what drives success in this market.
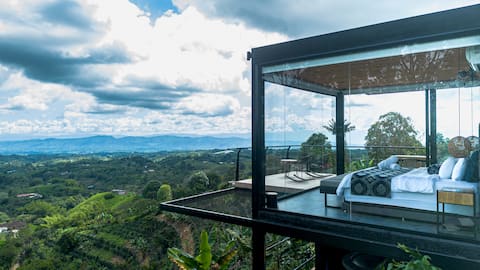
The Little House of Heaven - Breathtaking Views Finland
Entire Place • 1 bedroom
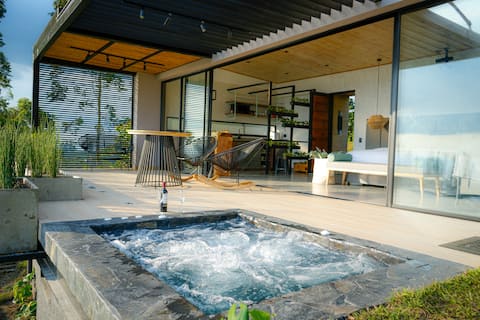
La Casita de la Montaña - Stunning View in Filandia
Entire Place • 1 bedroom
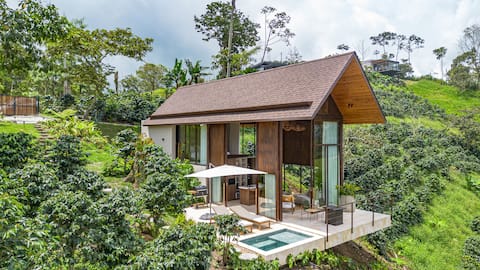
La Casita Finlandia - Lotus Flower - Stunning View
Entire Place • 1 bedroom

Monarch Reservation
Entire Place • 8 bedrooms
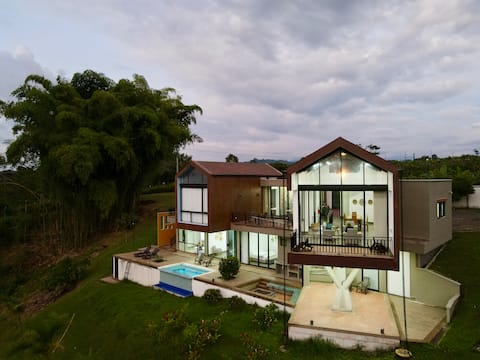
Villa with infinity pool and 180° views Filandia
Entire Place • 4 bedrooms
★HERMOSA FINCA DE DESCANSO★ EN EL EJE CAFETERO★
Entire Place • 8 bedrooms
Note: Performance varies based on location, size, amenities, seasonality, and management quality. Data reflects the past 12 months.
Top Performing Airbnb Hosts in Filandia (2026)
Learn from the best! This table showcases top-performing Airbnb hosts in Filandia based on the number of properties managed and estimated total revenue over the past year. Analyze their scale and performance metrics.
| Host Name | Properties | Grossing Revenue | Stay Reviews | Avg Rating |
|---|---|---|---|---|
| Felipe Bernal | 4 | $149,079 | 663 | 4.95/5.0 |
| Alejo | 5 | $60,339 | 356 | 4.96/5.0 |
| Renny | 4 | $55,458 | 256 | 4.81/5.0 |
| Sandra | 3 | $39,806 | 39 | 4.88/5.0 |
| Tania | 1 | $34,807 | 2 | Not Rated |
| Angelica | 1 | $28,682 | 49 | 4.59/5.0 |
| Jorge Mario | 5 | $28,268 | 34 | 4.82/5.0 |
| Faruk | 2 | $23,132 | 79 | 4.92/5.0 |
| Cristian | 4 | $21,989 | 146 | 4.84/5.0 |
| Sara | 1 | $18,520 | 47 | 4.89/5.0 |
Analyzing the strategies of top hosts, such as their property selection, pricing, and guest communication, can offer valuable lessons for optimizing your own Airbnb operations in Filandia.
Dive Deeper: Advanced Filandia STR Market Data (2026)
Ready to unlock more insights? AirROI provides access to advanced metrics and comprehensive Airbnb data for Filandia. Explore detailed analytics beyond this report to refine your investment strategy, optimize pricing, and maximize your vacation rental profits.
Explore Advanced MetricsFilandia Short-Term Rental Market Composition (2026): Property & Room Types
Room Type Distribution
Property Type Distribution
Market Composition Insights for Filandia
- The Filandia Airbnb market composition is heavily skewed towards Entire Home/Apt listings, which make up 65.8% of the 202 active rentals. This indicates strong guest preference for privacy and space.
- However, a notable 33.7% share for Private Rooms suggests opportunities for budget-conscious travelers or hosts renting out spare rooms.
- Looking at the property type distribution in Filandia, House properties are the most common (36.1%), reflecting the local real estate landscape.
- Houses represent a significant 36.1% portion, catering likely to families or larger groups.
- The presence of 21.3% Hotel/Boutique listings indicates integration with traditional hospitality.
- Smaller segments like unique stays, others (combined 5.0%) offer potential for unique stay experiences.
Filandia Airbnb Room Capacity Analysis (2026): Bedroom Distribution
Distribution of Listings by Number of Bedrooms
Room Capacity Insights for Filandia
- The dominant room capacity in Filandia is 1 bedroom listings, making up 43.1% of the market. This suggests a strong demand for properties suitable for couples or solo travelers.
- Together, 1 bedroom and 3 bedrooms properties represent 64.4% of the active Airbnb listings in Filandia, indicating a high concentration in these sizes.
- A significant 34.6% of listings offer 3+ bedrooms, catering to larger groups and families seeking more space in Filandia.
Filandia Vacation Rental Guest Capacity Trends (2026)
Distribution of Listings by Guest Capacity
Guest Capacity Insights for Filandia
- The most common guest capacity trend in Filandia vacation rentals is listings accommodating 2 guests (25.7%). This suggests the primary traveler segment is likely couples or solo travelers.
- Properties designed for 2 guests and 8+ guests dominate the Filandia STR market, accounting for 49.5% of listings.
- 38.7% of properties accommodate 6+ guests, serving the market segment for larger families or group travel in Filandia.
- On average, properties in Filandia are equipped to host 4.3 guests.
Filandia Airbnb Booking Patterns (2026): Available vs. Booked Days
Available Days Distribution
Booked Days Distribution
Booking Pattern Insights for Filandia
- The most common availability pattern in Filandia falls within the 271-366 days range, representing 82.2% of listings. This suggests many properties have significant open periods on their calendars.
- Approximately 97.5% of listings show high availability (181+ days open annually), indicating potential for increased bookings or specific owner usage patterns.
- For booked days, the 1-30 days range is most frequent in Filandia (47.5%), reflecting common guest stay durations or potential owner blocking patterns.
- A notable 2.5% of properties secure long booking periods (181+ days booked per year), highlighting successful long-term rental strategies or significant owner usage.
Filandia Airbnb Minimum Stay Requirements Analysis
Distribution of Listings by Minimum Night Requirement
1 Night
173 listings
85.6% of total
2 Nights
11 listings
5.4% of total
30+ Nights
18 listings
8.9% of total
Key Insights
- The most prevalent minimum stay requirement in Filandia is 1 Night, adopted by 85.6% of listings. This highlights the market's preference for shorter, flexible bookings.
- A strong majority (91.0%) of the Filandia Airbnb data shows acceptance of very short stays (1-2 nights), indicating a dynamic, high-turnover market.
Recommendations
- Align with the market by considering a 1 Night minimum stay, as 85.6% of Filandia hosts use this setting.
- Explore offering discounts for stays of 30+ nights to attract the 8.9% of the market seeking extended stays.
- Adjust minimum nights based on seasonality – potentially shorter during low season and longer during peak demand periods in Filandia.
Filandia Airbnb Cancellation Policy Trends Analysis (2026)
Limited
6 listings
3% of total
Flexible
90 listings
45.2% of total
Moderate
60 listings
30.2% of total
Firm
39 listings
19.6% of total
Strict
4 listings
2% of total
Cancellation Policy Insights for Filandia
- The prevailing Airbnb cancellation policy trend in Filandia is Flexible, used by 45.2% of listings.
- The market strongly favors guest-friendly terms, with 75.4% of listings offering Flexible or Moderate policies. This suggests guests in Filandia may expect booking flexibility.
- Strict cancellation policies are quite rare (2%), potentially making listings with this policy less competitive unless justified by high demand or property type.
Recommendations for Hosts
- Consider adopting a Flexible policy to align with the 45.2% market standard in Filandia.
- Using a Strict policy might deter some guests, as only 2% of listings use it. Evaluate if potential revenue protection outweighs possible lower booking rates.
- Regularly review your cancellation policy against competitors and market demand shifts in Filandia.
Filandia STR Booking Lead Time Analysis (2026)
Average Booking Lead Time by Month
Booking Lead Time Insights for Filandia
- The overall average booking lead time for vacation rentals in Filandia is 29 days.
- Guests book furthest in advance for stays during December (average 50 days), likely coinciding with peak travel demand or local events.
- The shortest booking windows occur for stays in March (average 16 days), indicating more last-minute travel plans during this time.
- Seasonally, Winter (32 days avg.) sees the longest lead times, while Spring (24 days avg.) has the shortest, reflecting typical travel planning cycles.
Recommendations for Hosts
- Use the overall average lead time (29 days) as a baseline for your pricing and availability strategy in Filandia.
- For December stays, consider implementing length-of-stay discounts or slightly higher rates for bookings made less than 50 days out to capitalize on advance planning.
- Target marketing efforts for the Winter season well in advance (at least 32 days) to capture early planners.
- Monitor your own booking lead times against these Filandia averages to identify opportunities for dynamic pricing adjustments.
Popular & Essential Airbnb Amenities in Filandia (2026)
Amenity Prevalence
Amenity Insights for Filandia
- Popular amenities like Wifi, TV, Hot water are common but not universal. Offering these can provide a competitive edge.
- Warning: Wifi is not universally provided but is considered essential globally. Ensure reliable Wifi is offered.
Recommendations for Hosts
- Consider adding popular differentiators like Wifi or TV to increase appeal.
- Highlight unique or less common amenities you offer (e.g., hot tub, dedicated workspace, EV charger) in your listing description and photos.
- Regularly check competitor amenities in Filandia to stay competitive.
Filandia Airbnb Guest Demographics & Profile Analysis (2026)
Guest Profile Summary for Filandia
- The typical guest profile for Airbnb in Filandia consists of a mix of domestic (43%) and international guests, with top international origins including United States, typically belonging to the Post-2000s (Gen Z/Alpha) group (50%), primarily speaking Spanish or English.
- Domestic travelers account for 43.1% of guests.
- Key international markets include Colombia (43.1%) and United States (20.2%).
- Top languages spoken are Spanish (43.2%) followed by English (38.5%).
- A significant demographic segment is the Post-2000s (Gen Z/Alpha) group, representing 50% of guests.
Recommendations for Hosts
- Balance marketing efforts between domestic and international channels based on the guest mix.
- Tailor amenities and listing descriptions to appeal to the dominant Post-2000s (Gen Z/Alpha) demographic (e.g., highlight fast WiFi, smart home features, local guides).
- Highlight unique local experiences or amenities relevant to the primary guest profile.
- Consider seasonal promotions aligned with peak travel times for key origin markets.
Nearby Short-Term Rental Market Comparison
How does the Filandia Airbnb market stack up against its neighbors? Compare key performance metrics like average monthly revenue, ADR, and occupancy rates in surrounding areas to understand the broader regional STR landscape.
| Market | Active Properties | Monthly Revenue | Daily Rate | Avg. Occupancy |
|---|---|---|---|---|
| Cauca Viejo | 26 | $2,181 | $298.12 | 27% |
| Anapoima | 286 | $1,775 | $279.24 | 26% |
| Apulo | 105 | $1,505 | $270.37 | 22% |
| Cundinamarca | 11 | $1,424 | $201.05 | 23% |
| La Pintada | 20 | $1,381 | $258.80 | 24% |
| Fredonia | 14 | $1,284 | $201.88 | 23% |
| La Buitrera | 15 | $1,161 | $146.95 | 26% |
| Nilo | 73 | $1,138 | $246.56 | 21% |
| Quebradanegra | 22 | $977 | $189.40 | 16% |
| El Imperio | 14 | $900 | $193.43 | 19% |