Buritaca Airbnb Market Analysis 2026: Short Term Rental Data & Vacation Rental Statistics in Magdalena, Colombia
Is Airbnb profitable in Buritaca in 2026? Explore comprehensive Airbnb analytics for Buritaca, Magdalena, Colombia to uncover income potential. This 2026 STR market report for Buritaca, based on AirROI data from February 2025 to January 2026, reveals key trends in the niche market of 26 active listings.
Whether you're considering an Airbnb investment in Buritaca, optimizing your existing vacation rental, or exploring rental arbitrage opportunities, understanding the Buritaca Airbnb data is crucial. Navigating the high regulation landscape is key to maximizing your short term rental income potential. Let's dive into the specifics.
Key Buritaca Airbnb Performance Metrics Overview
Monthly Airbnb Revenue Variations & Income Potential in Buritaca (2026)
Understanding the monthly revenue variations for Airbnb listings in Buritaca is key to maximizing your short term rental income potential. Seasonality significantly impacts earnings. Our analysis, based on data from the past 12 months, shows that the peak revenue month for STRs in Buritaca is typically December, while October often presents the lowest earnings, highlighting opportunities for strategic pricing adjustments during shoulder and low seasons. Explore the typical Airbnb income in Buritaca across different performance tiers:
- Best-in-class properties (Top 10%) achieve $2,506+ monthly, often utilizing dynamic pricing and superior guest experiences.
- Strong performing properties (Top 25%) earn $1,048 or more, indicating effective management and desirable locations/amenities.
- Typical properties (Median) generate around $535 per month, representing the average market performance.
- Entry-level properties (Bottom 25%) see earnings around $210, often with potential for optimization.
Average Monthly Airbnb Earnings Trend in Buritaca
Buritaca Airbnb Occupancy Rate Trends (2026)
Maximize your bookings by understanding the Buritaca STR occupancy trends. Seasonal demand shifts significantly influence how often properties are booked. Typically, Februarysees the highest demand (peak season occupancy), while December experiences the lowest (low season). Effective strategies, like adjusting minimum stays or offering promotions, can boost occupancy during slower periods. Here's how different property tiers perform in Buritaca:
- Best-in-class properties (Top 10%) achieve 64%+ occupancy, indicating high desirability and potentially optimized availability.
- Strong performing properties (Top 25%) maintain 47% or higher occupancy, suggesting good market fit and guest satisfaction.
- Typical properties (Median) have an occupancy rate around 23%.
- Entry-level properties (Bottom 25%) average 10% occupancy, potentially facing higher vacancy.
Average Monthly Occupancy Rate Trend in Buritaca
Average Daily Rate (ADR) Airbnb Trends in Buritaca (2026)
Effective short term rental pricing strategy in Buritaca involves understanding monthly ADR fluctuations. The Average Daily Rate (ADR) for Airbnb in Buritaca typically peaks in January and dips lowest during September. Leveraging Airbnb dynamic pricing tools or strategies based on this seasonality can significantly boost revenue. Here's a look at the typical nightly rates achieved:
- Best-in-class properties (Top 10%) command rates of $213+ per night, often due to premium features or locations.
- Strong performing properties (Top 25%) achieve nightly rates of $140 or more.
- Typical properties (Median) charge around $56 per night.
- Entry-level properties (Bottom 25%) earn around $36 per night.
Average Daily Rate (ADR) Trend by Month in Buritaca
Get Live Buritaca Market Intelligence 👇

Explore Real-time Analytics
Airbnb Seasonality Analysis & Trends in Buritaca (2026)
Peak Season (December, January, April)
- Revenue averages $1,306 per month
- Occupancy rates average 27.7%
- Daily rates average $113
Shoulder Season
- Revenue averages $966 per month
- Occupancy maintains around 30.9%
- Daily rates hold near $97
Low Season (June, August, October)
- Revenue drops to average $696 per month
- Occupancy decreases to average 28.9%
- Daily rates adjust to average $100
Seasonality Insights for Buritaca
- The Airbnb seasonality in Buritaca shows highly seasonal trends requiring careful strategy. While the sections above show seasonal averages, it's also insightful to look at the extremes:
- During the high season, the absolute peak month showcases Buritaca's highest earning potential, with monthly revenues capable of climbing to $1,533, occupancy reaching a high of 35.0%, and ADRs peaking at $125.
- Conversely, the slowest single month of the year, typically falling within the low season, marks the market's lowest point. In this month, revenue might dip to $666, occupancy could drop to 24.0%, and ADRs may adjust down to $89.
- Understanding both the seasonal averages and these monthly peaks and troughs in revenue, occupancy, and ADR is crucial for maximizing your Airbnb profit potential in Buritaca.
Seasonal Strategies for Maximizing Profit
- Peak Season: Maximize revenue through premium pricing and potentially longer minimum stays. Ensure high availability.
- Low Season: Offer competitive pricing, special promotions (e.g., extended stay discounts), and flexible cancellation policies. Target off-season travelers like remote workers or budget-conscious guests.
- Shoulder Seasons: Implement dynamic pricing that balances peak and low rates. Target weekend travelers or specific events. Offer slightly more flexible terms than peak season.
- Regularly analyze your own performance against these Buritaca seasonality benchmarks and adjust your pricing and availability strategy accordingly.
Best Areas for Airbnb Investment in Buritaca (2026)
Exploring the top neighborhoods for short-term rentals in Buritaca? This section highlights key areas, outlining why they are attractive for hosts and guests, along with notable local attractions. Consider these locations based on your target guest profile and investment strategy.
| Neighborhood / Area | Why Host Here? (Target Guests & Appeal) | Key Attractions & Landmarks |
|---|---|---|
| Buritaca Beach | A beautiful and serene beach destination, popular for its blend of nature and tranquility. Ideal for tourists seeking relaxation, adventure, and proximity to natural wonders. | Buritaca River, El Parque Tayrona, Local beach bars and restaurants, Surfing spots, Hiking trails |
| Tayrona National Park | A UNESCO Biosphere Reserve known for its stunning biodiversity and breathtaking landscapes. Perfect for nature lovers, hikers, and those looking for eco-tourism experiences. | Cabo San Juan, La Piscina, Restinga Beach, Wildlife watching, Hiking trails |
| Palomino | A small beach town with a laid-back vibe, known for its stunning views and adventurous activities like tubing on the river. Attracts a diverse crowd looking for beach amenities and nature. | Palomino Beach, Palomino River, Local restaurants and cafes, Hiking in the Sierra Nevada, Cultural experiences with the indigenous communities |
| Santa Marta | The nearest major city and a travel hub for visitors exploring the surrounding natural attractions, Santa Marta offers urban amenities alongside historical sites. | Parque de los Novios, Rodadero Beach, Historic center of Santa Marta, Sierra Nevada mountains, Cultural experiences |
| Minca | A small village close to Santa Marta, Minca is known for its coffee farms, waterfalls, and cooler climate. It attracts tourists looking for adventure and nature exploration. | Pozo Azul, Coffee farms, Los Pinos viewpoint, Waterfalls, Hiking trails |
| La Guajira | A unique and remote region known for its desert landscapes and indigenous Wayuu culture. It offers a different experience for tourists interested in exploring Colombia's diverse geography. | Cabo de la Vela, Punta Gallinas, Wayuu culture, Desert landscapes, Wildlife |
| Costeño Beach | An emerging beach destination with a focus on sustainability and eco-tourism. It is popular among surfers and those seeking a peaceful beach experience. | Costeño Beach surf spots, Yoga retreats, Networking with local surfers, Sustainable restaurants, Camping |
| Taganga | A fishing village turned tourist hotspot, known for its diving spots and vibrant nightlife. Attracts both backpackers and families looking for water activities and local culture. | Diving and snorkeling spots, Taganga Beach, Restaurants with fresh seafood, Fishermen's village, Nightlife spots |
Understanding Airbnb License Requirements & STR Laws in Buritaca (2026)
Yes, Buritaca, Magdalena, Colombia enforces high STR regulations. Obtaining a license and ensuring compliance is almost certainly required according to current 2026 STR laws. Always verify the latest short term rental regulations and Airbnb license requirements directly with local government authorities for Buritaca to ensure full compliance before hosting.
(Source: AirROI data, 2026, based on 96% licensed listings)
Top Performing Airbnb Properties in Buritaca (2026)
Benchmark your potential! Explore examples of top-performing Airbnb properties in Buritacabased on Trailing Twelve Month (TTM) revenue. Analyze their characteristics, revenue, occupancy rate, and ADR to understand what drives success in this market.
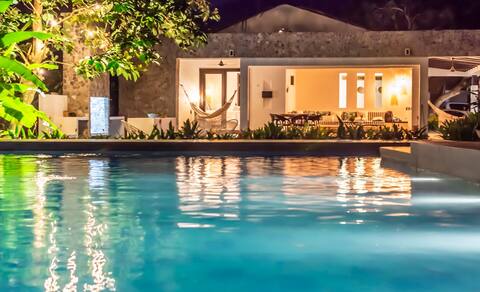
NEW beach villa w pool between Tayrona & Palomino
Entire Place • 5 bedrooms

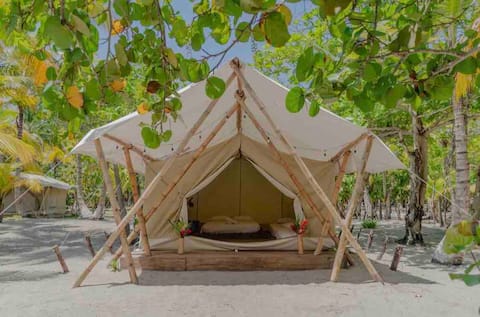
Tayrona Ecolodge Corner (Colibri)
Entire Place • 2 bedrooms

Luxurious private eco cabin with seaview 1
Entire Place • 1 bedroom

Double Room - La Finca Buritaca
Private Room • 1 bedroom

Manoush Beach – Sea View
Private Room • 1 bedroom
Manoush Beach – Sea View
Private Room • 1 bedroom
Note: Performance varies based on location, size, amenities, seasonality, and management quality. Data reflects the past 12 months.
Top Performing Airbnb Hosts in Buritaca (2026)
Learn from the best! This table showcases top-performing Airbnb hosts in Buritaca based on the number of properties managed and estimated total revenue over the past year. Analyze their scale and performance metrics.
| Host Name | Properties | Grossing Revenue | Stay Reviews | Avg Rating |
|---|---|---|---|---|
| Sandra | 2 | $59,995 | 34 | 4.73/5.0 |
| Lea | 4 | $27,673 | 218 | 4.90/5.0 |
| Juliette | 1 | $24,877 | 16 | 4.88/5.0 |
| Julia | 2 | $20,884 | 49 | 4.59/5.0 |
| Gardenia Springs | 2 | $15,353 | 8 | 5.00/5.0 |
| Buritaca | 4 | $10,087 | 20 | 4.60/5.0 |
| Ethan | 2 | $8,506 | 4 | 4.67/5.0 |
| Puerto Alto | 3 | $6,597 | 9 | 4.33/5.0 |
| Elizabeth | 2 | $2,624 | 44 | 4.62/5.0 |
| Danielle | 2 | $1,559 | 27 | 5.00/5.0 |
Analyzing the strategies of top hosts, such as their property selection, pricing, and guest communication, can offer valuable lessons for optimizing your own Airbnb operations in Buritaca.
Dive Deeper: Advanced Buritaca STR Market Data (2026)
Ready to unlock more insights? AirROI provides access to advanced metrics and comprehensive Airbnb data for Buritaca. Explore detailed analytics beyond this report to refine your investment strategy, optimize pricing, and maximize your vacation rental profits.
Explore Advanced MetricsBuritaca Short-Term Rental Market Composition (2026): Property & Room Types
Room Type Distribution
Property Type Distribution
Market Composition Insights for Buritaca
- The Buritaca Airbnb market composition is heavily skewed towards Private Room listings, which make up 69.2% of the 26 active rentals. This indicates strong guest preference for privacy and space.
- Looking at the property type distribution in Buritaca, Outdoor/Unique properties are the most common (34.6%), reflecting the local real estate landscape.
- Houses represent a significant 15.4% portion, catering likely to families or larger groups.
- The presence of 30.8% Hotel/Boutique listings indicates integration with traditional hospitality.
- Smaller segments like unique stays (combined 3.8%) offer potential for unique stay experiences.
Buritaca Airbnb Room Capacity Analysis (2026): Bedroom Distribution
Distribution of Listings by Number of Bedrooms
Room Capacity Insights for Buritaca
- The dominant room capacity in Buritaca is 1 bedroom listings, making up 53.8% of the market. This suggests a strong demand for properties suitable for couples or solo travelers.
- Together, 1 bedroom and 2 bedrooms properties represent 73.0% of the active Airbnb listings in Buritaca, indicating a high concentration in these sizes.
- With over half the market (53.8%) consisting of studios or 1-bedroom units, Buritaca is particularly well-suited for individuals or couples.
- Listings with 3+ bedrooms (3.8%) represent a smaller niche, potentially indicating an underserved market for larger group accommodations in Buritaca.
Buritaca Vacation Rental Guest Capacity Trends (2026)
Distribution of Listings by Guest Capacity
Guest Capacity Insights for Buritaca
- The most common guest capacity trend in Buritaca vacation rentals is listings accommodating 2 guests (26.9%). This suggests the primary traveler segment is likely couples or solo travelers.
- Properties designed for 2 guests and 3 guests dominate the Buritaca STR market, accounting for 46.1% of listings.
- 19.2% of properties accommodate 6+ guests, serving the market segment for larger families or group travel in Buritaca.
- On average, properties in Buritaca are equipped to host 3.0 guests.
Buritaca Airbnb Booking Patterns (2026): Available vs. Booked Days
Available Days Distribution
Booked Days Distribution
Booking Pattern Insights for Buritaca
- The most common availability pattern in Buritaca falls within the 271-366 days range, representing 73.1% of listings. This suggests many properties have significant open periods on their calendars.
- Approximately 92.3% of listings show high availability (181+ days open annually), indicating potential for increased bookings or specific owner usage patterns.
- For booked days, the 31-90 days range is most frequent in Buritaca (38.5%), reflecting common guest stay durations or potential owner blocking patterns.
- A notable 7.7% of properties secure long booking periods (181+ days booked per year), highlighting successful long-term rental strategies or significant owner usage.
Buritaca Airbnb Minimum Stay Requirements Analysis
Distribution of Listings by Minimum Night Requirement
1 Night
23 listings
88.5% of total
2 Nights
2 listings
7.7% of total
7-29 Nights
1 listings
3.8% of total
Key Insights
- The most prevalent minimum stay requirement in Buritaca is 1 Night, adopted by 88.5% of listings. This highlights the market's preference for shorter, flexible bookings.
- A strong majority (96.2%) of the Buritaca Airbnb data shows acceptance of very short stays (1-2 nights), indicating a dynamic, high-turnover market.
Recommendations
- Align with the market by considering a 1 Night minimum stay, as 88.5% of Buritaca hosts use this setting.
- Adjust minimum nights based on seasonality – potentially shorter during low season and longer during peak demand periods in Buritaca.
Buritaca Airbnb Cancellation Policy Trends Analysis (2026)
Limited
3 listings
12% of total
Flexible
17 listings
68% of total
Moderate
2 listings
8% of total
Firm
3 listings
12% of total
Cancellation Policy Insights for Buritaca
- The prevailing Airbnb cancellation policy trend in Buritaca is Flexible, used by 68% of listings.
- The market strongly favors guest-friendly terms, with 76.0% of listings offering Flexible or Moderate policies. This suggests guests in Buritaca may expect booking flexibility.
Recommendations for Hosts
- Consider adopting a Flexible policy to align with the 68% market standard in Buritaca.
- Given the high prevalence of Flexible policies (68%), offering this can enhance booking appeal, especially during shoulder seasons.
- Regularly review your cancellation policy against competitors and market demand shifts in Buritaca.
Buritaca STR Booking Lead Time Analysis (2026)
Average Booking Lead Time by Month
Booking Lead Time Insights for Buritaca
- The overall average booking lead time for vacation rentals in Buritaca is 44 days.
- Guests book furthest in advance for stays during November (average 65 days), likely coinciding with peak travel demand or local events.
- The shortest booking windows occur for stays in June (average 16 days), indicating more last-minute travel plans during this time.
- Seasonally, Fall (55 days avg.) sees the longest lead times, while Spring (32 days avg.) has the shortest, reflecting typical travel planning cycles.
Recommendations for Hosts
- Use the overall average lead time (44 days) as a baseline for your pricing and availability strategy in Buritaca.
- For November stays, consider implementing length-of-stay discounts or slightly higher rates for bookings made less than 65 days out to capitalize on advance planning.
- Target marketing efforts for the Fall season well in advance (at least 55 days) to capture early planners.
- Monitor your own booking lead times against these Buritaca averages to identify opportunities for dynamic pricing adjustments.
Popular & Essential Airbnb Amenities in Buritaca (2026)
Amenity Prevalence
Amenity Insights for Buritaca
- Essential amenities in Buritaca that guests expect include: Wifi. Lacking these (this) could significantly impact bookings.
- Popular amenities like Bed linens, Essentials, Outdoor dining area are common but not universal. Offering these can provide a competitive edge.
Recommendations for Hosts
- Ensure your listing includes all essential amenities for Buritaca: Wifi.
- Prioritize adding missing essentials: Wifi.
- Consider adding popular differentiators like Bed linens or Essentials to increase appeal.
- Highlight unique or less common amenities you offer (e.g., hot tub, dedicated workspace, EV charger) in your listing description and photos.
- Regularly check competitor amenities in Buritaca to stay competitive.
Buritaca Airbnb Guest Demographics & Profile Analysis (2026)
Guest Profile Summary for Buritaca
- The typical guest profile for Airbnb in Buritaca consists of predominantly international visitors (67%), with top international origins including Germany, typically belonging to the Post-2000s (Gen Z/Alpha) group (50%), primarily speaking English or Spanish.
- Domestic travelers account for 32.7% of guests.
- Key international markets include Colombia (32.7%) and Germany (14.3%).
- Top languages spoken are English (37.2%) followed by Spanish (31.9%).
- A significant demographic segment is the Post-2000s (Gen Z/Alpha) group, representing 50% of guests.
Recommendations for Hosts
- Focus marketing internationally, particularly towards travelers from Germany.
- Tailor amenities and listing descriptions to appeal to the dominant Post-2000s (Gen Z/Alpha) demographic (e.g., highlight fast WiFi, smart home features, local guides).
- Highlight unique local experiences or amenities relevant to the primary guest profile.
- Consider seasonal promotions aligned with peak travel times for key origin markets.
Nearby Short-Term Rental Market Comparison
How does the Buritaca Airbnb market stack up against its neighbors? Compare key performance metrics like average monthly revenue, ADR, and occupancy rates in surrounding areas to understand the broader regional STR landscape.
| Market | Active Properties | Monthly Revenue | Daily Rate | Avg. Occupancy |
|---|---|---|---|---|
| Marquetalia | 10 | $1,011 | $93.30 | 33% |
| Sabanilla | 16 | $905 | $194.05 | 19% |
| Guachaca | 34 | $818 | $118.47 | 29% |
| Palomino | 12 | $728 | $116.43 | 31% |
| Santa Marta | 4,379 | $656 | $85.25 | 33% |
| Dibulla | 250 | $607 | $82.53 | 29% |
| Minca | 158 | $541 | $94.52 | 26% |
| Mendihuaca | 11 | $489 | $47.22 | 34% |
| Gaira | 147 | $484 | $68.73 | 36% |
| Eduardo Santos - La Playa | 10 | $473 | $70.15 | 35% |