Aipe Airbnb Market Analysis 2026: Short Term Rental Data & Vacation Rental Statistics in Huila, Colombia
Is Airbnb profitable in Aipe in 2026? Explore comprehensive Airbnb analytics for Aipe, Huila, Colombia to uncover income potential. This 2026 STR market report for Aipe, based on AirROI data from February 2025 to January 2026, reveals key trends in the niche market of 24 active listings.
Whether you're considering an Airbnb investment in Aipe, optimizing your existing vacation rental, or exploring rental arbitrage opportunities, understanding the Aipe Airbnb data is crucial. Navigating the high regulation landscape is key to maximizing your short term rental income potential. Let's dive into the specifics.
Key Aipe Airbnb Performance Metrics Overview
Monthly Airbnb Revenue Variations & Income Potential in Aipe (2026)
Understanding the monthly revenue variations for Airbnb listings in Aipe is key to maximizing your short term rental income potential. Seasonality significantly impacts earnings. Our analysis, based on data from the past 12 months, shows that the peak revenue month for STRs in Aipe is typically January, while February often presents the lowest earnings, highlighting opportunities for strategic pricing adjustments during shoulder and low seasons. Explore the typical Airbnb income in Aipe across different performance tiers:
- Best-in-class properties (Top 10%) achieve $391+ monthly, often utilizing dynamic pricing and superior guest experiences.
- Strong performing properties (Top 25%) earn $216 or more, indicating effective management and desirable locations/amenities.
- Typical properties (Median) generate around $84 per month, representing the average market performance.
- Entry-level properties (Bottom 25%) see earnings around $48, often with potential for optimization.
Average Monthly Airbnb Earnings Trend in Aipe
Aipe Airbnb Occupancy Rate Trends (2026)
Maximize your bookings by understanding the Aipe STR occupancy trends. Seasonal demand shifts significantly influence how often properties are booked. Typically, Januarysees the highest demand (peak season occupancy), while February experiences the lowest (low season). Effective strategies, like adjusting minimum stays or offering promotions, can boost occupancy during slower periods. Here's how different property tiers perform in Aipe:
- Best-in-class properties (Top 10%) achieve 22%+ occupancy, indicating high desirability and potentially optimized availability.
- Strong performing properties (Top 25%) maintain 16% or higher occupancy, suggesting good market fit and guest satisfaction.
- Typical properties (Median) have an occupancy rate around 7%.
- Entry-level properties (Bottom 25%) average 5% occupancy, potentially facing higher vacancy.
Average Monthly Occupancy Rate Trend in Aipe
Average Daily Rate (ADR) Airbnb Trends in Aipe (2026)
Effective short term rental pricing strategy in Aipe involves understanding monthly ADR fluctuations. The Average Daily Rate (ADR) for Airbnb in Aipe typically peaks in January and dips lowest during February. Leveraging Airbnb dynamic pricing tools or strategies based on this seasonality can significantly boost revenue. Here's a look at the typical nightly rates achieved:
- Best-in-class properties (Top 10%) command rates of $51+ per night, often due to premium features or locations.
- Strong performing properties (Top 25%) achieve nightly rates of $45 or more.
- Typical properties (Median) charge around $37 per night.
- Entry-level properties (Bottom 25%) earn around $21 per night.
Average Daily Rate (ADR) Trend by Month in Aipe
Get Live Aipe Market Intelligence 👇

Explore Real-time Analytics
Airbnb Seasonality Analysis & Trends in Aipe (2026)
Peak Season (January, May, December)
- Revenue averages $227 per month
- Occupancy rates average 12.6%
- Daily rates average $37
Shoulder Season
- Revenue averages $159 per month
- Occupancy maintains around 13.2%
- Daily rates hold near $36
Low Season (February, March, July)
- Revenue drops to average $69 per month
- Occupancy decreases to average 6.4%
- Daily rates adjust to average $34
Seasonality Insights for Aipe
- The Airbnb seasonality in Aipe shows highly seasonal trends requiring careful strategy. While the sections above show seasonal averages, it's also insightful to look at the extremes:
- During the high season, the absolute peak month showcases Aipe's highest earning potential, with monthly revenues capable of climbing to $281, occupancy reaching a high of 18.8%, and ADRs peaking at $39.
- Conversely, the slowest single month of the year, typically falling within the low season, marks the market's lowest point. In this month, revenue might dip to $39, occupancy could drop to 4.5%, and ADRs may adjust down to $33.
- Understanding both the seasonal averages and these monthly peaks and troughs in revenue, occupancy, and ADR is crucial for maximizing your Airbnb profit potential in Aipe.
Seasonal Strategies for Maximizing Profit
- Peak Season: Maximize revenue through premium pricing and potentially longer minimum stays. Ensure high availability.
- Low Season: Offer competitive pricing, special promotions (e.g., extended stay discounts), and flexible cancellation policies. Target off-season travelers like remote workers or budget-conscious guests.
- Shoulder Seasons: Implement dynamic pricing that balances peak and low rates. Target weekend travelers or specific events. Offer slightly more flexible terms than peak season.
- Regularly analyze your own performance against these Aipe seasonality benchmarks and adjust your pricing and availability strategy accordingly.
Best Areas for Airbnb Investment in Aipe (2026)
Exploring the top neighborhoods for short-term rentals in Aipe? This section highlights key areas, outlining why they are attractive for hosts and guests, along with notable local attractions. Consider these locations based on your target guest profile and investment strategy.
| Neighborhood / Area | Why Host Here? (Target Guests & Appeal) | Key Attractions & Landmarks |
|---|---|---|
| Aipe Centro | The central area of Aipe offers excellent access to local markets, restaurants, and cultural activities. It's a prime spot for travelers wanting to experience the local lifestyle and community. | Main Plaza, Local Market, Cultural Events, Traditional Colombian Cuisine Restaurants |
| La Laguna | A picturesque area near a scenic lagoon, perfect for nature lovers and those seeking relaxation. It's becoming a popular spot for tourists looking for tranquility and natural beauty. | Laguna de Aipe, Birdwatching, Picnic Areas, Nature Trails |
| El Caño | Known for its beautiful rural landscapes and agricultural heritage, El Caño attracts visitors interested in eco-tourism and rural experiences. It provides an authentic Colombian experience away from the city. | Farmland Tours, Local Farming Experiences, Traditional Crafts, Rural Community Visits |
| Los Samanes | This area is popular for its green spaces and parks, making it ideal for families and outdoor enthusiasts. It offers a mix of recreational activities and relaxation. | Los Samanes Park, Family-Friendly Activities, Outdoor Sports, Nature Walks |
| Vereda San Antonio | Just outside the main town, this area provides a rural escape with stunning views of the countryside. Attractive for visitors looking for a peaceful retreat with outdoor activities. | Hiking Trails, Countryside Views, Local Farm Visits |
| Aipe Cultural District | Aipe is rich in culture and history, making the Cultural District a must-visit for travelers interested in local traditions, music, and festivals. | Cultural Festivals, Local Artisans, Music Events, Traditional Dance Performances |
| Río Aipe | The river area is ideal for adventure seekers and nature lovers, offering activities such as rafting and fishing. It's an exciting option for tourists looking for adventure. | Rafting Adventures, Fishing Spots, Scenic River Views |
| Local Gastronomy Route | This area highlights the rich culinary traditions of the region, appealing to food enthusiasts who want to explore authentic Colombian cuisine. | Local Restaurants, Food Tours, Cooking Classes, Gastronomic Festivals |
Understanding Airbnb License Requirements & STR Laws in Aipe (2026)
Yes, Aipe, Huila, Colombia enforces high STR regulations. Obtaining a license and ensuring compliance is almost certainly required according to current 2026 STR laws. Always verify the latest short term rental regulations and Airbnb license requirements directly with local government authorities for Aipe to ensure full compliance before hosting.
(Source: AirROI data, 2026, based on 100% licensed listings)
Top Performing Airbnb Properties in Aipe (2026)
Benchmark your potential! Explore examples of top-performing Airbnb properties in Aipebased on Trailing Twelve Month (TTM) revenue. Analyze their characteristics, revenue, occupancy rate, and ADR to understand what drives success in this market.
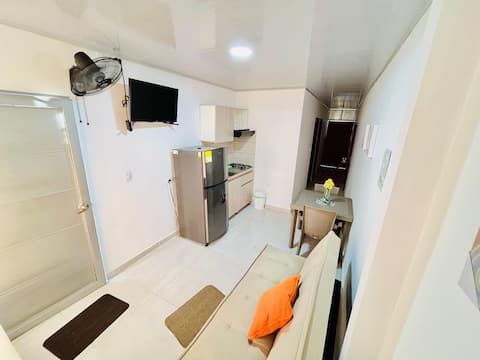
Aipe-Huila accommodation, near the Tatacoa Desert
Entire Place • 2 bedrooms
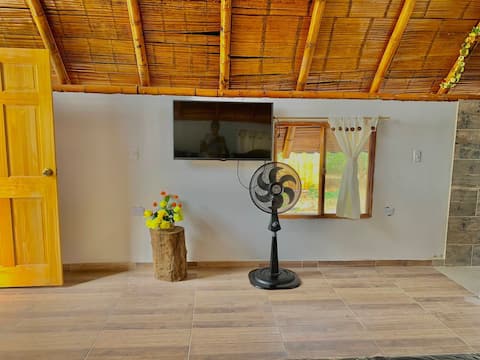
Tatacoa Desert, family cabin #2
Private Room • N/A
Tatacoa Desert, cabins #3
Private Room • 1 bedroom
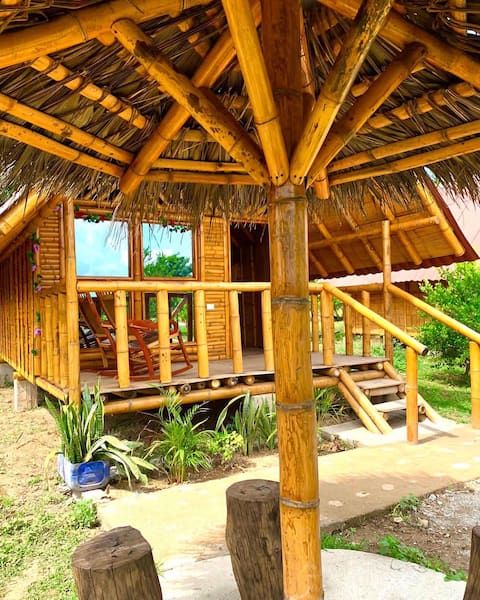
Tatacoa Desert, cabin #5
Private Room • 1 bedroom
Aipe-Huila Lodging, near the Tatacoa Desert
Entire Place • 2 bedrooms
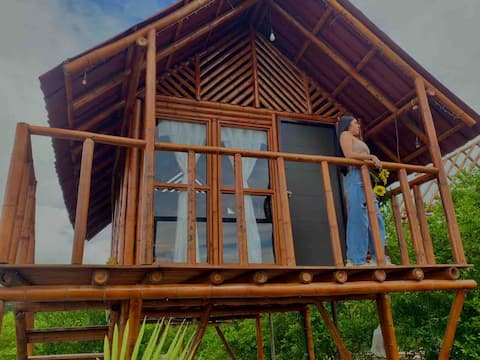
Pacandé Suite, near the Tatacoa Desert
Private Room • 1 bedroom
Note: Performance varies based on location, size, amenities, seasonality, and management quality. Data reflects the past 12 months.
Top Performing Airbnb Hosts in Aipe (2026)
Learn from the best! This table showcases top-performing Airbnb hosts in Aipe based on the number of properties managed and estimated total revenue over the past year. Analyze their scale and performance metrics.
| Host Name | Properties | Grossing Revenue | Stay Reviews | Avg Rating |
|---|---|---|---|---|
| Alejandro | 8 | $9,251 | 271 | 4.57/5.0 |
| Juan Camilo | 2 | $4,772 | 21 | 4.86/5.0 |
| Aureliano | 6 | $2,256 | 172 | 4.67/5.0 |
| Marcela | 2 | $824 | 41 | 4.90/5.0 |
| Nolly | 1 | $526 | 65 | 4.83/5.0 |
| Yaneth | 4 | $334 | 11 | 4.22/5.0 |
| Juan David | 1 | $49 | 3 | 5.00/5.0 |
Analyzing the strategies of top hosts, such as their property selection, pricing, and guest communication, can offer valuable lessons for optimizing your own Airbnb operations in Aipe.
Dive Deeper: Advanced Aipe STR Market Data (2026)
Ready to unlock more insights? AirROI provides access to advanced metrics and comprehensive Airbnb data for Aipe. Explore detailed analytics beyond this report to refine your investment strategy, optimize pricing, and maximize your vacation rental profits.
Explore Advanced MetricsAipe Short-Term Rental Market Composition (2026): Property & Room Types
Room Type Distribution
Property Type Distribution
Market Composition Insights for Aipe
- The Aipe Airbnb market composition is heavily skewed towards Private Room listings, which make up 87.5% of the 24 active rentals. This indicates strong guest preference for privacy and space.
- Looking at the property type distribution in Aipe, Outdoor/Unique properties are the most common (41.7%), reflecting the local real estate landscape.
- Houses represent a significant 16.7% portion, catering likely to families or larger groups.
- The presence of 25% Hotel/Boutique listings indicates integration with traditional hospitality.
Aipe Airbnb Room Capacity Analysis (2026): Bedroom Distribution
Distribution of Listings by Number of Bedrooms
Room Capacity Insights for Aipe
- The dominant room capacity in Aipe is 1 bedroom listings, making up 50% of the market. This suggests a strong demand for properties suitable for couples or solo travelers.
- Together, 1 bedroom and 2 bedrooms properties represent 62.5% of the active Airbnb listings in Aipe, indicating a high concentration in these sizes.
Aipe Vacation Rental Guest Capacity Trends (2026)
Distribution of Listings by Guest Capacity
Guest Capacity Insights for Aipe
- The most common guest capacity trend in Aipe vacation rentals is listings accommodating 2 guests (58.3%). This suggests the primary traveler segment is likely couples or solo travelers.
- Properties designed for 2 guests and 6 guests dominate the Aipe STR market, accounting for 62.5% of listings.
- A significant 58.3% of listings cater specifically to 1-2 guests, highlighting strong demand from couples and solo travelers in Aipe.
- Listings for large groups (6+ guests) are relatively rare (4.2%), potentially indicating an opportunity for hosts targeting this segment in Aipe.
- On average, properties in Aipe are equipped to host 1.8 guests.
Aipe Airbnb Booking Patterns (2026): Available vs. Booked Days
Available Days Distribution
Booked Days Distribution
Booking Pattern Insights for Aipe
- The most common availability pattern in Aipe falls within the 271-366 days range, representing 100% of listings. This suggests many properties have significant open periods on their calendars.
- Approximately 100.0% of listings show high availability (181+ days open annually), indicating potential for increased bookings or specific owner usage patterns.
- For booked days, the 1-30 days range is most frequent in Aipe (79.2%), reflecting common guest stay durations or potential owner blocking patterns.
Aipe Airbnb Minimum Stay Requirements Analysis
Distribution of Listings by Minimum Night Requirement
1 Night
24 listings
100% of total
Key Insights
- The most prevalent minimum stay requirement in Aipe is 1 Night, adopted by 100% of listings. This highlights the market's preference for shorter, flexible bookings.
- A strong majority (100.0%) of the Aipe Airbnb data shows acceptance of very short stays (1-2 nights), indicating a dynamic, high-turnover market.
Recommendations
- Align with the market by considering a 1 Night minimum stay, as 100% of Aipe hosts use this setting.
- Adjust minimum nights based on seasonality – potentially shorter during low season and longer during peak demand periods in Aipe.
Aipe Airbnb Cancellation Policy Trends Analysis (2026)
Limited
2 listings
8.3% of total
Flexible
12 listings
50% of total
Moderate
8 listings
33.3% of total
Firm
2 listings
8.3% of total
Cancellation Policy Insights for Aipe
- The prevailing Airbnb cancellation policy trend in Aipe is Flexible, used by 50% of listings.
- The market strongly favors guest-friendly terms, with 83.3% of listings offering Flexible or Moderate policies. This suggests guests in Aipe may expect booking flexibility.
Recommendations for Hosts
- Consider adopting a Flexible policy to align with the 50% market standard in Aipe.
- Regularly review your cancellation policy against competitors and market demand shifts in Aipe.
Aipe STR Booking Lead Time Analysis (2026)
Average Booking Lead Time by Month
Booking Lead Time Insights for Aipe
- The overall average booking lead time for vacation rentals in Aipe is 19 days.
- Guests book furthest in advance for stays during September (average 55 days), likely coinciding with peak travel demand or local events.
- The shortest booking windows occur for stays in November (average 9 days), indicating more last-minute travel plans during this time.
- Seasonally, Summer (26 days avg.) sees the longest lead times, while Winter (19 days avg.) has the shortest, reflecting typical travel planning cycles.
Recommendations for Hosts
- Use the overall average lead time (19 days) as a baseline for your pricing and availability strategy in Aipe.
- For September stays, consider implementing length-of-stay discounts or slightly higher rates for bookings made less than 55 days out to capitalize on advance planning.
- During November, focus on last-minute booking availability and promotions, as guests book with very short notice (9 days avg.).
- Target marketing efforts for the Summer season well in advance (at least 26 days) to capture early planners.
- Monitor your own booking lead times against these Aipe averages to identify opportunities for dynamic pricing adjustments.
Popular & Essential Airbnb Amenities in Aipe (2026)
Amenity Prevalence
Amenity Insights for Aipe
- Popular amenities like Wifi, Pets allowed, Free parking on premises are common but not universal. Offering these can provide a competitive edge.
- A pool is a highly desired but not standard amenity, making it a key feature for attracting guests seeking leisure in Aipe.
- Warning: Wifi is not universally provided but is considered essential globally. Ensure reliable Wifi is offered.
Recommendations for Hosts
- Consider adding popular differentiators like Wifi or Pets allowed to increase appeal.
- Highlight unique or less common amenities you offer (e.g., hot tub, dedicated workspace, EV charger) in your listing description and photos.
- Regularly check competitor amenities in Aipe to stay competitive.
Aipe Airbnb Guest Demographics & Profile Analysis (2026)
Guest Profile Summary for Aipe
- The typical guest profile for Airbnb in Aipe consists of primarily domestic travelers (68%), often arriving from nearby Bogotá, typically belonging to the Post-2000s (Gen Z/Alpha) group (50%), primarily speaking Spanish or English.
- Domestic travelers account for 68.3% of guests.
- Key international markets include Colombia (68.3%) and France (12.2%).
- Top languages spoken are Spanish (44.4%) followed by English (33.3%).
- A significant demographic segment is the Post-2000s (Gen Z/Alpha) group, representing 50% of guests.
Recommendations for Hosts
- Target domestic marketing efforts towards travelers from Bogotá and Manizales.
- Tailor amenities and listing descriptions to appeal to the dominant Post-2000s (Gen Z/Alpha) demographic (e.g., highlight fast WiFi, smart home features, local guides).
- Highlight unique local experiences or amenities relevant to the primary guest profile.
- Consider seasonal promotions aligned with peak travel times for key origin markets.
Nearby Short-Term Rental Market Comparison
How does the Aipe Airbnb market stack up against its neighbors? Compare key performance metrics like average monthly revenue, ADR, and occupancy rates in surrounding areas to understand the broader regional STR landscape.
| Market | Active Properties | Monthly Revenue | Daily Rate | Avg. Occupancy |
|---|---|---|---|---|
| Anapoima | 286 | $1,775 | $279.24 | 26% |
| Apulo | 105 | $1,505 | $270.37 | 22% |
| Cundinamarca | 11 | $1,424 | $201.05 | 23% |
| La Buitrera | 15 | $1,161 | $146.95 | 26% |
| Nilo | 73 | $1,138 | $246.56 | 21% |
| El Imperio | 14 | $900 | $193.43 | 19% |
| Sasaima | 42 | $810 | $132.40 | 22% |
| Calima Lake | 18 | $775 | $217.48 | 16% |
| La Vega | 142 | $772 | $143.54 | 21% |
| Quimbaya | 193 | $756 | $133.90 | 24% |