Tunja Airbnb Market Analysis 2026: Short Term Rental Data & Vacation Rental Statistics in Boyacá, Colombia
Is Airbnb profitable in Tunja in 2026? Explore comprehensive Airbnb analytics for Tunja, Boyacá, Colombia to uncover income potential. This 2026 STR market report for Tunja, based on AirROI data from February 2025 to January 2026, reveals key trends in the niche market of 158 active listings.
Whether you're considering an Airbnb investment in Tunja, optimizing your existing vacation rental, or exploring rental arbitrage opportunities, understanding the Tunja Airbnb data is crucial. Navigating the high regulation landscape is key to maximizing your short term rental income potential. Let's dive into the specifics.
Key Tunja Airbnb Performance Metrics Overview
Monthly Airbnb Revenue Variations & Income Potential in Tunja (2026)
Understanding the monthly revenue variations for Airbnb listings in Tunja is key to maximizing your short term rental income potential. Seasonality significantly impacts earnings. Our analysis, based on data from the past 12 months, shows that the peak revenue month for STRs in Tunja is typically December, while January often presents the lowest earnings, highlighting opportunities for strategic pricing adjustments during shoulder and low seasons. Explore the typical Airbnb income in Tunja across different performance tiers:
- Best-in-class properties (Top 10%) achieve $677+ monthly, often utilizing dynamic pricing and superior guest experiences.
- Strong performing properties (Top 25%) earn $437 or more, indicating effective management and desirable locations/amenities.
- Typical properties (Median) generate around $248 per month, representing the average market performance.
- Entry-level properties (Bottom 25%) see earnings around $118, often with potential for optimization.
Average Monthly Airbnb Earnings Trend in Tunja
Tunja Airbnb Occupancy Rate Trends (2026)
Maximize your bookings by understanding the Tunja STR occupancy trends. Seasonal demand shifts significantly influence how often properties are booked. Typically, Marchsees the highest demand (peak season occupancy), while January experiences the lowest (low season). Effective strategies, like adjusting minimum stays or offering promotions, can boost occupancy during slower periods. Here's how different property tiers perform in Tunja:
- Best-in-class properties (Top 10%) achieve 69%+ occupancy, indicating high desirability and potentially optimized availability.
- Strong performing properties (Top 25%) maintain 49% or higher occupancy, suggesting good market fit and guest satisfaction.
- Typical properties (Median) have an occupancy rate around 27%.
- Entry-level properties (Bottom 25%) average 12% occupancy, potentially facing higher vacancy.
Average Monthly Occupancy Rate Trend in Tunja
Average Daily Rate (ADR) Airbnb Trends in Tunja (2026)
Effective short term rental pricing strategy in Tunja involves understanding monthly ADR fluctuations. The Average Daily Rate (ADR) for Airbnb in Tunja typically peaks in December and dips lowest during February. Leveraging Airbnb dynamic pricing tools or strategies based on this seasonality can significantly boost revenue. Here's a look at the typical nightly rates achieved:
- Best-in-class properties (Top 10%) command rates of $46+ per night, often due to premium features or locations.
- Strong performing properties (Top 25%) achieve nightly rates of $35 or more.
- Typical properties (Median) charge around $26 per night.
- Entry-level properties (Bottom 25%) earn around $21 per night.
Average Daily Rate (ADR) Trend by Month in Tunja
Get Live Tunja Market Intelligence 👇

Explore Real-time Analytics
Airbnb Seasonality Analysis & Trends in Tunja (2026)
Peak Season (December, March, October)
- Revenue averages $362 per month
- Occupancy rates average 36.7%
- Daily rates average $32
Shoulder Season
- Revenue averages $309 per month
- Occupancy maintains around 33.9%
- Daily rates hold near $30
Low Season (January, June, July)
- Revenue drops to average $269 per month
- Occupancy decreases to average 28.2%
- Daily rates adjust to average $31
Seasonality Insights for Tunja
- The Airbnb seasonality in Tunja shows moderate seasonality with distinct peak and low periods. While the sections above show seasonal averages, it's also insightful to look at the extremes:
- During the high season, the absolute peak month showcases Tunja's highest earning potential, with monthly revenues capable of climbing to $407, occupancy reaching a high of 39.6%, and ADRs peaking at $34.
- Conversely, the slowest single month of the year, typically falling within the low season, marks the market's lowest point. In this month, revenue might dip to $256, occupancy could drop to 25.9%, and ADRs may adjust down to $28.
- Understanding both the seasonal averages and these monthly peaks and troughs in revenue, occupancy, and ADR is crucial for maximizing your Airbnb profit potential in Tunja.
Seasonal Strategies for Maximizing Profit
- Peak Season: Maximize revenue through premium pricing and potentially longer minimum stays. Ensure high availability.
- Low Season: Offer competitive pricing, special promotions (e.g., extended stay discounts), and flexible cancellation policies. Target off-season travelers like remote workers or budget-conscious guests.
- Shoulder Seasons: Implement dynamic pricing that balances peak and low rates. Target weekend travelers or specific events. Offer slightly more flexible terms than peak season.
- Regularly analyze your own performance against these Tunja seasonality benchmarks and adjust your pricing and availability strategy accordingly.
Best Areas for Airbnb Investment in Tunja (2026)
Exploring the top neighborhoods for short-term rentals in Tunja? This section highlights key areas, outlining why they are attractive for hosts and guests, along with notable local attractions. Consider these locations based on your target guest profile and investment strategy.
| Neighborhood / Area | Why Host Here? (Target Guests & Appeal) | Key Attractions & Landmarks |
|---|---|---|
| Centro Histórico | The historic center of Tunja is rich in colonial architecture and historical landmarks. Tourists are drawn to its cultural significance and the proximity to key attractions like churches and plazas. | Puente de Boyacá, Catedral Basílica Metropolitana Metropolitana de Tunja, Plaza de Bolívar, Iglesia de San Francisco, Casa de la Cultura, Museo de Arte Moderno |
| Puente de Boyacá | A national monument and a key historical site known for the Battle of Boyacá, attracting history enthusiasts and tourists interested in Colombia's independence. | Puente de Boyacá, Monumento a los Héroes, Museo de la Batalla de Boyacá |
| Neguanje | An area known for its natural beauty and hiking trails. It's perfect for eco-tourism and attracts those who enjoy the outdoors and Colombia's biodiversity. | Parque Natural Chicaque, Senderos ecológicos, Miradores panorámicos |
| Parque del Chicamocha | A scenic park offering stunning views of the Chicamocha Canyon, popular for adventure tourism and outdoor activities like paragliding and hiking. | Chicamocha National Park, Cable Car, Canyoning, Paragliding |
| Tunja's Universities | With several universities, this area attracts students and young travelers, making it a great location for budget-friendly accommodations. | Universidad de Boyacá, Universidad Santo Tomás, Universidad de la Sabana |
| Catedral Basílica Metropolitana | A significant religious site and architectural landmark in Tunja, attracting visitors who appreciate historical buildings and religious tourism. | Catedral Basílica Metropolitana, Iglesia de San Francisco, Cultural events |
| Boyacá's Coffee Zone | This scenic region is known for coffee cultivation and beautiful landscapes, attracting tourists interested in agritourism and local culture. | Coffee plantations, Scenic views, Cultural experiences |
| Ráquira | A nearby town famous for its pottery and artisan crafts, drawing tourists interested in local culture and art. | Artisan workshops, Pottery market, Cultural festivals |
Understanding Airbnb License Requirements & STR Laws in Tunja (2026)
Yes, Tunja, Boyacá, Colombia enforces high STR regulations. Obtaining a license and ensuring compliance is almost certainly required according to current 2026 STR laws. Always verify the latest short term rental regulations and Airbnb license requirements directly with local government authorities for Tunja to ensure full compliance before hosting.
(Source: AirROI data, 2026, based on 92% licensed listings)
Top Performing Airbnb Properties in Tunja (2026)
Benchmark your potential! Explore examples of top-performing Airbnb properties in Tunjabased on Trailing Twelve Month (TTM) revenue. Analyze their characteristics, revenue, occupancy rate, and ADR to understand what drives success in this market.
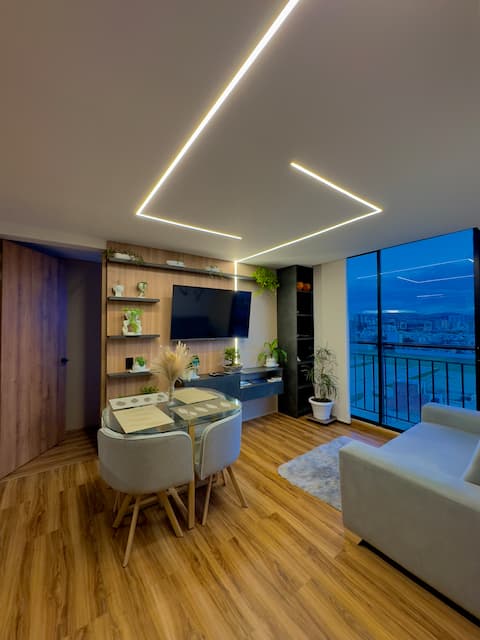
Amazing Apartment In Tunja
Entire Place • 2 bedrooms
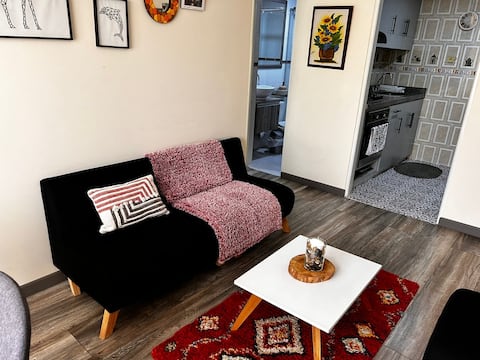
Valentina's Place
Entire Place • 2 bedrooms
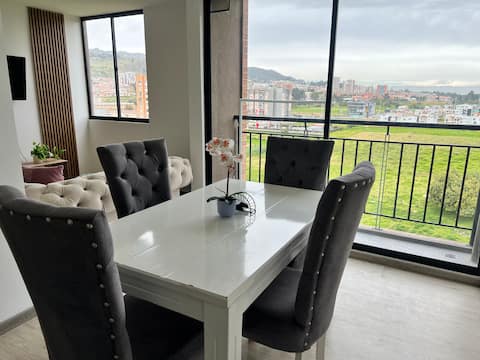
New apartment in front of the VIVA Shopping Center
Entire Place • 2 bedrooms

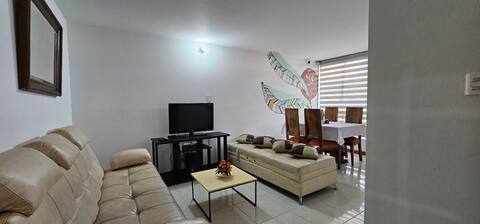
modern apartment in Tunja
Entire Place • 3 bedrooms
Entire House Downtown Tunja
Entire Place • 3 bedrooms

DENIS T. Vacation Apartment 3 bedrooms, 5 beds, 2 bathrooms.
Entire Place • 3 bedrooms
Note: Performance varies based on location, size, amenities, seasonality, and management quality. Data reflects the past 12 months.
Top Performing Airbnb Hosts in Tunja (2026)
Learn from the best! This table showcases top-performing Airbnb hosts in Tunja based on the number of properties managed and estimated total revenue over the past year. Analyze their scale and performance metrics.
| Host Name | Properties | Grossing Revenue | Stay Reviews | Avg Rating |
|---|---|---|---|---|
| Diana | 13 | $41,511 | 418 | 4.92/5.0 |
| Eliana | 7 | $22,619 | 106 | 4.69/5.0 |
| Deiner | 4 | $16,994 | 101 | 4.96/5.0 |
| Iván Darío | 9 | $11,084 | 53 | 4.83/5.0 |
| Harvey | 8 | $9,941 | 336 | 4.62/5.0 |
| Fanny | 1 | $9,019 | 84 | 4.98/5.0 |
| Ari | 1 | $8,551 | 57 | 4.74/5.0 |
| Gina | 1 | $8,513 | 26 | 4.96/5.0 |
| Wilson Eduardo | 1 | $8,197 | 141 | 4.96/5.0 |
| Laura | 3 | $7,905 | 106 | 4.81/5.0 |
Analyzing the strategies of top hosts, such as their property selection, pricing, and guest communication, can offer valuable lessons for optimizing your own Airbnb operations in Tunja.
Dive Deeper: Advanced Tunja STR Market Data (2026)
Ready to unlock more insights? AirROI provides access to advanced metrics and comprehensive Airbnb data for Tunja. Explore detailed analytics beyond this report to refine your investment strategy, optimize pricing, and maximize your vacation rental profits.
Explore Advanced MetricsTunja Short-Term Rental Market Composition (2026): Property & Room Types
Room Type Distribution
Property Type Distribution
Market Composition Insights for Tunja
- The Tunja Airbnb market composition is heavily skewed towards Entire Home/Apt listings, which make up 75.3% of the 158 active rentals. This indicates strong guest preference for privacy and space.
- Looking at the property type distribution in Tunja, Apartment/Condo properties are the most common (77.2%), reflecting the local real estate landscape.
- Houses represent a significant 15.8% portion, catering likely to families or larger groups.
- The presence of 7% Hotel/Boutique listings indicates integration with traditional hospitality.
Tunja Airbnb Room Capacity Analysis (2026): Bedroom Distribution
Distribution of Listings by Number of Bedrooms
Room Capacity Insights for Tunja
- The dominant room capacity in Tunja is 1 bedroom listings, making up 53.8% of the market. This suggests a strong demand for properties suitable for couples or solo travelers.
- Together, 1 bedroom and 2 bedrooms properties represent 69.6% of the active Airbnb listings in Tunja, indicating a high concentration in these sizes.
- With over half the market (53.8%) consisting of studios or 1-bedroom units, Tunja is particularly well-suited for individuals or couples.
Tunja Vacation Rental Guest Capacity Trends (2026)
Distribution of Listings by Guest Capacity
Guest Capacity Insights for Tunja
- The most common guest capacity trend in Tunja vacation rentals is listings accommodating 2 guests (34.8%). This suggests the primary traveler segment is likely couples or solo travelers.
- Properties designed for 2 guests and 4 guests dominate the Tunja STR market, accounting for 50.6% of listings.
- 13.3% of properties accommodate 6+ guests, serving the market segment for larger families or group travel in Tunja.
- On average, properties in Tunja are equipped to host 2.9 guests.
Tunja Airbnb Booking Patterns (2026): Available vs. Booked Days
Available Days Distribution
Booked Days Distribution
Booking Pattern Insights for Tunja
- The most common availability pattern in Tunja falls within the 271-366 days range, representing 68.4% of listings. This suggests many properties have significant open periods on their calendars.
- Approximately 92.5% of listings show high availability (181+ days open annually), indicating potential for increased bookings or specific owner usage patterns.
- For booked days, the 31-90 days range is most frequent in Tunja (39.2%), reflecting common guest stay durations or potential owner blocking patterns.
- A notable 8.2% of properties secure long booking periods (181+ days booked per year), highlighting successful long-term rental strategies or significant owner usage.
Tunja Airbnb Minimum Stay Requirements Analysis
Distribution of Listings by Minimum Night Requirement
1 Night
118 listings
74.7% of total
2 Nights
15 listings
9.5% of total
3 Nights
2 listings
1.3% of total
4-6 Nights
1 listings
0.6% of total
7-29 Nights
13 listings
8.2% of total
30+ Nights
9 listings
5.7% of total
Key Insights
- The most prevalent minimum stay requirement in Tunja is 1 Night, adopted by 74.7% of listings. This highlights the market's preference for shorter, flexible bookings.
- A strong majority (84.2%) of the Tunja Airbnb data shows acceptance of very short stays (1-2 nights), indicating a dynamic, high-turnover market.
Recommendations
- Align with the market by considering a 1 Night minimum stay, as 74.7% of Tunja hosts use this setting.
- Explore offering discounts for stays of 30+ nights to attract the 5.7% of the market seeking extended stays.
- Adjust minimum nights based on seasonality – potentially shorter during low season and longer during peak demand periods in Tunja.
Tunja Airbnb Cancellation Policy Trends Analysis (2026)
Limited
1 listings
0.6% of total
Flexible
112 listings
71.3% of total
Moderate
30 listings
19.1% of total
Firm
11 listings
7% of total
Strict
3 listings
1.9% of total
Cancellation Policy Insights for Tunja
- The prevailing Airbnb cancellation policy trend in Tunja is Flexible, used by 71.3% of listings.
- The market strongly favors guest-friendly terms, with 90.4% of listings offering Flexible or Moderate policies. This suggests guests in Tunja may expect booking flexibility.
- Strict cancellation policies are quite rare (1.9%), potentially making listings with this policy less competitive unless justified by high demand or property type.
Recommendations for Hosts
- Consider adopting a Flexible policy to align with the 71.3% market standard in Tunja.
- Given the high prevalence of Flexible policies (71.3%), offering this can enhance booking appeal, especially during shoulder seasons.
- Using a Strict policy might deter some guests, as only 1.9% of listings use it. Evaluate if potential revenue protection outweighs possible lower booking rates.
- Regularly review your cancellation policy against competitors and market demand shifts in Tunja.
Tunja STR Booking Lead Time Analysis (2026)
Average Booking Lead Time by Month
Booking Lead Time Insights for Tunja
- The overall average booking lead time for vacation rentals in Tunja is 13 days.
- Guests book furthest in advance for stays during September (average 18 days), likely coinciding with peak travel demand or local events.
- The shortest booking windows occur for stays in July (average 7 days), indicating more last-minute travel plans during this time.
- Seasonally, Fall (17 days avg.) sees the longest lead times, while Winter (10 days avg.) has the shortest, reflecting typical travel planning cycles.
Recommendations for Hosts
- Use the overall average lead time (13 days) as a baseline for your pricing and availability strategy in Tunja.
- Target marketing efforts for the Fall season well in advance (at least 17 days) to capture early planners.
- Monitor your own booking lead times against these Tunja averages to identify opportunities for dynamic pricing adjustments.
Popular & Essential Airbnb Amenities in Tunja (2026)
Amenity Prevalence
Amenity Insights for Tunja
- Essential amenities in Tunja that guests expect include: Wifi. Lacking these (this) could significantly impact bookings.
- Popular amenities like TV, Kitchen, Hot water are common but not universal. Offering these can provide a competitive edge.
Recommendations for Hosts
- Ensure your listing includes all essential amenities for Tunja: Wifi.
- Prioritize adding missing essentials: Wifi.
- Consider adding popular differentiators like TV or Kitchen to increase appeal.
- Highlight unique or less common amenities you offer (e.g., hot tub, dedicated workspace, EV charger) in your listing description and photos.
- Regularly check competitor amenities in Tunja to stay competitive.
Tunja Airbnb Guest Demographics & Profile Analysis (2026)
Guest Profile Summary for Tunja
- The typical guest profile for Airbnb in Tunja consists of primarily domestic travelers (83%), often arriving from nearby Bogotá, typically belonging to the Post-2000s (Gen Z/Alpha) group (50%), primarily speaking Spanish or English.
- Domestic travelers account for 82.6% of guests.
- Key international markets include Colombia (82.6%) and United States (6.1%).
- Top languages spoken are Spanish (57.5%) followed by English (31.2%).
- A significant demographic segment is the Post-2000s (Gen Z/Alpha) group, representing 50% of guests.
Recommendations for Hosts
- Target domestic marketing efforts towards travelers from Bogotá and Bogota.
- Tailor amenities and listing descriptions to appeal to the dominant Post-2000s (Gen Z/Alpha) demographic (e.g., highlight fast WiFi, smart home features, local guides).
- Highlight unique local experiences or amenities relevant to the primary guest profile.
- Consider seasonal promotions aligned with peak travel times for key origin markets.
Nearby Short-Term Rental Market Comparison
How does the Tunja Airbnb market stack up against its neighbors? Compare key performance metrics like average monthly revenue, ADR, and occupancy rates in surrounding areas to understand the broader regional STR landscape.
| Market | Active Properties | Monthly Revenue | Daily Rate | Avg. Occupancy |
|---|---|---|---|---|
| Anapoima | 286 | $1,775 | $279.24 | 26% |
| Apulo | 105 | $1,505 | $270.37 | 22% |
| Cundinamarca | 11 | $1,424 | $201.05 | 23% |
| Nilo | 73 | $1,138 | $246.56 | 21% |
| Quebradanegra | 22 | $977 | $189.40 | 16% |
| El Imperio | 14 | $900 | $193.43 | 19% |
| Villeta | 325 | $860 | $181.51 | 20% |
| Nimaima | 34 | $843 | $195.06 | 19% |
| Sasaima | 42 | $810 | $132.40 | 22% |
| Vergara | 11 | $773 | $106.11 | 25% |