Mont-Tremblant Airbnb Market Analysis 2026: Short Term Rental Data & Vacation Rental Statistics in Quebec, Canada
Is Airbnb profitable in Mont-Tremblant in 2026? Explore comprehensive Airbnb analytics for Mont-Tremblant, Quebec, Canada to uncover income potential. This 2026 STR market report for Mont-Tremblant, based on AirROI data from February 2025 to January 2026, reveals key trends in the bustling market of 1,082 active listings.
Whether you're considering an Airbnb investment in Mont-Tremblant, optimizing your existing vacation rental, or exploring rental arbitrage opportunities, understanding the Mont-Tremblant Airbnb data is crucial. Navigating the high regulation landscape is key to maximizing your short term rental income potential. Let's dive into the specifics.
Key Mont-Tremblant Airbnb Performance Metrics Overview
Monthly Airbnb Revenue Variations & Income Potential in Mont-Tremblant (2026)
Understanding the monthly revenue variations for Airbnb listings in Mont-Tremblant is key to maximizing your short term rental income potential. Seasonality significantly impacts earnings. Our analysis, based on data from the past 12 months, shows that the peak revenue month for STRs in Mont-Tremblant is typically December, while May often presents the lowest earnings, highlighting opportunities for strategic pricing adjustments during shoulder and low seasons. Explore the typical Airbnb income in Mont-Tremblant across different performance tiers:
- Best-in-class properties (Top 10%) achieve $7,004+ monthly, often utilizing dynamic pricing and superior guest experiences.
- Strong performing properties (Top 25%) earn $4,371 or more, indicating effective management and desirable locations/amenities.
- Typical properties (Median) generate around $2,476 per month, representing the average market performance.
- Entry-level properties (Bottom 25%) see earnings around $1,282, often with potential for optimization.
Average Monthly Airbnb Earnings Trend in Mont-Tremblant
Mont-Tremblant Airbnb Occupancy Rate Trends (2026)
Maximize your bookings by understanding the Mont-Tremblant STR occupancy trends. Seasonal demand shifts significantly influence how often properties are booked. Typically, Februarysees the highest demand (peak season occupancy), while November experiences the lowest (low season). Effective strategies, like adjusting minimum stays or offering promotions, can boost occupancy during slower periods. Here's how different property tiers perform in Mont-Tremblant:
- Best-in-class properties (Top 10%) achieve 71%+ occupancy, indicating high desirability and potentially optimized availability.
- Strong performing properties (Top 25%) maintain 54% or higher occupancy, suggesting good market fit and guest satisfaction.
- Typical properties (Median) have an occupancy rate around 36%.
- Entry-level properties (Bottom 25%) average 20% occupancy, potentially facing higher vacancy.
Average Monthly Occupancy Rate Trend in Mont-Tremblant
Average Daily Rate (ADR) Airbnb Trends in Mont-Tremblant (2026)
Effective short term rental pricing strategy in Mont-Tremblant involves understanding monthly ADR fluctuations. The Average Daily Rate (ADR) for Airbnb in Mont-Tremblant typically peaks in December and dips lowest during April. Leveraging Airbnb dynamic pricing tools or strategies based on this seasonality can significantly boost revenue. Here's a look at the typical nightly rates achieved:
- Best-in-class properties (Top 10%) command rates of $511+ per night, often due to premium features or locations.
- Strong performing properties (Top 25%) achieve nightly rates of $333 or more.
- Typical properties (Median) charge around $213 per night.
- Entry-level properties (Bottom 25%) earn around $143 per night.
Average Daily Rate (ADR) Trend by Month in Mont-Tremblant
Get Live Mont-Tremblant Market Intelligence 👇

Explore Real-time Analytics
Airbnb Seasonality Analysis & Trends in Mont-Tremblant (2026)
Peak Season (December, February, March)
- Revenue averages $5,586 per month
- Occupancy rates average 50.5%
- Daily rates average $330
Shoulder Season
- Revenue averages $3,315 per month
- Occupancy maintains around 38.9%
- Daily rates hold near $278
Low Season (April, May, November)
- Revenue drops to average $1,766 per month
- Occupancy decreases to average 25.9%
- Daily rates adjust to average $240
Seasonality Insights for Mont-Tremblant
- The Airbnb seasonality in Mont-Tremblant shows highly seasonal trends requiring careful strategy. While the sections above show seasonal averages, it's also insightful to look at the extremes:
- During the high season, the absolute peak month showcases Mont-Tremblant's highest earning potential, with monthly revenues capable of climbing to $5,901, occupancy reaching a high of 59.4%, and ADRs peaking at $382.
- Conversely, the slowest single month of the year, typically falling within the low season, marks the market's lowest point. In this month, revenue might dip to $1,699, occupancy could drop to 25.3%, and ADRs may adjust down to $232.
- Understanding both the seasonal averages and these monthly peaks and troughs in revenue, occupancy, and ADR is crucial for maximizing your Airbnb profit potential in Mont-Tremblant.
Seasonal Strategies for Maximizing Profit
- Peak Season: Maximize revenue through premium pricing and potentially longer minimum stays. Ensure high availability.
- Low Season: Offer competitive pricing, special promotions (e.g., extended stay discounts), and flexible cancellation policies. Target off-season travelers like remote workers or budget-conscious guests.
- Shoulder Seasons: Implement dynamic pricing that balances peak and low rates. Target weekend travelers or specific events. Offer slightly more flexible terms than peak season.
- Regularly analyze your own performance against these Mont-Tremblant seasonality benchmarks and adjust your pricing and availability strategy accordingly.
Best Areas for Airbnb Investment in Mont-Tremblant (2026)
Exploring the top neighborhoods for short-term rentals in Mont-Tremblant? This section highlights key areas, outlining why they are attractive for hosts and guests, along with notable local attractions. Consider these locations based on your target guest profile and investment strategy.
| Neighborhood / Area | Why Host Here? (Target Guests & Appeal) | Key Attractions & Landmarks |
|---|---|---|
| Mont Tremblant Village | The heart of Mont-Tremblant, offering easy access to ski slopes, hiking trails, and a vibrant atmosphere with restaurants, shops, and entertainment. Ideal for tourists year-round, from skiing in winter to biking in summer. | Mont Tremblant Ski Resort, Tremblant Pedestrian Village, Golf Le Geant, Lac Tremblant, Casino de Mont-Tremblant |
| Mont Blanc | Located near Mont Tremblant, Mont Blanc is another great ski area with a beautiful lake. It's less crowded and offers a more serene experience, ideal for families and those seeking nature. | Mont Blanc Ski Resort, Lac Mont Blanc, Hiking Trails, Scenic Views, Nature Walks |
| Saint-Jovite | A charming village close to Mont-Tremblant that offers a local feel with quaint shops and dining options. It provides a more laid-back atmosphere while still being conveniently close to the mountain. | Les Jardins de la Gare, Saint-Jovite Farmers Market, Parks and Green Spaces, Local Artisans Shops |
| Lac-Superieur | This area provides a more secluded experience with access to the wilderness and water activities. Perfect for those looking to escape the hustle and bustle and enjoy nature. | Parc National du Mont-Tremblant, Lac-Superieur Lake, Vast Natural Landscapes, Canoeing and Kayaking |
| Labelle | Located a bit further from the main attractions, Labelle is a peaceful area that offers a retreat-like atmosphere, great for those looking to unwind in nature. | Lac Labelle, Scenic Views, Hiking and Biking Trails, Local Wildlife |
| Saint-Donat | Known for its skiing and outdoor activities, Saint-Donat is a lovely area that attracts visitors looking for adventure and relaxation alike. | Mont de la Réserve, Lac Archambault, Skiing and Snowboarding, Hiking Trails |
| Nomining | A tranquil, less commercial area perfect for visitors wanting to experience nature and relaxation, ideal for families and couples. | Local Parks, Canoeing, Fishing Spots, Hiking Trails |
| Pareil | An increasingly popular area for travelers who want to be close to Mont-Tremblant but prefer a quieter setting while still having good access to the resort. | Access to the Laurentians, Nature Trails, Local Dining Options, Lake Access |
Understanding Airbnb License Requirements & STR Laws in Mont-Tremblant (2026)
Yes, Mont-Tremblant, Quebec, Canada enforces high STR regulations. Obtaining a license and ensuring compliance is almost certainly required according to current 2026 STR laws. Always verify the latest short term rental regulations and Airbnb license requirements directly with local government authorities for Mont-Tremblant to ensure full compliance before hosting.
(Source: AirROI data, 2026, based on 91% licensed listings)
Top Performing Airbnb Properties in Mont-Tremblant (2026)
Benchmark your potential! Explore examples of top-performing Airbnb properties in Mont-Tremblantbased on Trailing Twelve Month (TTM) revenue. Analyze their characteristics, revenue, occupancy rate, and ADR to understand what drives success in this market.
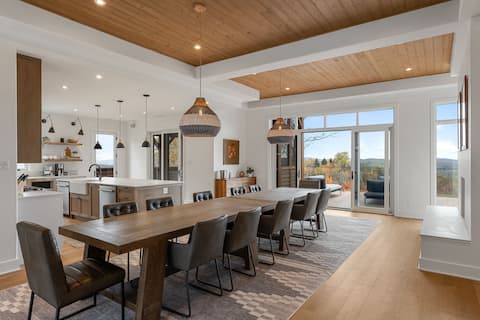
Villa Panorama | Heated Pool | Tremblant Living
Entire Place • 8 bedrooms
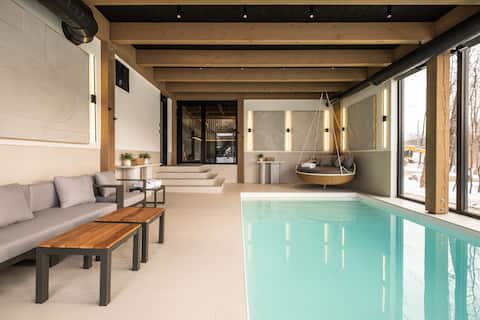
Lagom Evergreen | Indoor Pool | Tremblant Living
Entire Place • 7 bedrooms
Penthouse, 9 bdr ski in/out, steps to Village
Entire Place • 9 bedrooms

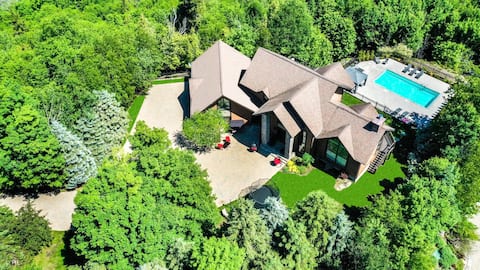
NEW! Villa Woodland | Tremblant Living
Entire Place • 7 bedrooms
“ The View”
Entire Place • 7 bedrooms
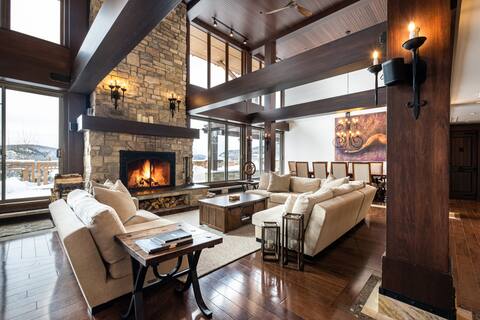
The Manor | Indoor Pool | Tremblant Living
Entire Place • 9 bedrooms
Note: Performance varies based on location, size, amenities, seasonality, and management quality. Data reflects the past 12 months.
Top Performing Airbnb Hosts in Mont-Tremblant (2026)
Learn from the best! This table showcases top-performing Airbnb hosts in Mont-Tremblant based on the number of properties managed and estimated total revenue over the past year. Analyze their scale and performance metrics.
| Host Name | Properties | Grossing Revenue | Stay Reviews | Avg Rating |
|---|---|---|---|---|
| David | 72 | $4,409,149 | 3581 | 4.97/5.0 |
| Ben & Alex | Tremblant Living | 30 | $3,629,838 | 320 | 4.97/5.0 |
| Suite Spot | 41 | $1,837,377 | 2628 | 4.86/5.0 |
| Property Valet Team | 30 | $1,653,177 | 964 | 4.89/5.0 |
| Kevin | 26 | $1,523,024 | 614 | 4.90/5.0 |
| Rendez-Vous Mont-Tremblant | 81 | $1,455,154 | 468 | 4.63/5.0 |
| Kōzē Stays | 32 | $854,255 | 2352 | 4.80/5.0 |
| Marieve | 15 | $762,225 | 1043 | 4.93/5.0 |
| Gabrielle | 15 | $567,468 | 341 | 4.89/5.0 |
| Guillaume & Michel | 20 | $527,041 | 1291 | 4.89/5.0 |
Analyzing the strategies of top hosts, such as their property selection, pricing, and guest communication, can offer valuable lessons for optimizing your own Airbnb operations in Mont-Tremblant.
Dive Deeper: Advanced Mont-Tremblant STR Market Data (2026)
Ready to unlock more insights? AirROI provides access to advanced metrics and comprehensive Airbnb data for Mont-Tremblant. Explore detailed analytics beyond this report to refine your investment strategy, optimize pricing, and maximize your vacation rental profits.
Explore Advanced MetricsMont-Tremblant Short-Term Rental Market Composition (2026): Property & Room Types
Room Type Distribution
Property Type Distribution
Market Composition Insights for Mont-Tremblant
- The Mont-Tremblant Airbnb market composition is heavily skewed towards Entire Home/Apt listings, which make up 96.2% of the 1,082 active rentals. This indicates strong guest preference for privacy and space.
- Looking at the property type distribution in Mont-Tremblant, Apartment/Condo properties are the most common (68.4%), reflecting the local real estate landscape.
- Houses represent a significant 27% portion, catering likely to families or larger groups.
- Smaller segments like hotel/boutique, outdoor/unique, others (combined 4.6%) offer potential for unique stay experiences.
Mont-Tremblant Airbnb Room Capacity Analysis (2026): Bedroom Distribution
Distribution of Listings by Number of Bedrooms
Room Capacity Insights for Mont-Tremblant
- The dominant room capacity in Mont-Tremblant is 2 bedrooms listings, making up 32.7% of the market. This suggests a strong demand for properties suitable for couples or solo travelers.
- Together, 2 bedrooms and 3 bedrooms properties represent 57.0% of the active Airbnb listings in Mont-Tremblant, indicating a high concentration in these sizes.
- A significant 42.0% of listings offer 3+ bedrooms, catering to larger groups and families seeking more space in Mont-Tremblant.
Mont-Tremblant Vacation Rental Guest Capacity Trends (2026)
Distribution of Listings by Guest Capacity
Guest Capacity Insights for Mont-Tremblant
- The most common guest capacity trend in Mont-Tremblant vacation rentals is listings accommodating 8+ guests (35.3%). This suggests the primary traveler segment is likely larger groups.
- Properties designed for 8+ guests and 6 guests dominate the Mont-Tremblant STR market, accounting for 61.4% of listings.
- 65.1% of properties accommodate 6+ guests, serving the market segment for larger families or group travel in Mont-Tremblant.
- On average, properties in Mont-Tremblant are equipped to host 5.9 guests.
Mont-Tremblant Airbnb Booking Patterns (2026): Available vs. Booked Days
Available Days Distribution
Booked Days Distribution
Booking Pattern Insights for Mont-Tremblant
- The most common availability pattern in Mont-Tremblant falls within the 181-270 days range, representing 43.8% of listings. This suggests many properties have significant open periods on their calendars.
- Approximately 85.3% of listings show high availability (181+ days open annually), indicating potential for increased bookings or specific owner usage patterns.
- For booked days, the 91-180 days range is most frequent in Mont-Tremblant (45.6%), reflecting common guest stay durations or potential owner blocking patterns.
- A notable 16.0% of properties secure long booking periods (181+ days booked per year), highlighting successful long-term rental strategies or significant owner usage.
Mont-Tremblant Airbnb Minimum Stay Requirements Analysis
Distribution of Listings by Minimum Night Requirement
1 Night
61 listings
5.6% of total
2 Nights
327 listings
30.2% of total
3 Nights
18 listings
1.7% of total
4-6 Nights
61 listings
5.6% of total
7-29 Nights
52 listings
4.8% of total
30+ Nights
563 listings
52% of total
Key Insights
- The most prevalent minimum stay requirement in Mont-Tremblant is 30+ Nights, adopted by 52% of listings. This highlights the market's preference for longer commitments.
- A significant segment (52%) caters to monthly stays (30+ nights) in Mont-Tremblant, pointing to opportunities in the extended-stay market.
Recommendations
- Align with the market by considering a 30+ Nights minimum stay, as 52% of Mont-Tremblant hosts use this setting.
- If feasible, allowing 1-night stays, especially midweek or during low season, could capture last-minute bookings, as only 5.6% currently do.
- A 2-night minimum appears standard (30.2%). Consider this for weekends or peak periods.
- Explore offering discounts for stays of 30+ nights to attract the 52% of the market seeking extended stays.
- Adjust minimum nights based on seasonality – potentially shorter during low season and longer during peak demand periods in Mont-Tremblant.
Mont-Tremblant Airbnb Cancellation Policy Trends Analysis (2026)
Super Strict 30 Days
31 listings
2.9% of total
Super Strict 60 Days
13 listings
1.2% of total
Non-refundable
1 listings
0.1% of total
Limited
139 listings
12.9% of total
Flexible
55 listings
5.1% of total
Moderate
284 listings
26.3% of total
Firm
468 listings
43.3% of total
Strict
90 listings
8.3% of total
Cancellation Policy Insights for Mont-Tremblant
- The prevailing Airbnb cancellation policy trend in Mont-Tremblant is Firm, used by 43.3% of listings.
- A majority (51.6%) of hosts in Mont-Tremblant utilize Firm or Strict policies, indicating a market where hosts prioritize booking security.
- Strict cancellation policies are quite rare (8.3%), potentially making listings with this policy less competitive unless justified by high demand or property type.
Recommendations for Hosts
- Consider adopting a Firm policy to align with the 43.3% market standard in Mont-Tremblant.
- Using a Strict policy might deter some guests, as only 8.3% of listings use it. Evaluate if potential revenue protection outweighs possible lower booking rates.
- Regularly review your cancellation policy against competitors and market demand shifts in Mont-Tremblant.
Mont-Tremblant STR Booking Lead Time Analysis (2026)
Average Booking Lead Time by Month
Booking Lead Time Insights for Mont-Tremblant
- The overall average booking lead time for vacation rentals in Mont-Tremblant is 55 days.
- Guests book furthest in advance for stays during December (average 80 days), likely coinciding with peak travel demand or local events.
- The shortest booking windows occur for stays in November (average 33 days), indicating more last-minute travel plans during this time.
- Seasonally, Winter (72 days avg.) sees the longest lead times, while Fall (38 days avg.) has the shortest, reflecting typical travel planning cycles.
Recommendations for Hosts
- Use the overall average lead time (55 days) as a baseline for your pricing and availability strategy in Mont-Tremblant.
- For December stays, consider implementing length-of-stay discounts or slightly higher rates for bookings made less than 80 days out to capitalize on advance planning.
- Target marketing efforts for the Winter season well in advance (at least 72 days) to capture early planners.
- Monitor your own booking lead times against these Mont-Tremblant averages to identify opportunities for dynamic pricing adjustments.
Popular & Essential Airbnb Amenities in Mont-Tremblant (2026)
Amenity Prevalence
Amenity Insights for Mont-Tremblant
- Essential amenities in Mont-Tremblant that guests expect include: Wifi, Free parking on premises, Smoke alarm, TV, Kitchen, Heating, Coffee maker. Lacking these (any) could significantly impact bookings.
- Popular amenities like Refrigerator, Microwave, Hot water are common but not universal. Offering these can provide a competitive edge.
Recommendations for Hosts
- Ensure your listing includes all essential amenities for Mont-Tremblant: Wifi, Free parking on premises, Smoke alarm, TV, Kitchen, Heating, Coffee maker.
- Prioritize adding missing essentials: Wifi, Free parking on premises, Smoke alarm, TV, Kitchen, Heating, Coffee maker.
- Consider adding popular differentiators like Refrigerator or Microwave to increase appeal.
- Highlight unique or less common amenities you offer (e.g., hot tub, dedicated workspace, EV charger) in your listing description and photos.
- Regularly check competitor amenities in Mont-Tremblant to stay competitive.
Mont-Tremblant Airbnb Guest Demographics & Profile Analysis (2026)
Guest Profile Summary for Mont-Tremblant
- The typical guest profile for Airbnb in Mont-Tremblant consists of primarily domestic travelers (68%), often arriving from nearby Ottawa, typically belonging to the Post-2000s (Gen Z/Alpha) group (50%), primarily speaking English or French.
- Domestic travelers account for 68.1% of guests.
- Key international markets include Canada (68.1%) and United States (22.8%).
- Top languages spoken are English (52.4%) followed by French (24.6%).
- A significant demographic segment is the Post-2000s (Gen Z/Alpha) group, representing 50% of guests.
Recommendations for Hosts
- Target domestic marketing efforts towards travelers from Ottawa and Montreal.
- Tailor amenities and listing descriptions to appeal to the dominant Post-2000s (Gen Z/Alpha) demographic (e.g., highlight fast WiFi, smart home features, local guides).
- Highlight unique local experiences or amenities relevant to the primary guest profile.
- Consider seasonal promotions aligned with peak travel times for key origin markets.
Nearby Short-Term Rental Market Comparison
How does the Mont-Tremblant Airbnb market stack up against its neighbors? Compare key performance metrics like average monthly revenue, ADR, and occupancy rates in surrounding areas to understand the broader regional STR landscape.
| Market | Active Properties | Monthly Revenue | Daily Rate | Avg. Occupancy |
|---|---|---|---|---|
| Mille-Isles | 89 | $5,219 | $472.25 | 38% |
| La Conception | 183 | $3,872 | $333.14 | 41% |
| Venise-en-Québec | 19 | $3,816 | $378.35 | 38% |
| Grenville-sur-la-Rouge | 31 | $3,795 | $381.21 | 39% |
| Cantley | 19 | $3,753 | $266.04 | 51% |
| Lac-Simon | 24 | $3,599 | $443.52 | 27% |
| Saint-Alphonse-Rodriguez | 35 | $3,249 | $305.90 | 44% |
| Val-des-Lacs | 47 | $3,139 | $347.66 | 34% |
| Val-des-Monts | 123 | $3,077 | $255.71 | 46% |
| Saint-Gabriel-de-Brandon | 10 | $3,020 | $261.69 | 39% |