Prince Edward Airbnb Market Analysis 2026: Short Term Rental Data & Vacation Rental Statistics in Ontario, Canada
Is Airbnb profitable in Prince Edward in 2026? Explore comprehensive Airbnb analytics for Prince Edward, Ontario, Canada to uncover income potential. This 2026 STR market report for Prince Edward, based on AirROI data from February 2025 to January 2026, reveals key trends in the market of 440 active listings.
Whether you're considering an Airbnb investment in Prince Edward, optimizing your existing vacation rental, or exploring rental arbitrage opportunities, understanding the Prince Edward Airbnb data is crucial. Navigating the high regulation landscape is key to maximizing your short term rental income potential. Let's dive into the specifics.
Key Prince Edward Airbnb Performance Metrics Overview
Monthly Airbnb Revenue Variations & Income Potential in Prince Edward (2026)
Understanding the monthly revenue variations for Airbnb listings in Prince Edward is key to maximizing your short term rental income potential. Seasonality significantly impacts earnings. Our analysis, based on data from the past 12 months, shows that the peak revenue month for STRs in Prince Edward is typically August, while February often presents the lowest earnings, highlighting opportunities for strategic pricing adjustments during shoulder and low seasons. Explore the typical Airbnb income in Prince Edward across different performance tiers:
- Best-in-class properties (Top 10%) achieve $8,489+ monthly, often utilizing dynamic pricing and superior guest experiences.
- Strong performing properties (Top 25%) earn $5,241 or more, indicating effective management and desirable locations/amenities.
- Typical properties (Median) generate around $2,991 per month, representing the average market performance.
- Entry-level properties (Bottom 25%) see earnings around $1,675, often with potential for optimization.
Average Monthly Airbnb Earnings Trend in Prince Edward
Prince Edward Airbnb Occupancy Rate Trends (2026)
Maximize your bookings by understanding the Prince Edward STR occupancy trends. Seasonal demand shifts significantly influence how often properties are booked. Typically, Augustsees the highest demand (peak season occupancy), while January experiences the lowest (low season). Effective strategies, like adjusting minimum stays or offering promotions, can boost occupancy during slower periods. Here's how different property tiers perform in Prince Edward:
- Best-in-class properties (Top 10%) achieve 73%+ occupancy, indicating high desirability and potentially optimized availability.
- Strong performing properties (Top 25%) maintain 54% or higher occupancy, suggesting good market fit and guest satisfaction.
- Typical properties (Median) have an occupancy rate around 37%.
- Entry-level properties (Bottom 25%) average 22% occupancy, potentially facing higher vacancy.
Average Monthly Occupancy Rate Trend in Prince Edward
Average Daily Rate (ADR) Airbnb Trends in Prince Edward (2026)
Effective short term rental pricing strategy in Prince Edward involves understanding monthly ADR fluctuations. The Average Daily Rate (ADR) for Airbnb in Prince Edward typically peaks in July and dips lowest during February. Leveraging Airbnb dynamic pricing tools or strategies based on this seasonality can significantly boost revenue. Here's a look at the typical nightly rates achieved:
- Best-in-class properties (Top 10%) command rates of $556+ per night, often due to premium features or locations.
- Strong performing properties (Top 25%) achieve nightly rates of $390 or more.
- Typical properties (Median) charge around $271 per night.
- Entry-level properties (Bottom 25%) earn around $186 per night.
Average Daily Rate (ADR) Trend by Month in Prince Edward
Get Live Prince Edward Market Intelligence 👇

Explore Real-time Analytics
Airbnb Seasonality Analysis & Trends in Prince Edward (2026)
Peak Season (August, July, June)
- Revenue averages $7,212 per month
- Occupancy rates average 63.0%
- Daily rates average $358
Shoulder Season
- Revenue averages $3,372 per month
- Occupancy maintains around 34.3%
- Daily rates hold near $319
Low Season (January, February, November)
- Revenue drops to average $2,219 per month
- Occupancy decreases to average 26.6%
- Daily rates adjust to average $305
Seasonality Insights for Prince Edward
- The Airbnb seasonality in Prince Edward shows highly seasonal trends requiring careful strategy. While the sections above show seasonal averages, it's also insightful to look at the extremes:
- During the high season, the absolute peak month showcases Prince Edward's highest earning potential, with monthly revenues capable of climbing to $8,583, occupancy reaching a high of 73.6%, and ADRs peaking at $363.
- Conversely, the slowest single month of the year, typically falling within the low season, marks the market's lowest point. In this month, revenue might dip to $1,998, occupancy could drop to 22.1%, and ADRs may adjust down to $302.
- Understanding both the seasonal averages and these monthly peaks and troughs in revenue, occupancy, and ADR is crucial for maximizing your Airbnb profit potential in Prince Edward.
Seasonal Strategies for Maximizing Profit
- Peak Season: Maximize revenue through premium pricing and potentially longer minimum stays. Ensure high availability.
- Low Season: Offer competitive pricing, special promotions (e.g., extended stay discounts), and flexible cancellation policies. Target off-season travelers like remote workers or budget-conscious guests.
- Shoulder Seasons: Implement dynamic pricing that balances peak and low rates. Target weekend travelers or specific events. Offer slightly more flexible terms than peak season.
- Regularly analyze your own performance against these Prince Edward seasonality benchmarks and adjust your pricing and availability strategy accordingly.
Best Areas for Airbnb Investment in Prince Edward (2026)
Exploring the top neighborhoods for short-term rentals in Prince Edward? This section highlights key areas, outlining why they are attractive for hosts and guests, along with notable local attractions. Consider these locations based on your target guest profile and investment strategy.
| Neighborhood / Area | Why Host Here? (Target Guests & Appeal) | Key Attractions & Landmarks |
|---|---|---|
| Picton | The largest town in Prince Edward County, Picton is a vibrant hub with excellent dining, shopping, and cultural events. It serves as the gateway to many local wineries and Picton Bay. | Picton Harbour, The Regent Theatre, Macaulay Heritage Park, Picton Main Street, Local wineries |
| Wellington | A charming community on the shores of Lake Ontario known for its laid-back vibe, Wellington attracts travelers for its beaches, wine tasting, and arts and culture scene. | Wellington Beach, Sandbanks Winery, The Wellington Gallery, Picton Bay, The Drake Devonshire Inn |
| Sandbanks Provincial Park | Famous for its stunning sandy beaches and unique sand dunes, Sandbanks Provincial Park draws visitors looking for outdoor activities such as swimming, hiking, and camping. | Sandbanks Beaches, Dune Trails, Lake Ontario views, Camping facilities, Bird watching |
| Bloomfield | A quaint village with a rich arts scene and proximity to many wineries, Bloomfield is popular among those seeking a quieter, rural getaway with local charm. | Bloomfield Main Street, Wineries, Picturesque countryside, Local markets, Arts and crafts shops |
| Ameliasburgh | A peaceful area offering a mix of nature and history, Ameliasburgh is ideal for those looking for a retreat with access to parks and heritage sites. | Ameliasburgh Heritage Village, Prince Edward County Fish Hatchery, Hiking trails, Parklands, Historical sites |
| County Road 1 | A scenic route known for its wineries, farm stands, and beautiful landscapes, perfect for those who enjoy a rural escape and outdoor activities. | Wineries, Farmers markets, Beautiful scenic views, Cycling opportunities, Nature trails |
| Cherry Valley | A small yet vibrant community, Cherry Valley is close to both Lake Ontario and several wineries, offering a wonderful balance of relaxation and exploration. | Local wineries, Natural landscapes, Cherry Valley Park, Cycling routes, Nearby beaches |
| North Marysburgh | Famous for its tranquil environment and stunning rural scenery, North Marysburgh is ideal for nature lovers and those looking for relaxation in a rural setting. | Eagle Point Beach, Lake景观, Cultural events, Great hiking spots, Local artisan shops |
Understanding Airbnb License Requirements & STR Laws in Prince Edward (2026)
Yes, Prince Edward, Ontario, Canada enforces high STR regulations. Obtaining a license and ensuring compliance is almost certainly required according to current 2026 STR laws. Always verify the latest short term rental regulations and Airbnb license requirements directly with local government authorities for Prince Edward to ensure full compliance before hosting.
(Source: AirROI data, 2026, based on 36% licensed listings)
Top Performing Airbnb Properties in Prince Edward (2026)
Benchmark your potential! Explore examples of top-performing Airbnb properties in Prince Edwardbased on Trailing Twelve Month (TTM) revenue. Analyze their characteristics, revenue, occupancy rate, and ADR to understand what drives success in this market.
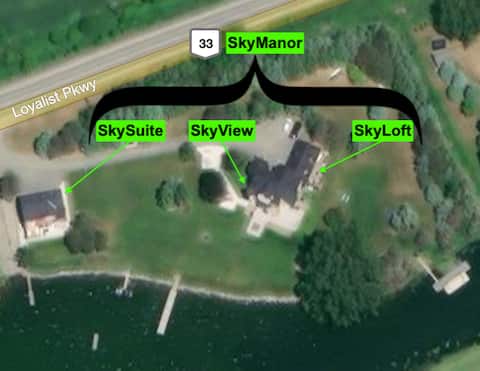
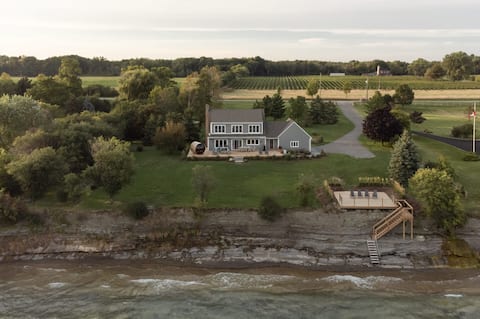
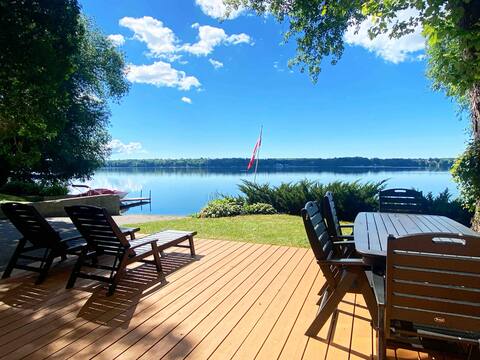
SkyManor on West Lake
Entire Place • 5 bedrooms

Welcome to Misfit Manor! w/ Pool & Hot Tub!
Entire Place • 4 bedrooms
The Hull House - Lake Ontario Waterfront w Sauna
Entire Place • 5 bedrooms

Cliffhouse on The Bay, Waterview Getaway with Pool
Entire Place • 8 bedrooms
2 Private, quiet lakefront cottages
Entire Place • 6 bedrooms

Luxurious farmhouse on Westlake Shore Sandbanks
Entire Place • 4 bedrooms
Note: Performance varies based on location, size, amenities, seasonality, and management quality. Data reflects the past 12 months.
Top Performing Airbnb Hosts in Prince Edward (2026)
Learn from the best! This table showcases top-performing Airbnb hosts in Prince Edward based on the number of properties managed and estimated total revenue over the past year. Analyze their scale and performance metrics.
| Host Name | Properties | Grossing Revenue | Stay Reviews | Avg Rating |
|---|---|---|---|---|
| Parker | 20 | $1,343,892 | 1206 | 4.94/5.0 |
| County Curated | 20 | $1,194,135 | 659 | 4.67/5.0 |
| Ashley | 17 | $419,063 | 562 | 4.77/5.0 |
| Saskia | 3 | $338,661 | 197 | 5.00/5.0 |
| Jessie | 3 | $320,618 | 281 | 4.86/5.0 |
| Ryan | 3 | $295,801 | 218 | 4.91/5.0 |
| Breathe Vacation Rentals | 4 | $274,121 | 257 | 4.79/5.0 |
| Marcy | 12 | $265,547 | 247 | 4.74/5.0 |
| Jonathan | 4 | $234,181 | 259 | 4.82/5.0 |
| Anna | 10 | $168,964 | 294 | 4.71/5.0 |
Analyzing the strategies of top hosts, such as their property selection, pricing, and guest communication, can offer valuable lessons for optimizing your own Airbnb operations in Prince Edward.
Dive Deeper: Advanced Prince Edward STR Market Data (2026)
Ready to unlock more insights? AirROI provides access to advanced metrics and comprehensive Airbnb data for Prince Edward. Explore detailed analytics beyond this report to refine your investment strategy, optimize pricing, and maximize your vacation rental profits.
Explore Advanced MetricsPrince Edward Short-Term Rental Market Composition (2026): Property & Room Types
Room Type Distribution
Property Type Distribution
Market Composition Insights for Prince Edward
- The Prince Edward Airbnb market composition is heavily skewed towards Entire Home/Apt listings, which make up 91.4% of the 440 active rentals. This indicates strong guest preference for privacy and space.
- Looking at the property type distribution in Prince Edward, House properties are the most common (68.4%), reflecting the local real estate landscape.
- Houses represent a significant 68.4% portion, catering likely to families or larger groups.
- The presence of 8% Hotel/Boutique listings indicates integration with traditional hospitality.
- Smaller segments like apartment/condo, unique stays (combined 5.4%) offer potential for unique stay experiences.
Prince Edward Airbnb Room Capacity Analysis (2026): Bedroom Distribution
Distribution of Listings by Number of Bedrooms
Room Capacity Insights for Prince Edward
- The dominant room capacity in Prince Edward is 3 bedrooms listings, making up 27.3% of the market. This suggests a strong demand for properties suitable for families or small groups.
- Together, 3 bedrooms and 2 bedrooms properties represent 53.2% of the active Airbnb listings in Prince Edward, indicating a high concentration in these sizes.
- A significant 51.6% of listings offer 3+ bedrooms, catering to larger groups and families seeking more space in Prince Edward.
Prince Edward Vacation Rental Guest Capacity Trends (2026)
Distribution of Listings by Guest Capacity
Guest Capacity Insights for Prince Edward
- The most common guest capacity trend in Prince Edward vacation rentals is listings accommodating 6 guests (30.2%). This suggests the primary traveler segment is likely larger groups.
- Properties designed for 6 guests and 8+ guests dominate the Prince Edward STR market, accounting for 55.4% of listings.
- 56.1% of properties accommodate 6+ guests, serving the market segment for larger families or group travel in Prince Edward.
- On average, properties in Prince Edward are equipped to host 5.2 guests.
Prince Edward Airbnb Booking Patterns (2026): Available vs. Booked Days
Available Days Distribution
Booked Days Distribution
Booking Pattern Insights for Prince Edward
- The most common availability pattern in Prince Edward falls within the 271-366 days range, representing 46.1% of listings. This suggests many properties have significant open periods on their calendars.
- Approximately 90.2% of listings show high availability (181+ days open annually), indicating potential for increased bookings or specific owner usage patterns.
- For booked days, the 91-180 days range is most frequent in Prince Edward (47.3%), reflecting common guest stay durations or potential owner blocking patterns.
- A notable 10.5% of properties secure long booking periods (181+ days booked per year), highlighting successful long-term rental strategies or significant owner usage.
Prince Edward Airbnb Minimum Stay Requirements Analysis
Distribution of Listings by Minimum Night Requirement
1 Night
32 listings
7.3% of total
2 Nights
143 listings
32.5% of total
3 Nights
20 listings
4.5% of total
4-6 Nights
19 listings
4.3% of total
7-29 Nights
1 listings
0.2% of total
30+ Nights
225 listings
51.1% of total
Key Insights
- The most prevalent minimum stay requirement in Prince Edward is 30+ Nights, adopted by 51.1% of listings. This highlights the market's preference for longer commitments.
- A significant segment (51.1%) caters to monthly stays (30+ nights) in Prince Edward, pointing to opportunities in the extended-stay market.
Recommendations
- Align with the market by considering a 30+ Nights minimum stay, as 51.1% of Prince Edward hosts use this setting.
- If feasible, allowing 1-night stays, especially midweek or during low season, could capture last-minute bookings, as only 7.3% currently do.
- A 2-night minimum appears standard (32.5%). Consider this for weekends or peak periods.
- Explore offering discounts for stays of 30+ nights to attract the 51.1% of the market seeking extended stays.
- Adjust minimum nights based on seasonality – potentially shorter during low season and longer during peak demand periods in Prince Edward.
Prince Edward Airbnb Cancellation Policy Trends Analysis (2026)
Super Strict 30 Days
18 listings
4.1% of total
Limited
25 listings
5.7% of total
Super Strict 60 Days
6 listings
1.4% of total
Flexible
50 listings
11.4% of total
Moderate
112 listings
25.5% of total
Firm
189 listings
43% of total
Strict
40 listings
9.1% of total
Cancellation Policy Insights for Prince Edward
- The prevailing Airbnb cancellation policy trend in Prince Edward is Firm, used by 43% of listings.
- A majority (52.1%) of hosts in Prince Edward utilize Firm or Strict policies, indicating a market where hosts prioritize booking security.
- Strict cancellation policies are quite rare (9.1%), potentially making listings with this policy less competitive unless justified by high demand or property type.
Recommendations for Hosts
- Consider adopting a Firm policy to align with the 43% market standard in Prince Edward.
- Using a Strict policy might deter some guests, as only 9.1% of listings use it. Evaluate if potential revenue protection outweighs possible lower booking rates.
- Regularly review your cancellation policy against competitors and market demand shifts in Prince Edward.
Prince Edward STR Booking Lead Time Analysis (2026)
Average Booking Lead Time by Month
Booking Lead Time Insights for Prince Edward
- The overall average booking lead time for vacation rentals in Prince Edward is 68 days.
- Guests book furthest in advance for stays during August (average 96 days), likely coinciding with peak travel demand or local events.
- The shortest booking windows occur for stays in February (average 28 days), indicating more last-minute travel plans during this time.
- Seasonally, Summer (89 days avg.) sees the longest lead times, while Winter (37 days avg.) has the shortest, reflecting typical travel planning cycles.
Recommendations for Hosts
- Use the overall average lead time (68 days) as a baseline for your pricing and availability strategy in Prince Edward.
- For August stays, consider implementing length-of-stay discounts or slightly higher rates for bookings made less than 96 days out to capitalize on advance planning.
- Target marketing efforts for the Summer season well in advance (at least 89 days) to capture early planners.
- Monitor your own booking lead times against these Prince Edward averages to identify opportunities for dynamic pricing adjustments.
Popular & Essential Airbnb Amenities in Prince Edward (2026)
Amenity Prevalence
Amenity Insights for Prince Edward
- Essential amenities in Prince Edward that guests expect include: Free parking on premises, Smoke alarm, Fire extinguisher, Wifi. Lacking these (any) could significantly impact bookings.
- Popular amenities like Heating, Coffee maker, Hot water are common but not universal. Offering these can provide a competitive edge.
Recommendations for Hosts
- Ensure your listing includes all essential amenities for Prince Edward: Free parking on premises, Smoke alarm, Fire extinguisher, Wifi.
- Prioritize adding missing essentials: Free parking on premises, Smoke alarm, Fire extinguisher, Wifi.
- Consider adding popular differentiators like Heating or Coffee maker to increase appeal.
- Highlight unique or less common amenities you offer (e.g., hot tub, dedicated workspace, EV charger) in your listing description and photos.
- Regularly check competitor amenities in Prince Edward to stay competitive.
Prince Edward Airbnb Guest Demographics & Profile Analysis (2026)
Guest Profile Summary for Prince Edward
- The typical guest profile for Airbnb in Prince Edward consists of primarily domestic travelers (92%), often arriving from nearby Toronto, typically belonging to the Post-2000s (Gen Z/Alpha) group (50%), primarily speaking English or French.
- Domestic travelers account for 91.8% of guests.
- Key international markets include Canada (91.8%) and United States (3.2%).
- Top languages spoken are English (55.7%) followed by French (26.3%).
- A significant demographic segment is the Post-2000s (Gen Z/Alpha) group, representing 50% of guests.
Recommendations for Hosts
- Target domestic marketing efforts towards travelers from Toronto and Ottawa.
- Tailor amenities and listing descriptions to appeal to the dominant Post-2000s (Gen Z/Alpha) demographic (e.g., highlight fast WiFi, smart home features, local guides).
- Highlight unique local experiences or amenities relevant to the primary guest profile.
- Consider seasonal promotions aligned with peak travel times for key origin markets.
Nearby Short-Term Rental Market Comparison
How does the Prince Edward Airbnb market stack up against its neighbors? Compare key performance metrics like average monthly revenue, ADR, and occupancy rates in surrounding areas to understand the broader regional STR landscape.
| Market | Active Properties | Monthly Revenue | Daily Rate | Avg. Occupancy |
|---|---|---|---|---|
| Town of Torrey | 34 | $5,535 | $437.35 | 50% |
| Rushville | 16 | $5,126 | $656.66 | 41% |
| Town of Mansfield | 61 | $4,782 | $517.31 | 32% |
| Town of Otisco | 22 | $4,749 | $417.83 | 43% |
| Town of Porter | 22 | $4,724 | $331.03 | 54% |
| Town of Canandaigua | 79 | $4,714 | $488.12 | 42% |
| Town of Fayette | 59 | $4,659 | $407.20 | 42% |
| Town of Skaneateles | 68 | $4,507 | $498.14 | 42% |
| Town of Varick | 34 | $4,385 | $447.56 | 43% |
| Town of Catharine | 12 | $4,308 | $488.11 | 40% |