Kawartha Lakes Airbnb Market Analysis 2026: Short Term Rental Data & Vacation Rental Statistics in Ontario, Canada
Is Airbnb profitable in Kawartha Lakes in 2026? Explore comprehensive Airbnb analytics for Kawartha Lakes, Ontario, Canada to uncover income potential. This 2026 STR market report for Kawartha Lakes, based on AirROI data from February 2025 to January 2026, reveals key trends in the market of 528 active listings.
Whether you're considering an Airbnb investment in Kawartha Lakes, optimizing your existing vacation rental, or exploring rental arbitrage opportunities, understanding the Kawartha Lakes Airbnb data is crucial. Leveraging the low regulation environment is key to maximizing your short term rental income potential. Let's dive into the specifics.
Key Kawartha Lakes Airbnb Performance Metrics Overview
Monthly Airbnb Revenue Variations & Income Potential in Kawartha Lakes (2026)
Understanding the monthly revenue variations for Airbnb listings in Kawartha Lakes is key to maximizing your short term rental income potential. Seasonality significantly impacts earnings. Our analysis, based on data from the past 12 months, shows that the peak revenue month for STRs in Kawartha Lakes is typically August, while February often presents the lowest earnings, highlighting opportunities for strategic pricing adjustments during shoulder and low seasons. Explore the typical Airbnb income in Kawartha Lakes across different performance tiers:
- Best-in-class properties (Top 10%) achieve $7,262+ monthly, often utilizing dynamic pricing and superior guest experiences.
- Strong performing properties (Top 25%) earn $4,667 or more, indicating effective management and desirable locations/amenities.
- Typical properties (Median) generate around $2,582 per month, representing the average market performance.
- Entry-level properties (Bottom 25%) see earnings around $1,176, often with potential for optimization.
Average Monthly Airbnb Earnings Trend in Kawartha Lakes
Kawartha Lakes Airbnb Occupancy Rate Trends (2026)
Maximize your bookings by understanding the Kawartha Lakes STR occupancy trends. Seasonal demand shifts significantly influence how often properties are booked. Typically, Augustsees the highest demand (peak season occupancy), while January experiences the lowest (low season). Effective strategies, like adjusting minimum stays or offering promotions, can boost occupancy during slower periods. Here's how different property tiers perform in Kawartha Lakes:
- Best-in-class properties (Top 10%) achieve 72%+ occupancy, indicating high desirability and potentially optimized availability.
- Strong performing properties (Top 25%) maintain 54% or higher occupancy, suggesting good market fit and guest satisfaction.
- Typical properties (Median) have an occupancy rate around 33%.
- Entry-level properties (Bottom 25%) average 16% occupancy, potentially facing higher vacancy.
Average Monthly Occupancy Rate Trend in Kawartha Lakes
Average Daily Rate (ADR) Airbnb Trends in Kawartha Lakes (2026)
Effective short term rental pricing strategy in Kawartha Lakes involves understanding monthly ADR fluctuations. The Average Daily Rate (ADR) for Airbnb in Kawartha Lakes typically peaks in August and dips lowest during March. Leveraging Airbnb dynamic pricing tools or strategies based on this seasonality can significantly boost revenue. Here's a look at the typical nightly rates achieved:
- Best-in-class properties (Top 10%) command rates of $493+ per night, often due to premium features or locations.
- Strong performing properties (Top 25%) achieve nightly rates of $344 or more.
- Typical properties (Median) charge around $250 per night.
- Entry-level properties (Bottom 25%) earn around $176 per night.
Average Daily Rate (ADR) Trend by Month in Kawartha Lakes
Get Live Kawartha Lakes Market Intelligence 👇

Explore Real-time Analytics
Airbnb Seasonality Analysis & Trends in Kawartha Lakes (2026)
Peak Season (August, July, June)
- Revenue averages $5,721 per month
- Occupancy rates average 51.2%
- Daily rates average $313
Shoulder Season
- Revenue averages $3,056 per month
- Occupancy maintains around 33.8%
- Daily rates hold near $288
Low Season (January, February, March)
- Revenue drops to average $2,144 per month
- Occupancy decreases to average 27.6%
- Daily rates adjust to average $275
Seasonality Insights for Kawartha Lakes
- The Airbnb seasonality in Kawartha Lakes shows highly seasonal trends requiring careful strategy. While the sections above show seasonal averages, it's also insightful to look at the extremes:
- During the high season, the absolute peak month showcases Kawartha Lakes's highest earning potential, with monthly revenues capable of climbing to $7,165, occupancy reaching a high of 61.7%, and ADRs peaking at $317.
- Conversely, the slowest single month of the year, typically falling within the low season, marks the market's lowest point. In this month, revenue might dip to $2,067, occupancy could drop to 23.8%, and ADRs may adjust down to $267.
- Understanding both the seasonal averages and these monthly peaks and troughs in revenue, occupancy, and ADR is crucial for maximizing your Airbnb profit potential in Kawartha Lakes.
Seasonal Strategies for Maximizing Profit
- Peak Season: Maximize revenue through premium pricing and potentially longer minimum stays. Ensure high availability.
- Low Season: Offer competitive pricing, special promotions (e.g., extended stay discounts), and flexible cancellation policies. Target off-season travelers like remote workers or budget-conscious guests.
- Shoulder Seasons: Implement dynamic pricing that balances peak and low rates. Target weekend travelers or specific events. Offer slightly more flexible terms than peak season.
- Regularly analyze your own performance against these Kawartha Lakes seasonality benchmarks and adjust your pricing and availability strategy accordingly.
Best Areas for Airbnb Investment in Kawartha Lakes (2026)
Exploring the top neighborhoods for short-term rentals in Kawartha Lakes? This section highlights key areas, outlining why they are attractive for hosts and guests, along with notable local attractions. Consider these locations based on your target guest profile and investment strategy.
| Neighborhood / Area | Why Host Here? (Target Guests & Appeal) | Key Attractions & Landmarks |
|---|---|---|
| Bobcaygeon | A picturesque village known for its beautiful lake views and charming downtown. Popular destination for tourists seeking outdoor activities like boating and fishing. | Sturgeon Lake, Kawartha Lakes Trail, Bon Echo Provincial Park, Bobcaygeon Public Library, Kawartha Dairy, Kawartha Lakes Arts Council |
| Lindsay | The largest town in Kawartha Lakes, featuring historical sites and a vibrant arts community. Great for visitors looking for a mix of culture, history, and shopping. | Lindsay Golf & Country Club, Olde Gaol Museum, Century Theatre, Victoria Rail Trail, Lindsay Farmers' Market, Pigeon River |
| Fenelon Falls | Known as the Jewel of the Kawarthas, this area is famous for its scenic waterfalls and water activities. Ideal for family trips and nature enthusiasts. | Fenelon Falls Waterfall, Sturgeon Lake, Lock 34, Victoria County Gaol Museum, Scenic boat tours, Fenelon Falls Community Centre |
| Cameron | Offers a serene environment with easy access to lakes and outdoor activities. Perfect for travelers looking for a peaceful retreat close to nature. | Cameron Lake, Cameron Golf Course, Balsam Lake Provincial Park, Cameron Penetanguishene Bay, Hiking Trails, Wildlife Viewing |
| Kirkfield | A small rural community with a close-knit feel, great for visitors wanting to experience local culture and calmness away from the city buzz. | Kirkfield Lift Lock, Kirkfield Community Centre, Fishing on the canal, Wildlife Parks, Historic Churches, Local Farmers' Markets |
| Little Britain | A quaint village known for its friendly atmosphere and beautiful lakeside views. Ideal for tourists wanting a relaxed getaway. | Little Britain Ecological Park, Lake Scugog, Community Events, Art in the Park, Boating and Canoeing, Fishing Spots |
| Oakwood | A charming small town with a strong sense of community and history. Offers a unique experience for tourists looking for something off the beaten path. | Oakwood Park, Heritage Sites, Local Crafters, Wildlife Tours, Outdoor Activities, Charming Cafes |
| Manilla | A peaceful and scenic area, great for those looking to enjoy nature and local hospitality. Ideal for weekend getaways and retreats. | Manilla Park, Scenic Drives, Nature Trails, Local Wineries, Fishing and Boating, Community Events |
Understanding Airbnb License Requirements & STR Laws in Kawartha Lakes (2026)
While Kawartha Lakes, Ontario, Canada currently shows low STR regulations, specific Airbnb license requirements might still exist or change. Always verify the latest short term rental regulations and Airbnb license requirements directly with local government authorities for Kawartha Lakes to ensure full compliance before hosting.
(Source: AirROI data, 2026, based on 0% licensed listings)
Top Performing Airbnb Properties in Kawartha Lakes (2026)
Benchmark your potential! Explore examples of top-performing Airbnb properties in Kawartha Lakesbased on Trailing Twelve Month (TTM) revenue. Analyze their characteristics, revenue, occupancy rate, and ADR to understand what drives success in this market.
Luxury Retreat with Pool, Spa & Nature Trails
Entire Place • 8 bedrooms
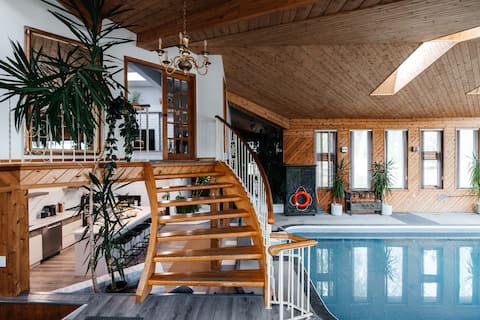
All Season Indoor Pool Escape
Entire Place • 4 bedrooms

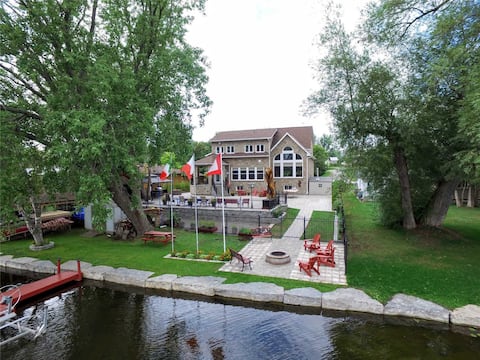
Kawartha Dream Cottage with Hot Tub w/ Games House
Entire Place • 5 bedrooms
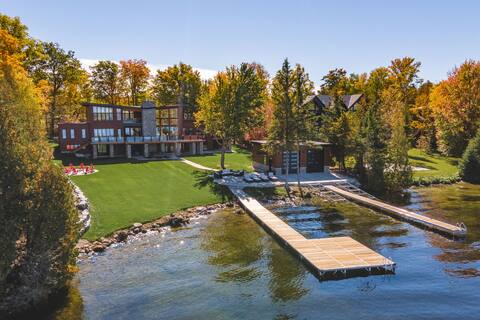
Luxury Lakefront Mansion With Inground Pool
Entire Place • 7 bedrooms

Bee’s Beach House: Luxe Sauna • Hot Tub • Beach
Entire Place • 5 bedrooms
Elyisum- Escape To Paradise
Entire Place • 8 bedrooms
Note: Performance varies based on location, size, amenities, seasonality, and management quality. Data reflects the past 12 months.
Top Performing Airbnb Hosts in Kawartha Lakes (2026)
Learn from the best! This table showcases top-performing Airbnb hosts in Kawartha Lakes based on the number of properties managed and estimated total revenue over the past year. Analyze their scale and performance metrics.
| Host Name | Properties | Grossing Revenue | Stay Reviews | Avg Rating |
|---|---|---|---|---|
| Olga | 1 | $344,956 | 79 | 4.99/5.0 |
| LakeFront Resorts | 26 | $290,823 | 375 | 4.21/5.0 |
| Travelluxe | 5 | $247,052 | 177 | 4.83/5.0 |
| Jakub MycottageStay | 4 | $197,530 | 319 | 4.76/5.0 |
| Sarah | 4 | $196,829 | 211 | 4.95/5.0 |
| CottageLINK Rental | 8 | $183,258 | 53 | 4.77/5.0 |
| Sophia Noreen | 1 | $171,946 | 54 | 4.98/5.0 |
| Parker | 2 | $161,209 | 284 | 4.95/5.0 |
| Paul | 6 | $156,881 | 131 | 4.87/5.0 |
| Lora | 5 | $154,806 | 200 | 4.92/5.0 |
Analyzing the strategies of top hosts, such as their property selection, pricing, and guest communication, can offer valuable lessons for optimizing your own Airbnb operations in Kawartha Lakes.
Dive Deeper: Advanced Kawartha Lakes STR Market Data (2026)
Ready to unlock more insights? AirROI provides access to advanced metrics and comprehensive Airbnb data for Kawartha Lakes. Explore detailed analytics beyond this report to refine your investment strategy, optimize pricing, and maximize your vacation rental profits.
Explore Advanced MetricsKawartha Lakes Short-Term Rental Market Composition (2026): Property & Room Types
Room Type Distribution
Property Type Distribution
Market Composition Insights for Kawartha Lakes
- The Kawartha Lakes Airbnb market composition is heavily skewed towards Entire Home/Apt listings, which make up 96.8% of the 528 active rentals. This indicates strong guest preference for privacy and space.
- Looking at the property type distribution in Kawartha Lakes, House properties are the most common (77.1%), reflecting the local real estate landscape.
- Houses represent a significant 77.1% portion, catering likely to families or larger groups.
- Smaller segments like hotel/boutique, apartment/condo, others, unique stays (combined 9.6%) offer potential for unique stay experiences.
Kawartha Lakes Airbnb Room Capacity Analysis (2026): Bedroom Distribution
Distribution of Listings by Number of Bedrooms
Room Capacity Insights for Kawartha Lakes
- The dominant room capacity in Kawartha Lakes is 3 bedrooms listings, making up 33.9% of the market. This suggests a strong demand for properties suitable for families or small groups.
- Together, 3 bedrooms and 2 bedrooms properties represent 53.8% of the active Airbnb listings in Kawartha Lakes, indicating a high concentration in these sizes.
- A significant 66.8% of listings offer 3+ bedrooms, catering to larger groups and families seeking more space in Kawartha Lakes.
Kawartha Lakes Vacation Rental Guest Capacity Trends (2026)
Distribution of Listings by Guest Capacity
Guest Capacity Insights for Kawartha Lakes
- The most common guest capacity trend in Kawartha Lakes vacation rentals is listings accommodating 8+ guests (41.1%). This suggests the primary traveler segment is likely larger groups.
- Properties designed for 8+ guests and 6 guests dominate the Kawartha Lakes STR market, accounting for 66.9% of listings.
- 70.5% of properties accommodate 6+ guests, serving the market segment for larger families or group travel in Kawartha Lakes.
- On average, properties in Kawartha Lakes are equipped to host 6.1 guests.
Kawartha Lakes Airbnb Booking Patterns (2026): Available vs. Booked Days
Available Days Distribution
Booked Days Distribution
Booking Pattern Insights for Kawartha Lakes
- The most common availability pattern in Kawartha Lakes falls within the 271-366 days range, representing 61.2% of listings. This suggests many properties have significant open periods on their calendars.
- Approximately 90.7% of listings show high availability (181+ days open annually), indicating potential for increased bookings or specific owner usage patterns.
- For booked days, the 31-90 days range is most frequent in Kawartha Lakes (36%), reflecting common guest stay durations or potential owner blocking patterns.
- A notable 9.8% of properties secure long booking periods (181+ days booked per year), highlighting successful long-term rental strategies or significant owner usage.
Kawartha Lakes Airbnb Minimum Stay Requirements Analysis
Distribution of Listings by Minimum Night Requirement
1 Night
96 listings
18.2% of total
2 Nights
157 listings
29.7% of total
3 Nights
25 listings
4.7% of total
4-6 Nights
20 listings
3.8% of total
7-29 Nights
21 listings
4% of total
30+ Nights
209 listings
39.6% of total
Key Insights
- The most prevalent minimum stay requirement in Kawartha Lakes is 30+ Nights, adopted by 39.6% of listings. This highlights the market's preference for longer commitments.
- A significant segment (39.6%) caters to monthly stays (30+ nights) in Kawartha Lakes, pointing to opportunities in the extended-stay market.
Recommendations
- Align with the market by considering a 30+ Nights minimum stay, as 39.6% of Kawartha Lakes hosts use this setting.
- If feasible, allowing 1-night stays, especially midweek or during low season, could capture last-minute bookings, as only 18.2% currently do.
- Explore offering discounts for stays of 30+ nights to attract the 39.6% of the market seeking extended stays.
- Adjust minimum nights based on seasonality – potentially shorter during low season and longer during peak demand periods in Kawartha Lakes.
Kawartha Lakes Airbnb Cancellation Policy Trends Analysis (2026)
Super Strict 60 Days
17 listings
3.2% of total
Super Strict 30 Days
10 listings
1.9% of total
Refundable
1 listings
0.2% of total
Limited
19 listings
3.6% of total
Flexible
92 listings
17.5% of total
Moderate
106 listings
20.1% of total
Firm
235 listings
44.6% of total
Strict
47 listings
8.9% of total
Cancellation Policy Insights for Kawartha Lakes
- The prevailing Airbnb cancellation policy trend in Kawartha Lakes is Firm, used by 44.6% of listings.
- A majority (53.5%) of hosts in Kawartha Lakes utilize Firm or Strict policies, indicating a market where hosts prioritize booking security.
- Strict cancellation policies are quite rare (8.9%), potentially making listings with this policy less competitive unless justified by high demand or property type.
Recommendations for Hosts
- Consider adopting a Firm policy to align with the 44.6% market standard in Kawartha Lakes.
- Using a Strict policy might deter some guests, as only 8.9% of listings use it. Evaluate if potential revenue protection outweighs possible lower booking rates.
- Regularly review your cancellation policy against competitors and market demand shifts in Kawartha Lakes.
Kawartha Lakes STR Booking Lead Time Analysis (2026)
Average Booking Lead Time by Month
Booking Lead Time Insights for Kawartha Lakes
- The overall average booking lead time for vacation rentals in Kawartha Lakes is 61 days.
- Guests book furthest in advance for stays during August (average 91 days), likely coinciding with peak travel demand or local events.
- The shortest booking windows occur for stays in February (average 29 days), indicating more last-minute travel plans during this time.
- Seasonally, Summer (81 days avg.) sees the longest lead times, while Winter (33 days avg.) has the shortest, reflecting typical travel planning cycles.
Recommendations for Hosts
- Use the overall average lead time (61 days) as a baseline for your pricing and availability strategy in Kawartha Lakes.
- For August stays, consider implementing length-of-stay discounts or slightly higher rates for bookings made less than 91 days out to capitalize on advance planning.
- Target marketing efforts for the Summer season well in advance (at least 81 days) to capture early planners.
- Monitor your own booking lead times against these Kawartha Lakes averages to identify opportunities for dynamic pricing adjustments.
Popular & Essential Airbnb Amenities in Kawartha Lakes (2026)
Amenity Prevalence
Amenity Insights for Kawartha Lakes
- Essential amenities in Kawartha Lakes that guests expect include: Free parking on premises, Smoke alarm. Lacking these (any) could significantly impact bookings.
- Popular amenities like Kitchen, Hot water, Dishes and silverware are common but not universal. Offering these can provide a competitive edge.
- Warning: Wifi is not universally provided but is considered essential globally. Ensure reliable Wifi is offered.
Recommendations for Hosts
- Ensure your listing includes all essential amenities for Kawartha Lakes: Free parking on premises, Smoke alarm.
- Prioritize adding missing essentials: Free parking on premises, Smoke alarm.
- Consider adding popular differentiators like Kitchen or Hot water to increase appeal.
- Highlight unique or less common amenities you offer (e.g., hot tub, dedicated workspace, EV charger) in your listing description and photos.
- Regularly check competitor amenities in Kawartha Lakes to stay competitive.
Kawartha Lakes Airbnb Guest Demographics & Profile Analysis (2026)
Guest Profile Summary for Kawartha Lakes
- The typical guest profile for Airbnb in Kawartha Lakes consists of primarily domestic travelers (91%), often arriving from nearby Toronto, typically belonging to the Post-2000s (Gen Z/Alpha) group (50%), primarily speaking English or French.
- Domestic travelers account for 91.3% of guests.
- Key international markets include Canada (91.3%) and United States (4.1%).
- Top languages spoken are English (65.4%) followed by French (8.9%).
- A significant demographic segment is the Post-2000s (Gen Z/Alpha) group, representing 50% of guests.
Recommendations for Hosts
- Target domestic marketing efforts towards travelers from Toronto and Mississauga.
- Tailor amenities and listing descriptions to appeal to the dominant Post-2000s (Gen Z/Alpha) demographic (e.g., highlight fast WiFi, smart home features, local guides).
- Highlight unique local experiences or amenities relevant to the primary guest profile.
- Consider seasonal promotions aligned with peak travel times for key origin markets.
Nearby Short-Term Rental Market Comparison
How does the Kawartha Lakes Airbnb market stack up against its neighbors? Compare key performance metrics like average monthly revenue, ADR, and occupancy rates in surrounding areas to understand the broader regional STR landscape.
| Market | Active Properties | Monthly Revenue | Daily Rate | Avg. Occupancy |
|---|---|---|---|---|
| Town of Porter | 22 | $4,724 | $331.03 | 54% |
| McMurrich/Monteith Township | 26 | $4,491 | $414.28 | 39% |
| South River | 10 | $3,616 | $500.07 | 44% |
| Rossmore | 10 | $3,551 | $269.66 | 59% |
| Trent Lakes | 167 | $3,466 | $371.96 | 41% |
| Lake of Bays | 21 | $3,363 | $355.57 | 42% |
| Town of Greece | 28 | $3,322 | $306.33 | 41% |
| Consecon | 28 | $3,280 | $325.70 | 42% |
| Niagara-on-the-Lake | 441 | $3,266 | $287.63 | 43% |
| Town of Webster | 12 | $3,256 | $330.26 | 48% |