Beckwith Airbnb Market Analysis 2026: Short Term Rental Data & Vacation Rental Statistics in Ontario, Canada
Is Airbnb profitable in Beckwith in 2026? Explore comprehensive Airbnb analytics for Beckwith, Ontario, Canada to uncover income potential. This 2026 STR market report for Beckwith, based on AirROI data from February 2025 to January 2026, reveals key trends in the niche market of 21 active listings.
Whether you're considering an Airbnb investment in Beckwith, optimizing your existing vacation rental, or exploring rental arbitrage opportunities, understanding the Beckwith Airbnb data is crucial. Leveraging the low regulation environment is key to maximizing your short term rental income potential. Let's dive into the specifics.
Key Beckwith Airbnb Performance Metrics Overview
Monthly Airbnb Revenue Variations & Income Potential in Beckwith (2026)
Understanding the monthly revenue variations for Airbnb listings in Beckwith is key to maximizing your short term rental income potential. Seasonality significantly impacts earnings. Our analysis, based on data from the past 12 months, shows that the peak revenue month for STRs in Beckwith is typically July, while February often presents the lowest earnings, highlighting opportunities for strategic pricing adjustments during shoulder and low seasons. Explore the typical Airbnb income in Beckwith across different performance tiers:
- Best-in-class properties (Top 10%) achieve $5,484+ monthly, often utilizing dynamic pricing and superior guest experiences.
- Strong performing properties (Top 25%) earn $3,496 or more, indicating effective management and desirable locations/amenities.
- Typical properties (Median) generate around $2,199 per month, representing the average market performance.
- Entry-level properties (Bottom 25%) see earnings around $1,073, often with potential for optimization.
Average Monthly Airbnb Earnings Trend in Beckwith
Beckwith Airbnb Occupancy Rate Trends (2026)
Maximize your bookings by understanding the Beckwith STR occupancy trends. Seasonal demand shifts significantly influence how often properties are booked. Typically, Augustsees the highest demand (peak season occupancy), while February experiences the lowest (low season). Effective strategies, like adjusting minimum stays or offering promotions, can boost occupancy during slower periods. Here's how different property tiers perform in Beckwith:
- Best-in-class properties (Top 10%) achieve 58%+ occupancy, indicating high desirability and potentially optimized availability.
- Strong performing properties (Top 25%) maintain 41% or higher occupancy, suggesting good market fit and guest satisfaction.
- Typical properties (Median) have an occupancy rate around 27%.
- Entry-level properties (Bottom 25%) average 16% occupancy, potentially facing higher vacancy.
Average Monthly Occupancy Rate Trend in Beckwith
Average Daily Rate (ADR) Airbnb Trends in Beckwith (2026)
Effective short term rental pricing strategy in Beckwith involves understanding monthly ADR fluctuations. The Average Daily Rate (ADR) for Airbnb in Beckwith typically peaks in August and dips lowest during April. Leveraging Airbnb dynamic pricing tools or strategies based on this seasonality can significantly boost revenue. Here's a look at the typical nightly rates achieved:
- Best-in-class properties (Top 10%) command rates of $307+ per night, often due to premium features or locations.
- Strong performing properties (Top 25%) achieve nightly rates of $278 or more.
- Typical properties (Median) charge around $228 per night.
- Entry-level properties (Bottom 25%) earn around $178 per night.
Average Daily Rate (ADR) Trend by Month in Beckwith
Get Live Beckwith Market Intelligence 👇

Explore Real-time Analytics
Airbnb Seasonality Analysis & Trends in Beckwith (2026)
Peak Season (July, August, June)
- Revenue averages $4,445 per month
- Occupancy rates average 50.3%
- Daily rates average $247
Shoulder Season
- Revenue averages $2,601 per month
- Occupancy maintains around 31.0%
- Daily rates hold near $227
Low Season (January, February, November)
- Revenue drops to average $1,435 per month
- Occupancy decreases to average 15.1%
- Daily rates adjust to average $227
Seasonality Insights for Beckwith
- The Airbnb seasonality in Beckwith shows highly seasonal trends requiring careful strategy. While the sections above show seasonal averages, it's also insightful to look at the extremes:
- During the high season, the absolute peak month showcases Beckwith's highest earning potential, with monthly revenues capable of climbing to $5,213, occupancy reaching a high of 57.7%, and ADRs peaking at $248.
- Conversely, the slowest single month of the year, typically falling within the low season, marks the market's lowest point. In this month, revenue might dip to $634, occupancy could drop to 8.3%, and ADRs may adjust down to $213.
- Understanding both the seasonal averages and these monthly peaks and troughs in revenue, occupancy, and ADR is crucial for maximizing your Airbnb profit potential in Beckwith.
Seasonal Strategies for Maximizing Profit
- Peak Season: Maximize revenue through premium pricing and potentially longer minimum stays. Ensure high availability.
- Low Season: Offer competitive pricing, special promotions (e.g., extended stay discounts), and flexible cancellation policies. Target off-season travelers like remote workers or budget-conscious guests.
- Shoulder Seasons: Implement dynamic pricing that balances peak and low rates. Target weekend travelers or specific events. Offer slightly more flexible terms than peak season.
- Regularly analyze your own performance against these Beckwith seasonality benchmarks and adjust your pricing and availability strategy accordingly.
Best Areas for Airbnb Investment in Beckwith (2026)
Exploring the top neighborhoods for short-term rentals in Beckwith? This section highlights key areas, outlining why they are attractive for hosts and guests, along with notable local attractions. Consider these locations based on your target guest profile and investment strategy.
| Neighborhood / Area | Why Host Here? (Target Guests & Appeal) | Key Attractions & Landmarks |
|---|---|---|
| Carleton Place | A charming town with a historic downtown area and picturesque waterfront along the Mississippi River. Attracts visitors looking for a quaint setting and outdoor activities. | Mississippi River, Carleton Place Historical Society, Carleton Place Farmers Market, The Dance Academy of Carleton Place, The Carleton Place Town Hall |
| Almonte | Known for its vibrant arts community and beautiful landscapes. It attracts visitors interested in arts, history, and outdoor activities. | Almonte wall murals, Millstone Chiropractic, The Old Town Hall |
| Ottawa | The capital city of Canada with numerous national attractions, such as museums and historic sites. It draws tourists year-round for various events and activities. | Parliament Hill, National Gallery of Canada, Rideau Canal, ByWard Market, Canadian Museum of History |
| Smiths Falls | Home to the Rideau Canal and several historical sites. It's a great spot for those looking to explore the waterways and history of Canada. | Rideau Canal, Heritage House Museum, Smiths Falls Railway Museum, Lower Reach Park |
| Perth | A historic town with stunning architecture and scenic parks. Popular for getaway trips and local festivals, making it attractive for short-term stays. | Perth Museum, Stewart Park, The Ahmic Lake, Perth Farmers' Market |
| Merrickville | A picturesque village along the Rideau Canal with charming shops and historical significance. It's perfect for those seeking a tranquil escape. | Rideau Canal, Merrickville Blockhouse, Merrickville Historic District, Merrickville Gallery |
| Kemptville | This growing community has a blend of rural charm and suburban amenities, attracting visitors for events and outdoor activities. | Kemptville College, North Grenville's Heritage, Kemptville Farmers Market |
| Lanark | Surrounded by beautiful nature and outdoor recreational opportunities. It's a peaceful retreat for nature lovers and adventure seekers. | Lanark County Trails, Mississippi RiverWalking Trail, The Lanark Village |
Understanding Airbnb License Requirements & STR Laws in Beckwith (2026)
While Beckwith, Ontario, Canada currently shows low STR regulations, specific Airbnb license requirements might still exist or change. Always verify the latest short term rental regulations and Airbnb license requirements directly with local government authorities for Beckwith to ensure full compliance before hosting.
(Source: AirROI data, 2026, finding no licensed listings among those analyzed)
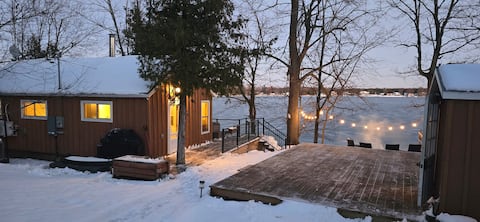
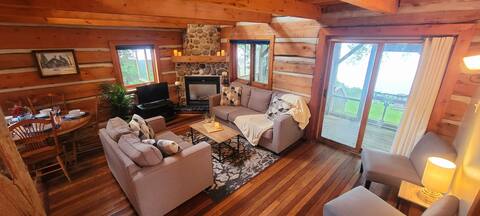
Top Performing Airbnb Properties in Beckwith (2026)
Benchmark your potential! Explore examples of top-performing Airbnb properties in Beckwithbased on Trailing Twelve Month (TTM) revenue. Analyze their characteristics, revenue, occupancy rate, and ADR to understand what drives success in this market.

Mississippi Lake House
Entire Place • 4 bedrooms

Beautiful Chalet on the Lake
Entire Place • 5 bedrooms

Ultimate Gamers Retreat, Arcade, pool & Hot Tubs
Entire Place • 2 bedrooms
Waterfront Cabin w/ Hot Tub
Entire Place • 3 bedrooms
Canadian Classic Waterfront Cottage
Entire Place • 2 bedrooms

7th Heaven Waterfront Cottage on Mississippi Lake
Entire Place • 4 bedrooms
Note: Performance varies based on location, size, amenities, seasonality, and management quality. Data reflects the past 12 months.
Top Performing Airbnb Hosts in Beckwith (2026)
Learn from the best! This table showcases top-performing Airbnb hosts in Beckwith based on the number of properties managed and estimated total revenue over the past year. Analyze their scale and performance metrics.
| Host Name | Properties | Grossing Revenue | Stay Reviews | Avg Rating |
|---|---|---|---|---|
| Jan Property Management & Ren | 9 | $226,246 | 582 | 4.77/5.0 |
| Ashley | 1 | $75,938 | 30 | 4.93/5.0 |
| Scott | 1 | $38,081 | 104 | 4.89/5.0 |
| Kev And Val | 1 | $33,693 | 41 | 4.95/5.0 |
| Erin & Sadiq | 1 | $29,849 | 296 | 4.93/5.0 |
| Tracy | 1 | $22,963 | 38 | 4.92/5.0 |
| Henry | 1 | $19,922 | 11 | 4.55/5.0 |
| Kelly & Adam | 1 | $13,968 | 26 | 4.96/5.0 |
| Spencer | 1 | $13,598 | 14 | 4.86/5.0 |
| Darshit | 1 | $11,421 | 15 | 4.80/5.0 |
Analyzing the strategies of top hosts, such as their property selection, pricing, and guest communication, can offer valuable lessons for optimizing your own Airbnb operations in Beckwith.
Dive Deeper: Advanced Beckwith STR Market Data (2026)
Ready to unlock more insights? AirROI provides access to advanced metrics and comprehensive Airbnb data for Beckwith. Explore detailed analytics beyond this report to refine your investment strategy, optimize pricing, and maximize your vacation rental profits.
Explore Advanced MetricsBeckwith Short-Term Rental Market Composition (2026): Property & Room Types
Room Type Distribution
Property Type Distribution
Market Composition Insights for Beckwith
- The Beckwith Airbnb market composition is heavily skewed towards Entire Home/Apt listings, which make up 100% of the 21 active rentals. This indicates strong guest preference for privacy and space.
- Looking at the property type distribution in Beckwith, House properties are the most common (52.4%), reflecting the local real estate landscape.
- Houses represent a significant 52.4% portion, catering likely to families or larger groups.
- Smaller segments like apartment/condo (combined 4.8%) offer potential for unique stay experiences.
Beckwith Airbnb Room Capacity Analysis (2026): Bedroom Distribution
Distribution of Listings by Number of Bedrooms
Room Capacity Insights for Beckwith
- The dominant room capacity in Beckwith is 2 bedrooms listings, making up 33.3% of the market. This suggests a strong demand for properties suitable for couples or solo travelers.
- Together, 2 bedrooms and 3 bedrooms properties represent 57.1% of the active Airbnb listings in Beckwith, indicating a high concentration in these sizes.
- A significant 47.6% of listings offer 3+ bedrooms, catering to larger groups and families seeking more space in Beckwith.
Beckwith Vacation Rental Guest Capacity Trends (2026)
Distribution of Listings by Guest Capacity
Guest Capacity Insights for Beckwith
- The most common guest capacity trend in Beckwith vacation rentals is listings accommodating 8+ guests (38.1%). This suggests the primary traveler segment is likely larger groups.
- Properties designed for 8+ guests and 6 guests dominate the Beckwith STR market, accounting for 61.9% of listings.
- 66.7% of properties accommodate 6+ guests, serving the market segment for larger families or group travel in Beckwith.
- On average, properties in Beckwith are equipped to host 6.0 guests.
Beckwith Airbnb Booking Patterns (2026): Available vs. Booked Days
Available Days Distribution
Booked Days Distribution
Booking Pattern Insights for Beckwith
- The most common availability pattern in Beckwith falls within the 271-366 days range, representing 52.4% of listings. This suggests many properties have significant open periods on their calendars.
- Approximately 95.3% of listings show high availability (181+ days open annually), indicating potential for increased bookings or specific owner usage patterns.
- For booked days, the 91-180 days range is most frequent in Beckwith (42.9%), reflecting common guest stay durations or potential owner blocking patterns.
- A notable 4.8% of properties secure long booking periods (181+ days booked per year), highlighting successful long-term rental strategies or significant owner usage.
Beckwith Airbnb Minimum Stay Requirements Analysis
Distribution of Listings by Minimum Night Requirement
1 Night
2 listings
9.5% of total
2 Nights
11 listings
52.4% of total
3 Nights
1 listings
4.8% of total
4-6 Nights
3 listings
14.3% of total
7-29 Nights
1 listings
4.8% of total
30+ Nights
3 listings
14.3% of total
Key Insights
- The most prevalent minimum stay requirement in Beckwith is 2 Nights, adopted by 52.4% of listings. This highlights the market's preference for shorter, flexible bookings.
- A strong majority (61.9%) of the Beckwith Airbnb data shows acceptance of very short stays (1-2 nights), indicating a dynamic, high-turnover market.
- A significant segment (14.3%) caters to monthly stays (30+ nights) in Beckwith, pointing to opportunities in the extended-stay market.
Recommendations
- Align with the market by considering a 2 Nights minimum stay, as 52.4% of Beckwith hosts use this setting.
- If feasible, allowing 1-night stays, especially midweek or during low season, could capture last-minute bookings, as only 9.5% currently do.
- A 2-night minimum appears standard (52.4%). Consider this for weekends or peak periods.
- Explore offering discounts for stays of 30+ nights to attract the 14.3% of the market seeking extended stays.
- Adjust minimum nights based on seasonality – potentially shorter during low season and longer during peak demand periods in Beckwith.
Beckwith Airbnb Cancellation Policy Trends Analysis (2026)
Flexible
1 listings
4.8% of total
Moderate
4 listings
19% of total
Firm
16 listings
76.2% of total
Cancellation Policy Insights for Beckwith
- The prevailing Airbnb cancellation policy trend in Beckwith is Firm, used by 76.2% of listings.
- A majority (76.2%) of hosts in Beckwith utilize Firm or Strict policies, indicating a market where hosts prioritize booking security.
Recommendations for Hosts
- Consider adopting a Firm policy to align with the 76.2% market standard in Beckwith.
- Regularly review your cancellation policy against competitors and market demand shifts in Beckwith.
Beckwith STR Booking Lead Time Analysis (2026)
Average Booking Lead Time by Month
Booking Lead Time Insights for Beckwith
- The overall average booking lead time for vacation rentals in Beckwith is 42 days.
- Guests book furthest in advance for stays during July (average 69 days), likely coinciding with peak travel demand or local events.
- The shortest booking windows occur for stays in January (average 7 days), indicating more last-minute travel plans during this time.
- Seasonally, Summer (62 days avg.) sees the longest lead times, while Winter (18 days avg.) has the shortest, reflecting typical travel planning cycles.
Recommendations for Hosts
- Use the overall average lead time (42 days) as a baseline for your pricing and availability strategy in Beckwith.
- For July stays, consider implementing length-of-stay discounts or slightly higher rates for bookings made less than 69 days out to capitalize on advance planning.
- During January, focus on last-minute booking availability and promotions, as guests book with very short notice (7 days avg.).
- Target marketing efforts for the Summer season well in advance (at least 62 days) to capture early planners.
- Monitor your own booking lead times against these Beckwith averages to identify opportunities for dynamic pricing adjustments.
Popular & Essential Airbnb Amenities in Beckwith (2026)
Amenity Prevalence
Amenity Insights for Beckwith
- Essential amenities in Beckwith that guests expect include: Kitchen, Smoke alarm, Free parking on premises, Hot water, Heating, Wifi, Dishes and silverware. Lacking these (any) could significantly impact bookings.
- Popular amenities like Fire extinguisher, Cooking basics, Outdoor furniture are common but not universal. Offering these can provide a competitive edge.
Recommendations for Hosts
- Ensure your listing includes all essential amenities for Beckwith: Kitchen, Smoke alarm, Free parking on premises, Hot water, Heating, Wifi, Dishes and silverware.
- Prioritize adding missing essentials: Heating, Wifi, Dishes and silverware.
- Consider adding popular differentiators like Fire extinguisher or Cooking basics to increase appeal.
- Highlight unique or less common amenities you offer (e.g., hot tub, dedicated workspace, EV charger) in your listing description and photos.
- Regularly check competitor amenities in Beckwith to stay competitive.
Beckwith Airbnb Guest Demographics & Profile Analysis (2026)
Guest Profile Summary for Beckwith
- The typical guest profile for Airbnb in Beckwith consists of primarily domestic travelers (88%), often arriving from nearby Ottawa, typically belonging to the Post-2000s (Gen Z/Alpha) group (50%), primarily speaking English or French.
- Domestic travelers account for 88.2% of guests.
- Key international markets include Canada (88.2%) and United States (7.6%).
- Top languages spoken are English (58.6%) followed by French (17.2%).
- A significant demographic segment is the Post-2000s (Gen Z/Alpha) group, representing 50% of guests.
Recommendations for Hosts
- Target domestic marketing efforts towards travelers from Ottawa and Toronto.
- Tailor amenities and listing descriptions to appeal to the dominant Post-2000s (Gen Z/Alpha) demographic (e.g., highlight fast WiFi, smart home features, local guides).
- Highlight unique local experiences or amenities relevant to the primary guest profile.
- Consider seasonal promotions aligned with peak travel times for key origin markets.
Nearby Short-Term Rental Market Comparison
How does the Beckwith Airbnb market stack up against its neighbors? Compare key performance metrics like average monthly revenue, ADR, and occupancy rates in surrounding areas to understand the broader regional STR landscape.
| Market | Active Properties | Monthly Revenue | Daily Rate | Avg. Occupancy |
|---|---|---|---|---|
| Thorne | 11 | $3,847 | $221.83 | 66% |
| Cantley | 19 | $3,753 | $266.04 | 51% |
| Lac-Simon | 24 | $3,599 | $443.52 | 27% |
| Rossmore | 10 | $3,551 | $269.66 | 59% |
| Val-des-Monts | 123 | $3,077 | $255.71 | 46% |
| Westport | 13 | $2,984 | $350.53 | 30% |
| Front of Yonge | 11 | $2,919 | $257.85 | 45% |
| Asphodel-Norwood | 16 | $2,876 | $286.81 | 42% |
| Prince Edward County | 13 | $2,852 | $274.73 | 44% |
| Picton | 220 | $2,700 | $252.26 | 47% |