First South, Nova Scotia Airbnb Market Data 2026: STR Report & Statistics
How much can you earn on Airbnb in First South, Nova Scotia? Based on AirROI's 2026 dataset (April 2025 – March 2026), the short answer is $37,062 per year — at a $193 nightly rate, 55.3% occupancy, and a $118 RevPAR that reflects strong rate-to-revenue efficiency across the market.
With just 26 active listings, First South is a micro-market where solid booking activity throughout the year. Supply grew 420.0% year over year, and the market is recalibrating around a new competitive baseline. This is the stage where hosts who invest in amenities, guest experience, and dynamic pricing build durable advantages that compound as the market matures.
Regulation is high and 96% of listings show active registration — compliance is the cost of entry. In a market this size, differentiated listings with strong reviews can capture outsized returns relative to the competition.

Table of Contents [hide] [show]
What Are the Key Airbnb Metrics in First South?
In First South, the headline Airbnb metrics are $37,062 in average annual revenue,55.3% occupancy, $193 ADR, and $118 in RevPAR, and guests book about 106 days in advance.
How Much Do Airbnb Hosts Earn Monthly in First South?
Understanding the monthly revenue variations for Airbnb listings in First South is key to maximizing your short term rental income potential. Seasonality significantly impacts earnings. Our analysis, based on data from the past 12 months, shows that the peak revenue month for STRs in First South is typically July, while January often presents the lowest earnings, highlighting opportunities for strategic pricing adjustments during shoulder and low seasons. Explore the typical Airbnb income in First South across different performance tiers:
- Best-in-class properties (Top 10%) achieve $6,595+ monthly, often utilizing dynamic pricing and superior guest experiences.
- Strong performing properties (Top 25%) earn $5,287 or more, indicating effective management and desirable locations/amenities.
- Typical properties (Median) generate around $4,029 per month, representing the average market performance.
- Entry-level properties (Bottom 25%) see earnings around $2,019, often with potential for optimization.
Average Monthly Airbnb Earnings Trend in First South
What Is the Monthly Airbnb Occupancy Rate in First South?
Maximize your bookings by understanding the First South STR occupancy trends. Seasonal demand shifts significantly influence how often properties are booked. Typically, Julysees the highest demand (peak season occupancy), while May experiences the lowest (low season). Effective strategies, like adjusting minimum stays or offering promotions, can boost occupancy during slower periods. Here's how different property tiers perform in First South:
- Best-in-class properties (Top 10%) achieve 89%+ occupancy, indicating high desirability and potentially optimized availability.
- Strong performing properties (Top 25%) maintain 81% or higher occupancy, suggesting good market fit and guest satisfaction.
- Typical properties (Median) have an occupancy rate around 56%.
- Entry-level properties (Bottom 25%) average 40% occupancy, potentially facing higher vacancy.
Average Monthly Occupancy Rate Trend in First South
What Is the Average Airbnb Nightly Rate in First South?
Effective short term rental pricing strategy in First South involves understanding monthly ADR fluctuations. The Average Daily Rate (ADR) for Airbnb in First South typically peaks in July and dips lowest during April. Leveraging Airbnb dynamic pricing tools or strategies based on this seasonality can significantly boost revenue. Here's a look at the typical nightly rates achieved:
- Best-in-class properties (Top 10%) command rates of $307+ per night, often due to premium features or locations.
- Strong performing properties (Top 25%) achieve nightly rates of $226 or more.
- Typical properties (Median) charge around $176 per night.
- Entry-level properties (Bottom 25%) earn around $121 per night.
Average Daily Rate (ADR) Trend by Month in First South
What Is the RevPAR for Airbnb in First South?
RevPAR in First South is currently $118. Because RevPAR combines nightly rates with realized occupancy, it is one of the cleanest ways to compare how efficiently listings turn demand into revenue across the market.
- Entry-level properties (Bottom 25%) see $58 RevPAR.
- Typical properties (Median) generate $125 RevPAR.
- Strong performers (Top 25%) earn $153 RevPAR.
- Best-in-class (Top 10%) achieve $192 RevPAR.
Average Monthly RevPAR Trend in First South
RevPAR Insights for First South
- The average RevPAR in First South is $118. This metric combines nightly rates with realized occupancy, making it one of the best single-number indicators of market efficiency.
- The gap between the top 10% ($192) and bottom 25% ($58) is $134, indicating significant performance disparity driven by property quality, pricing strategy, and location.
- RevPAR peaks in Jul and bottoms out in Jan, mirroring the broader seasonal demand pattern and suggesting opportunities for dynamic pricing.
Recommendations for Hosts
- Track your own RevPAR monthly against these First South benchmarks. If your RevPAR falls below the median of $125, examine whether low occupancy or low ADR is the primary drag.
- Top-quartile listings achieve $153+ RevPAR through a combination of competitive pricing, strong reviews, and strategic amenities. Target this tier through incremental improvements.
- Use RevPAR rather than revenue alone when comparing properties of different sizes — it normalizes for available nights and gives a more accurate picture of performance.
Get Live First South Market Intelligence 👇
Explore Real-time Analytics
When Is the Peak Season for Airbnb in First South?
First South's peak Airbnb season falls in July, August, September, while the softest stretch is January, February, April. Overall, the market shows highly seasonal trends requiring careful strategy, which should guide pricing, minimum stays, and cash-flow planning.
Peak Season (July, August, September)
- Revenue averages $5,547 per month
- Occupancy rates average 71.9%
- Daily rates average $215
Shoulder Season
- Revenue averages $3,576 per month
- Occupancy maintains around 54.5%
- Daily rates hold near $190
Low Season (January, February, April)
- Revenue drops to average $3,112 per month
- Occupancy decreases to average 55.6%
- Daily rates adjust to average $171
Seasonality Insights for First South
- Airbnb seasonality in First South is pronounced. Revenue swings sharply between peak and low months, which means pricing strategy, minimum-stay settings, and cash reserves all need to account for extended slower periods.
- During the high season, the absolute peak month showcases First South's highest earning potential, with monthly revenues climbing to $6,163, occupancy reaching 84.0%, and ADRs peaking at $220.
- Conversely, the slowest single month marks the market's lowest point — revenue may dip to $3,064, occupancy could drop to 49.4%, and ADRs may adjust to $162.
- Understanding both the seasonal averages and these monthly peaks and troughs in revenue, occupancy, and ADR is crucial for maximizing your Airbnb profit potential in First South.
Seasonal Strategies for Maximizing Profit
- Peak Season: Maximize revenue through premium pricing. In a high-regulation market like First South, ensure your permit covers the number of nights you plan to book — some jurisdictions cap annual rental days.
- Low Season: Even in a market with solid annual occupancy, the slower months benefit from competitive pricing and flexible check-in/check-out windows. Target remote workers and extended-stay travelers who value value over peak-season amenities.
- Shoulder Seasons: Implement dynamic pricing that bridges peak and low rates. Target weekend travelers, local events, and business visitors. Slightly more flexible terms than peak season can help maintain occupancy without deep discounting.
- In a highly seasonal market like First South, building a cash reserve during the top months is essential for covering fixed costs during the slow period. Automated pricing tools can help capture demand shifts in real time.
Do You Need a License for Airbnb in First South?
Yes, First South, Nova Scotia, Canada enforces high STR regulations and 96% of active listings show registration evidence — indicating that enforcement is active and compliance is a prerequisite for operating legally. Hosts entering this market should budget for permit fees, inspections, and potential occupancy tax obligations as part of their startup costs. Always verify the latest short-term rental regulations and Airbnb license requirements directly with local government authorities for First South to ensure full compliance before hosting.
(Source: AirROI data, 2026, based on 96% licensed listings)
What Are the Best Neighborhoods for Airbnb in First South?
With a compact short-term rental market, First South gives early-mover hosts an advantage in the right neighborhoods. The areas listed below are where guest demand and local attractions converge — a useful lens for investors evaluating whether to enter this market and where to position their listing.
| Neighborhood / Area | Why Host Here? (Target Guests & Appeal) | Key Attractions & Landmarks |
|---|---|---|
| Lunenburg | A UNESCO World Heritage Site known for its picturesque coastal scenery, historic architecture, and vibrant arts community. A popular destination for tourists seeking a blend of culture, history, and nature. | Old Town Lunenburg, Fisheries Museum of the Atlantic, Bluenose II, Lunenburg Seafood Action Committee, Fisherman's Memorial |
| Mahone Bay | Famous for its charming waterfront, iconic three churches, and lively local shops. A favorite among travelers looking for quaint boutique experiences and scenic views. | Mahone Bay Museum, The Mellow Mug, The Three Churches, Mahone Bay Marina, Local Artisan Shops |
| Wolfville | Home to Acadia University, Wolfville is known for its vibrant student population and access to wineries and the Bay of Fundy. Attracts both young travelers and wine enthusiasts. | Acadia University, Salt Springs Vineyard, Wolfville Farmers Market, Cape Blomidon, The Kingsport Beach |
| Yarmouth | A coastal town known for its ferry services to the USA and rich maritime history. Visitors often explore its natural beauty and historic sites. | Yarmouth County Museum, Cape Forchu Lighthouse, Yarmouth Harbour, Tusket Islands, Le Village Historique Acadien |
| Halifax | The capital of Nova Scotia, known for its historic waterfront and vibrant city life. An urban base for tourists exploring the region and seeking cultural experiences. | Halifax Citadel, Waterfront Boardwalk, Halifax Public Gardens, Pier 21, Maritime Museum of the Atlantic |
| East Hants | A growing area with connections to both Halifax and the scenic landscapes of Nova Scotia. A hidden gem that attracts travelers looking for both urban and rural experiences. | Shubenacadie Wildlife Park, Riverside Park, Local Breweries, Hants County historical sites, Nature Trails |
| Cape Breton Island | Renowned for its stunning natural landscapes, including the Cabot Trail and national parks. A hotspot for outdoor enthusiasts and those seeking unique cultural experiences. | Cabot Trail, Cape Breton Highlands National Park, Alexander Graham Bell Museum, Louisbourg National Historic Site, Aspy Bay |
| Annapolis Royal | Known for its rich history, beautiful gardens, and the Annapolis Basin. Attracts history buffs and nature lovers alike, offering a peaceful retreat. | Fort Anne National Historic Site, Annapolis Historic Gardens, Port Royal National Historic Site, Annapolis Royal Farmers' Market, Annapolis Basin |
Because First South has a high regulation profile, confirming that short-term rental permits are available in your target neighborhood is a critical first step before committing to a property purchase. Regulation can vary at the neighborhood or district level even within the same city.
What Types of Properties Are on Airbnb in First South?
Room Type Distribution
Property Type Distribution
Market Composition Insights for First South
- The First South Airbnb market composition is heavily skewed towards Entire Home/Apt listings, which make up 100% of the 26 active rentals. This indicates strong guest preference for privacy and space.
- Looking at the property type distribution in First South, House properties are the most common (88.5%), reflecting the local real estate landscape.
- Houses represent a significant 88.5% portion, catering likely to families or larger groups.
First South Airbnb Room Capacity Analysis (2026): Bedroom Distribution
Distribution of Listings by Number of Bedrooms
Room Capacity Insights for First South
- The dominant room capacity in First South is 1 bedroom listings, making up 57.7% of the market. This suggests a strong demand for properties suitable for couples or solo travelers.
- Together, 1 bedroom and 2 bedrooms properties represent 80.8% of the active Airbnb listings in First South, indicating a high concentration in these sizes.
- With over half the market (57.7%) consisting of studios or 1-bedroom units, First South is particularly well-suited for individuals or couples.
First South Vacation Rental Guest Capacity Trends (2026)
Distribution of Listings by Guest Capacity
Guest Capacity Insights for First South
- The most common guest capacity trend in First South vacation rentals is listings accommodating 2 guests (46.2%). This suggests the primary traveler segment is likely couples or solo travelers.
- Properties designed for 2 guests and 4 guests dominate the First South STR market, accounting for 69.3% of listings.
- A significant 46.2% of listings cater specifically to 1-2 guests, highlighting strong demand from couples and solo travelers in First South.
- 19.2% of properties accommodate 6+ guests, serving the market segment for larger families or group travel in First South.
- On average, properties in First South are equipped to host 3.5 guests.
How Do Listings in First South Compare on Quality?
Listing quality in First South can be approximated through presentation depth, bedroom count, and how often hosts disclose exact locations. These signals show how professionally the local supply base is merchandised.
Listing Quality Insights for First South
- At 34 photos per listing on average, First South hosts invest well in visual presentation. Listings with 20+ photos consistently outperform in search ranking and conversion.
- 23.1% of listings show their exact location. Lower disclosure rates can increase booking hesitation — guests want to know exactly where they are staying.
Recommendations for Hosts
- Enable exact location if possible — it removes a common source of guest uncertainty and can improve your listing's position in map-based searches.
- Use these quality indicators as a self-audit checklist. Listings that exceed the First South averages across all three metrics are better positioned for premium pricing.
What Amenities Do Airbnb Guests Expect in First South?
Amenity Prevalence
Amenity Insights for First South
- Essential amenities in First South that guests expect include: Kitchen, Free parking on premises, Wifi, Essentials. Lacking these (any) could significantly impact bookings.
- Popular amenities like TV, BBQ grill, Bed linens are common but not universal. Offering these can provide a competitive edge.
Recommendations for Hosts
- Ensure your listing includes all essential amenities for First South: Kitchen, Free parking on premises, Wifi, Essentials.
- Prioritize adding missing essentials: Kitchen.
- Consider adding popular differentiators like TV or BBQ grill to increase appeal.
- Highlight unique or less common amenities you offer (e.g., hot tub, dedicated workspace, EV charger) in your listing description and photos.
- Regularly check competitor amenities in First South to stay competitive.
Which Airbnb Amenities Boost Revenue in First South?
Not every amenity matters equally. This table focuses on the amenities most associated with higher revenue in First South, which makes it more useful for prioritizing upgrades than a simple popularity list alone.
| Amenity | Prevalence | Revenue With | Revenue Without | Revenue Uplift |
|---|---|---|---|---|
Hangers | 65.4% | $50,693 | $11,313 | 348.1% |
Hair dryer | 65.4% | $50,693 | $11,313 | 348.1% |
Fire extinguisher | 65.4% | $50,693 | $11,313 | 348.1% |
Smoke alarm | 65.4% | $50,693 | $11,313 | 348.1% |
Heating | 65.4% | $50,693 | $11,313 | 348.1% |
Hot water | 73.1% | $46,580 | $11,227 | 314.9% |
Air conditioning | 61.5% | $52,202 | $12,836 | 306.7% |
Private entrance | 61.5% | $52,076 | $13,038 | 299.4% |
Iron | 57.7% | $53,732 | $14,330 | 275.0% |
Shampoo | 65.4% | $49,655 | $13,274 | 274.1% |
Revenue Impact Insights for First South
- Hangers tops the revenue impact list with a 348.1% uplift — listings with this amenity earn $50,693 vs. $11,313 without it.
Recommendations for Hosts
- Focus your upgrade budget on amenities in the top half of this table. Below-median amenities may improve guest experience but contribute less to revenue growth.
- Highlight revenue-impacting amenities prominently in your listing title, photos, and description — guests can't value what they don't notice.
Dive Deeper: Advanced First South STR Market Data (2026)
Ready to unlock more insights? AirROI provides access to advanced metrics and comprehensive Airbnb data for First South. Explore detailed analytics beyond this report to refine your investment strategy, optimize pricing, and maximize your vacation rental profits.
Explore Advanced MetricsFirst South Airbnb Guest Demographics & Profile Analysis (2026)
Guest Profile Summary for First South
- The typical guest profile for Airbnb in First South consists of primarily domestic travelers (81%), often arriving from nearby Halifax, typically belonging to the Post-2000s (Gen Z/Alpha) group (50%), primarily speaking English or French.
- Domestic travelers account for 81.4% of guests.
- Key international markets include Canada (81.4%) and United States (14.3%).
- Top languages spoken are English (70.2%) followed by French (15.6%).
- A significant demographic segment is the Post-2000s (Gen Z/Alpha) group, representing 50% of guests.
Recommendations for Hosts
- Target domestic marketing efforts towards travelers from Halifax and Toronto.
- Tailor amenities and listing descriptions to appeal to the dominant Post-2000s (Gen Z/Alpha) demographic (e.g., highlight fast WiFi, smart home features, local guides).
- Highlight unique local experiences or amenities relevant to the primary guest profile.
- Consider seasonal promotions aligned with peak travel times for key origin markets.
What Are Airbnb Guest Ratings in First South?
Listings in First South average 4.87 out of 5 overall, with about 97.4 reviews per active listing and 65.4% of listings carrying the Guest Favorite badge.
Rating Breakdown by Category
Guest Rating Insights for First South
- With an overall rating of 4.87, First South listings meet an exceptionally high bar. Guests consistently report strong satisfaction, which drives repeat bookings and referral traffic.
- The strongest subcategory is Check-in (4.94), while Value (4.78) trails behind — a useful signal for hosts looking to prioritize upgrades.
- 65.4% of listings carry the Guest Favorite badge, a strong trust signal that can meaningfully lift click-through and booking rates.
Recommendations for Hosts
- Focus improvement efforts on Value — even small gains in the weakest subcategory can lift overall ratings and search ranking.
- Encourage guests to leave reviews after checkout. Listings with more reviews rank higher in search results and convert browsers into bookers more effectively.
First South Airbnb Booking Patterns (2026): Available vs. Booked Days
Available Days Distribution
Booked Days Distribution
Booking Pattern Insights for First South
- The most common availability pattern in First South falls within the 181-270 days range, representing 30.8% of listings. This suggests many properties have significant open periods on their calendars.
- Approximately 57.7% of listings show high availability (181+ days open annually), indicating potential for increased bookings or specific owner usage patterns.
- For booked days, the 91-180 days range is most frequent in First South (34.6%), reflecting common guest stay durations or potential owner blocking patterns.
- A notable 42.3% of properties secure long booking periods (181+ days booked per year), highlighting successful long-term rental strategies or significant owner usage.
How Far in Advance Do Guests Book Airbnb in First South?
Average Booking Lead Time by Month
Booking Lead Time Insights for First South
- The overall average booking lead time for vacation rentals in First South is 106 days.
- Guests book furthest in advance for stays during July (average 152 days), likely coinciding with peak travel demand or local events.
- The shortest booking windows occur for stays in January (average 24 days), indicating more last-minute travel plans during this time.
- Seasonally, Summer (134 days avg.) sees the longest lead times, while Winter (28 days avg.) has the shortest, reflecting typical travel planning cycles.
Recommendations for Hosts
- Use the overall average lead time (106 days) as a baseline for your pricing and availability strategy in First South.
- For July stays, consider implementing length-of-stay discounts or slightly higher rates for bookings made less than 152 days out to capitalize on advance planning.
- Target marketing efforts for the Summer season well in advance (at least 134 days) to capture early planners.
- Monitor your own booking lead times against these First South averages to identify opportunities for dynamic pricing adjustments.
What Is the Average Length of Stay for Airbnb in First South?
Guests in First South stay about 3.2 nights on average, generating roughly 1,207 reservations and 46.4 bookings per listing in the latest AirROI dataset. The most common check-in time is 4:00 PM and check-out is 11:00 AM.
Monthly Length of Stay in First South
Check-in Time Distribution
Check-out Time Distribution
Stay Pattern Insights for First South
- A mid-range stay length points to leisure-driven demand — weekend getaways and short vacations. Hosts should optimize for quick turnover efficiency while keeping the guest experience smooth.
- At 46.4 bookings per listing, the turnover rate is high. Hosts with streamlined operations (self-check-in, automated messaging, reliable cleaners) have a structural advantage.
- Stay lengths peak in Apr (6.5 nights) and shorten in Jan (1.6 nights). Adjust minimum-night requirements seasonally to match.
Recommendations for Hosts
- With shorter average stays, focus on streamlining turnover. Self-check-in, reliable cleaning crews, and pre-staged amenities can reduce per-booking operational costs.
- Set your check-in time to match or beat the market standard of 4:00 PM. Offering early check-in flexibility can be a low-cost differentiator.
- Monitor length-of-stay seasonality to adjust minimum-night requirements — longer minimums during peak periods maximize revenue while shorter minimums fill gaps in shoulder seasons.
First South Airbnb Minimum Stay Requirements Analysis
Distribution of Listings by Minimum Night Requirement
1 Night
14 listings
53.8% of total
2 Nights
4 listings
15.4% of total
4-6 Nights
1 listings
3.8% of total
30+ Nights
7 listings
26.9% of total
Key Insights
- The most prevalent minimum stay requirement in First South is 1 Night, adopted by 53.8% of listings. This highlights the market's preference for shorter, flexible bookings.
- A strong majority (69.2%) of the First South Airbnb data shows acceptance of very short stays (1-2 nights), indicating a dynamic, high-turnover market.
- A significant segment (26.9%) caters to monthly stays (30+ nights) in First South, pointing to opportunities in the extended-stay market.
Recommendations
- Align with the market by considering a 1 Night minimum stay, as 53.8% of First South hosts use this setting.
- Explore offering discounts for stays of 30+ nights to attract the 26.9% of the market seeking extended stays.
- Adjust minimum nights based on seasonality – potentially shorter during low season and longer during peak demand periods in First South.
First South Airbnb Cancellation Policy Trends Analysis (2026)
Flexible
21 listings
80.8% of total
Moderate
2 listings
7.7% of total
Firm
3 listings
11.5% of total
Cancellation Policy Insights for First South
- The prevailing Airbnb cancellation policy trend in First South is Flexible, used by 80.8% of listings.
- The market strongly favors guest-friendly terms, with 88.5% of listings offering Flexible or Moderate policies. This suggests guests in First South may expect booking flexibility.
Recommendations for Hosts
- Consider adopting a Flexible policy to align with the 80.8% market standard in First South.
- Given the high prevalence of Flexible policies (80.8%), offering this can enhance booking appeal, especially during shoulder seasons.
- Regularly review your cancellation policy against competitors and market demand shifts in First South.
How Much Are Airbnb Cleaning Fees in First South?
Cleaning fees in First South are meaningful operating levers, not just pass-through charges. What matters most is how often hosts charge them, how high they run relative to market norms, and how large a share of gross revenue they consume.
Cleaning Fee Insights for First South
- 96.2% of listings charge a cleaning fee, making it standard practice in First South. Guests expect it and factor it into their booking decisions.
- The average cleaning fee of $41 is close to the median ($34), suggesting a relatively consistent fee structure across the market.
- Cleaning fees represent 5.4% of gross revenue on average — a modest component of the overall booking price.
Recommendations for Hosts
- Price your cleaning fee competitively against the First South median of $34. Fees significantly above market norms can deter bookings, especially for shorter stays.
- Monitor competitor cleaning fees regularly. Airbnb's search algorithm factors in total price, so a well-calibrated cleaning fee can improve your listing's ranking.
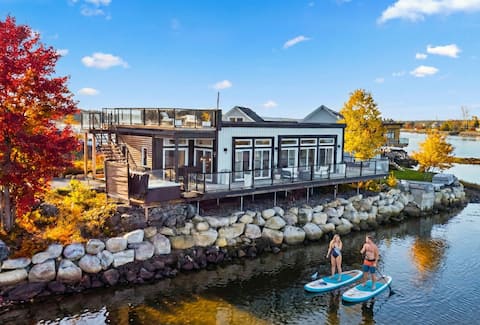
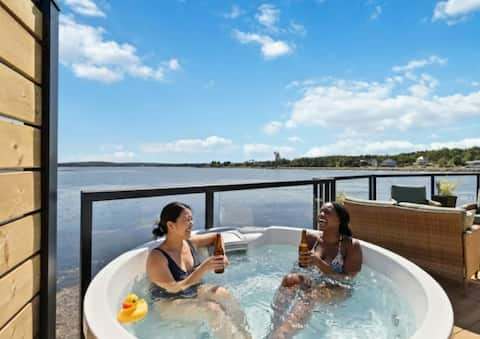
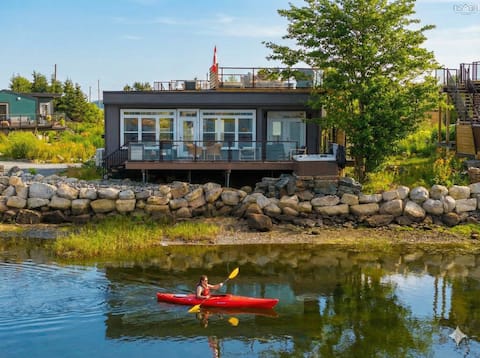
What Do the Top Airbnb Listings in First South Look Like?
Benchmark your potential! Explore examples of top-performing Airbnb properties in First Southbased on Trailing Twelve Month (TTM) revenue. Analyze their characteristics, revenue, occupancy rate, and ADR to understand what drives success in this market.

Book 2 homes together! Ocean Views. Sleeps 8!
Entire Place • 4 bedrooms
Ocean Front #2 HotTub 2 bdrm Rooftopdeck BBQ 2bath
Entire Place • 2 bedrooms
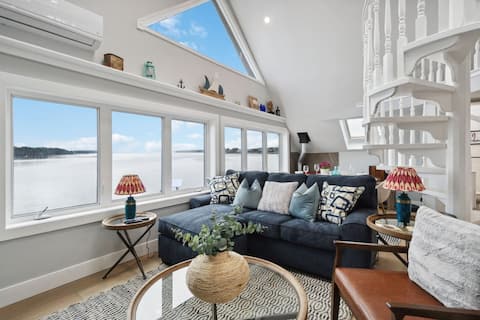
Stunning ocean views! A little piece of paradise!
Entire Place • 3 bedrooms
Ocean Front #4 Hot Tub 2bdrm huge deck BBQ 2bath
Entire Place • 2 bedrooms
Ocean Front #3 HotTub Sunset RoofTopDeck BBQ 2bath
Entire Place • 1 bedroom
Ocean front HotTub Private Deck waterfront BBQ
Entire Place • 1 bedroom
Note: Performance varies based on location, size, amenities, seasonality, and management quality. Data reflects the past 12 months.
Who Are the Top Airbnb Hosts in First South?
Learn from the best! This table showcases top-performing Airbnb hosts in First South based on the number of properties managed and estimated total revenue over the past year. Analyze their scale and performance metrics.
| Host Name | Properties | Grossing Revenue | Stay Reviews | Avg Rating |
|---|---|---|---|---|
| Jay Sutherland | 5 | $324,882 | 868 | 4.98/5.0 |
| Rachael | 3 | $221,374 | 162 | 4.74/5.0 |
| Greg | 4 | $198,915 | 1052 | 4.89/5.0 |
| Leslee | 9 | $101,821 | 160 | 4.83/5.0 |
| Kati | 1 | $55,422 | 138 | 4.97/5.0 |
| Ken | 1 | $28,556 | 46 | 5.00/5.0 |
| Jill | 1 | $26,540 | 39 | 4.90/5.0 |
| Narainen | 1 | $5,707 | 29 | 4.76/5.0 |
| Nathaniel | 1 | $382 | 38 | 4.95/5.0 |
Analyzing the strategies of top hosts, such as their property selection, pricing, and guest communication, can offer valuable lessons for optimizing your own Airbnb operations in First South.
Who Are the Airbnb Hosts in First South?
First South is a quality-focused market, with a high Superhost share and fairly mature operating standards.
Host Profile Insights for First South
- With 100.0% Superhosts, First South has an experienced host base that sets high guest expectations. New entrants should plan for competitive quality standards.
- 11.5% of listings are professionally managed, reflecting a market still dominated by individual hosts.
- 0.0% of listings have Instant Book enabled. Lower Instant Book adoption means many guests must request approval, which can slow conversions.
- 80.8% of listings use Airbnb's simplified pricing (host-only fee), where the host pays the entire platform service fee and the guest sees one all-in price with no separate Airbnb service charge. High adoption signals a professional, PMS-connected host base — Airbnb mandates simplified pricing for software-connected listings.
Recommendations for Hosts
- Consider enabling Instant Book — it reduces booking friction and Airbnb's algorithm tends to favor Instant Book listings in search results.
- With 92.3% cohosted listings, there may be a growing local market for property management services.
- Benchmark your host metrics against these First South averages regularly and adjust your hosting strategy based on what top performers do differently.
Top Professional Management Companies in First South
These are the highest-grossing professional property management operations in First South, ranked by total revenue across their portfolio. Their performance metrics offer a benchmark for what institutional-level hosting looks like in this market.
| Company | Listings | Revenue | ADR | Occ. | Rating |
|---|---|---|---|---|---|
| Rachael | 3 | $221,374 | $273 | 70.4% | 4.74/5 |
Management Company Insights for First South
- The leading management company, Rachael, operates 3 listings with $221,374 in gross revenue — a useful benchmark for what scale looks like in First South.
- Top managers average 3 properties each, suggesting professional management in First South still operates at a relatively boutique scale.
- Professionally managed listings in the top tier average 4.74/5 in guest ratings — demonstrating that scale and quality can coexist.
Recommendations
- With only 11.5% of listings professionally managed, there may be an opportunity to differentiate through more structured operations and consistent guest experiences.
- Study how top management companies price, position, and maintain their portfolios — their ADR and occupancy rates reflect strategies refined across dozens of listings.
- If you're considering hiring a property manager, compare their portfolio performance against these benchmarks before committing.
How Does First South's Airbnb Market Compare to Nearby Cities?
How does the First South Airbnb market stack up against its neighbors? Compare key performance metrics like average monthly revenue, ADR, and occupancy rates in surrounding areas to understand the broader regional STR landscape.
Compared with Boutiliers Point, First South has 1 percentage points higher occupancy and about $148 lower ADR. That helps frame whether this market is winning more on demand, pricing, or both.
| Market | Active Properties | Monthly Revenue | Daily Rate | Avg. Occupancy |
|---|---|---|---|---|
| Fox Point | 10 | $4,292 | $277.49 | 50% |
| Boutiliers Point | 14 | $4,095 | $341.01 | 54% |
| Hammonds Plains | 13 | $3,828 | $296.66 | 48% |
| Hunts Point | 16 | $3,759 | $305.73 | 42% |
| Queensland | 14 | $3,052 | $258.39 | 51% |
| Feltzen South | 21 | $2,737 | $223.44 | 42% |
| Vaughan | 34 | $2,526 | $204.96 | 48% |
| Chester Basin | 11 | $2,473 | $286.39 | 46% |
| Hillsborough | 11 | $2,454 | $157.98 | 53% |
| Chester | 39 | $2,366 | $264.33 | 42% |
Frequently Asked Questions About Airbnb in First South
These quick answers summarize the most common investor and operator questions using AirROI's latest market data for First South.
How much do Airbnb hosts make in First South?
First South hosts earn about $37,062 per year on average, with an average nightly rate of $193 and RevPAR of $118. Those figures describe the typical revenue environment for active listings in First South, Nova Scotia, not the ceiling for the best operators. Source: AirROI 2026 data, First South market, April 2025 to March 2026.
What is the average Airbnb occupancy rate in First South?
The average Airbnb occupancy rate in First South is 55.3%. July is the strongest month and January is the softest, so hosts should expect demand to move meaningfully throughout the year rather than stay flat.
What is the average Airbnb daily rate in First South?
Listings in First South average $193 per night. The broader pricing spread also matters: lower-performing listings cluster closer to the lower quartiles, while premium homes can price materially above the city average when demand spikes or listing quality stands out.
How many Airbnb listings are active in First South?
First South currently has about 26 active Airbnb listings in AirROI's market dataset. That supply count helps explain how competitive the market is, how much depth there is for benchmarking, and whether the market behaves like a niche destination or a scaled urban market.
How strict are short-term rental regulations in First South?
AirROI currently classifies the short-term rental regulation level in First South as High. The dataset also shows about 96.2% of listings with registration evidence. That is a market signal, not legal advice, so hosts should still confirm current licensing and compliance rules locally before listing.
What is the RevPAR for Airbnb in First South?
RevPAR in First South is about $118. That metric combines pricing and occupancy into one efficiency number, so it is often a better quick benchmark than ADR alone when investors want to compare how well listings convert nightly rates into realized revenue.
Is Airbnb profitable in First South?
At 55.3% occupancy, First South can be profitable — but margins depend heavily on operating costs, property acquisition price, and how well hosts optimize pricing across seasons. Average annual revenue is $37,062, but individual returns depend on property type, location within the city, and the host's operating efficiency.
How far in advance do guests book Airbnb in First South?
The average booking lead time in First South is about 106 days — a longer planning horizon typical of destination or vacation markets where travelers book well in advance. Hosts who understand their market's booking cadence can adjust minimum stays and pricing windows accordingly.
What are the best neighborhoods for Airbnb in First South?
Based on AirROI's analysis, some of the top neighborhoods for short-term rentals in First South include Lunenburg, Mahone Bay, Wolfville. Each area attracts different guest profiles — from business travelers to leisure visitors — so the best location depends on the property type and target audience a host is aiming for. See the full neighborhood breakdown above.
What type of property performs best on Airbnb in First South?
entire_home listings make up 100.0% of the active supply in First South. The most common configuration does not always mean the most profitable — operators who identify underserved property types or bedroom counts can sometimes outperform the market average by filling a gap in local supply.
How does First South compare to nearby Airbnb markets?
Among neighboring markets, Fox Point posts $51,502 in average annual revenue with 49.8% occupancy, compared to First South's $37,062 and 55.3%. Comparing nearby markets helps investors understand whether a destination's performance reflects local demand or broader regional trends.
What is the average length of stay in First South?
The average Airbnb stay length in First South is about 3.2 nights. That matters for turnover, cleaning operations, and pricing strategy because shorter stays increase changeovers while longer stays can smooth occupancy and reduce operational friction.
What is the average Airbnb guest rating in First South?
Airbnb listings in First South average 4.87 out of 5 overall. About 65.4% of listings carry the guest favorite badge, which suggests a meaningful share of inventory is competing on review quality rather than price alone.
Which amenities boost Airbnb revenue in First South?
Hangers and Hair dryer are among the strongest revenue-linked amenities in First South. In AirROI's latest dataset, listings with these amenities outperform those without on average revenue, which makes amenities analysis useful for prioritizing investment and listing upgrades.
Do Airbnb hosts charge cleaning fees in First South?
Yes. About 96.2% of active Airbnb listings in First South charge a cleaning fee, and the average fee is $41. The more important operating benchmark is how much of gross revenue that fee consumes, not just the absolute dollar amount.
What percentage of Airbnb hosts are Superhosts in First South?
A 100.0% Superhost rate signals a highly competitive market where review quality and responsiveness are table stakes, not differentiators.
About AirROI Market Data
AirROI tracks over 20 million properties across 190+ countries and maintains 15+ years of historical performance data, making it one of the deepest Airbnb and STR intelligence platforms available. The analytics pipeline aggregates listing-level data monthly — revenue, occupancy, nightly rates, RevPAR, guest demographics, booking patterns, and competitive supply — so investors and operators can benchmark any market against its own history and against neighboring destinations.
Real estate investors, property managers, financial institutions, hedge funds, tourism boards, hospitality consultants, tech platforms, and academic researchers rely on AirROI data to underwrite acquisitions, optimize pricing, model macro trends, and conduct peer-reviewed research. Data is available through in-depth market reports like this one and the Airbnb API with 22 endpoints and an Airbnb MCP Server for AI agents.
AirROI proprietary analytics as of 2026-03-31. Metrics reflect trailing twelve-month aggregates from active listings. Revenue figures are market averages, not projections. Neighborhood descriptions are AI-generated and reviewed for accuracy. For full methodology, see the data methodology page.