Rocky Harbour Airbnb Market Analysis 2026: Short Term Rental Data & Vacation Rental Statistics in Newfoundland and Labrador, Canada
Is Airbnb profitable in Rocky Harbour in 2026? Explore comprehensive Airbnb analytics for Rocky Harbour, Newfoundland and Labrador, Canada to uncover income potential. This 2026 STR market report for Rocky Harbour, based on AirROI data from February 2025 to January 2026, reveals key trends in the niche market of 113 active listings.
Whether you're considering an Airbnb investment in Rocky Harbour, optimizing your existing vacation rental, or exploring rental arbitrage opportunities, understanding the Rocky Harbour Airbnb data is crucial. Navigating the high regulation landscape is key to maximizing your short term rental income potential. Let's dive into the specifics.
Key Rocky Harbour Airbnb Performance Metrics Overview
Monthly Airbnb Revenue Variations & Income Potential in Rocky Harbour (2026)
Understanding the monthly revenue variations for Airbnb listings in Rocky Harbour is key to maximizing your short term rental income potential. Seasonality significantly impacts earnings. Our analysis, based on data from the past 12 months, shows that the peak revenue month for STRs in Rocky Harbour is typically August, while January often presents the lowest earnings, highlighting opportunities for strategic pricing adjustments during shoulder and low seasons. Explore the typical Airbnb income in Rocky Harbour across different performance tiers:
- Best-in-class properties (Top 10%) achieve $3,861+ monthly, often utilizing dynamic pricing and superior guest experiences.
- Strong performing properties (Top 25%) earn $2,801 or more, indicating effective management and desirable locations/amenities.
- Typical properties (Median) generate around $1,817 per month, representing the average market performance.
- Entry-level properties (Bottom 25%) see earnings around $1,104, often with potential for optimization.
Average Monthly Airbnb Earnings Trend in Rocky Harbour
Rocky Harbour Airbnb Occupancy Rate Trends (2026)
Maximize your bookings by understanding the Rocky Harbour STR occupancy trends. Seasonal demand shifts significantly influence how often properties are booked. Typically, Julysees the highest demand (peak season occupancy), while January experiences the lowest (low season). Effective strategies, like adjusting minimum stays or offering promotions, can boost occupancy during slower periods. Here's how different property tiers perform in Rocky Harbour:
- Best-in-class properties (Top 10%) achieve 74%+ occupancy, indicating high desirability and potentially optimized availability.
- Strong performing properties (Top 25%) maintain 59% or higher occupancy, suggesting good market fit and guest satisfaction.
- Typical properties (Median) have an occupancy rate around 42%.
- Entry-level properties (Bottom 25%) average 28% occupancy, potentially facing higher vacancy.
Average Monthly Occupancy Rate Trend in Rocky Harbour
Average Daily Rate (ADR) Airbnb Trends in Rocky Harbour (2026)
Effective short term rental pricing strategy in Rocky Harbour involves understanding monthly ADR fluctuations. The Average Daily Rate (ADR) for Airbnb in Rocky Harbour typically peaks in August and dips lowest during March. Leveraging Airbnb dynamic pricing tools or strategies based on this seasonality can significantly boost revenue. Here's a look at the typical nightly rates achieved:
- Best-in-class properties (Top 10%) command rates of $216+ per night, often due to premium features or locations.
- Strong performing properties (Top 25%) achieve nightly rates of $167 or more.
- Typical properties (Median) charge around $130 per night.
- Entry-level properties (Bottom 25%) earn around $110 per night.
Average Daily Rate (ADR) Trend by Month in Rocky Harbour
Get Live Rocky Harbour Market Intelligence 👇

Explore Real-time Analytics
Airbnb Seasonality Analysis & Trends in Rocky Harbour (2026)
Peak Season (August, July, June)
- Revenue averages $3,679 per month
- Occupancy rates average 74.6%
- Daily rates average $152
Shoulder Season
- Revenue averages $1,907 per month
- Occupancy maintains around 41.2%
- Daily rates hold near $144
Low Season (January, February, March)
- Revenue drops to average $811 per month
- Occupancy decreases to average 20.4%
- Daily rates adjust to average $140
Seasonality Insights for Rocky Harbour
- The Airbnb seasonality in Rocky Harbour shows highly seasonal trends requiring careful strategy. While the sections above show seasonal averages, it's also insightful to look at the extremes:
- During the high season, the absolute peak month showcases Rocky Harbour's highest earning potential, with monthly revenues capable of climbing to $3,923, occupancy reaching a high of 78.2%, and ADRs peaking at $153.
- Conversely, the slowest single month of the year, typically falling within the low season, marks the market's lowest point. In this month, revenue might dip to $641, occupancy could drop to 17.1%, and ADRs may adjust down to $139.
- Understanding both the seasonal averages and these monthly peaks and troughs in revenue, occupancy, and ADR is crucial for maximizing your Airbnb profit potential in Rocky Harbour.
Seasonal Strategies for Maximizing Profit
- Peak Season: Maximize revenue through premium pricing and potentially longer minimum stays. Ensure high availability.
- Low Season: Offer competitive pricing, special promotions (e.g., extended stay discounts), and flexible cancellation policies. Target off-season travelers like remote workers or budget-conscious guests.
- Shoulder Seasons: Implement dynamic pricing that balances peak and low rates. Target weekend travelers or specific events. Offer slightly more flexible terms than peak season.
- Regularly analyze your own performance against these Rocky Harbour seasonality benchmarks and adjust your pricing and availability strategy accordingly.
Best Areas for Airbnb Investment in Rocky Harbour (2026)
Exploring the top neighborhoods for short-term rentals in Rocky Harbour? This section highlights key areas, outlining why they are attractive for hosts and guests, along with notable local attractions. Consider these locations based on your target guest profile and investment strategy.
| Neighborhood / Area | Why Host Here? (Target Guests & Appeal) | Key Attractions & Landmarks |
|---|---|---|
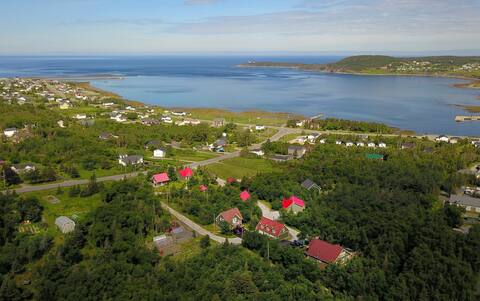
| Sandy Cove | A beautiful coastal area known for its stunning views and peaceful environment. Ideal for visitors looking to relax and enjoy nature. | Gros Morne National Park, Sandy Cove Beach, Lobster Cove Head Lighthouse, Scenic hiking trails, Wildlife viewing |
| Baker's Brook | Offers access to the famous Gros Morne National Park, perfect for outdoor enthusiasts and nature lovers. Known for its breathtaking landscapes and recreational activities. | Great Northern Peninsula, Gros Morne National Park, Baker's Brook Trail, Fishing spots, Scenic views |
| Rocky Harbour Beach | Popular beach area with beautiful sand and water, perfect for summer vacations. Great spot for families looking for fun in the sun. | Rocky Harbour Beach, Kayaking opportunities, Local seafood restaurants, Beach volleyball, Nature trails |
| Lobster Cove | This area is known for its historical significance and beautiful scenery. Attracts tourists interested in history and culture. | Lobster Cove Head Lighthouse, Heritage Interpretation Centre, Whale watching opportunities, Cultural festivals, Picturesque coastal views |
| Gros Morne Village | A charming village with a local community vibe. Great for travelers looking for an authentic Newfoundland experience. | Local artisan shops, Cafes and restaurants, Community events, Scenic river walks, Heritage sites |
| Burnt Hill | A serene area with access to hiking and outdoor activities. Attracts visitors who enjoy secluded nature. | Hiking trails, Scenic overlooks, Natural springs, Bird watching, Tranquil environment |
| Parks Canada Gros Morne Interpretation Centre | This center provides insight into the natural and cultural history of the area. Popular for educational tourism. | Interpretation exhibits, Guided tours, Visitor centre, Educational programs, Access to hiking trails |
| Fox Island River | Unique location for fishing and river activities. Great for adventure seekers and those wanting to explore waterways. | Fishing spots, Canoeing and kayaking, Remote wilderness experience, Wildlife spotting, Beautiful river views |
Understanding Airbnb License Requirements & STR Laws in Rocky Harbour (2026)
Yes, Rocky Harbour, Newfoundland and Labrador, Canada enforces high STR regulations. Obtaining a license and ensuring compliance is almost certainly required according to current 2026 STR laws. Always verify the latest short term rental regulations and Airbnb license requirements directly with local government authorities for Rocky Harbour to ensure full compliance before hosting.
(Source: AirROI data, 2026, based on 61% licensed listings)
Top Performing Airbnb Properties in Rocky Harbour (2026)
Benchmark your potential! Explore examples of top-performing Airbnb properties in Rocky Harbourbased on Trailing Twelve Month (TTM) revenue. Analyze their characteristics, revenue, occupancy rate, and ADR to understand what drives success in this market.

Cottage # 7, Rising Tide
Entire Place • 3 bedrooms
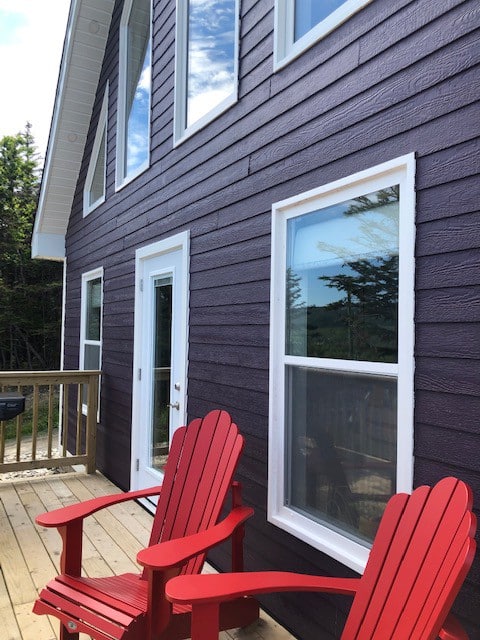
Bambury's 3 Bedroom Purple Chalet
Entire Place • 3 bedrooms

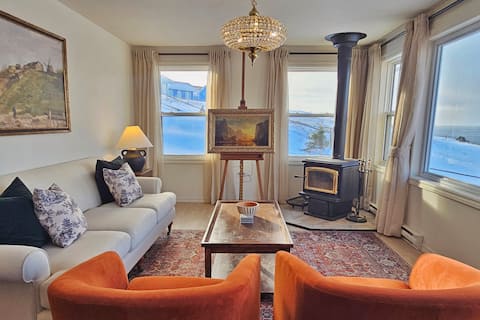
Chic Oceanfront Cottage- The Fish Sheds (Kitten's)
Entire Place • 1 bedroom
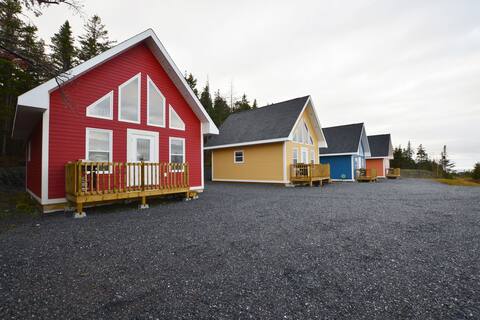
Bambury's Hillside Chalets - The Red Chalet
Entire Place • 2 bedrooms
The Fish Sheds-Oceanview Two Bedroom Cottage
Entire Place • 2 bedrooms
Alderbed Cottages & Chalet # 5
Entire Place • 3 bedrooms
Note: Performance varies based on location, size, amenities, seasonality, and management quality. Data reflects the past 12 months.
Top Performing Airbnb Hosts in Rocky Harbour (2026)
Learn from the best! This table showcases top-performing Airbnb hosts in Rocky Harbour based on the number of properties managed and estimated total revenue over the past year. Analyze their scale and performance metrics.
| Host Name | Properties | Grossing Revenue | Stay Reviews | Avg Rating |
|---|---|---|---|---|
| Boyd | 7 | $199,192 | 219 | 4.92/5.0 |
| Christopher | 6 | $195,042 | 440 | 4.98/5.0 |
| Trevor | 6 | $166,165 | 349 | 4.94/5.0 |
| Ruby | 17 | $149,106 | 1109 | 4.71/5.0 |
| Tracy & Dwayne | 7 | $107,018 | 1398 | 4.94/5.0 |
| Laurie And May | 4 | $89,179 | 244 | 4.93/5.0 |
| Yvonne | 4 | $85,185 | 139 | 4.92/5.0 |
| Sonya K | 4 | $83,317 | 676 | 4.97/5.0 |
| Holly | 6 | $79,800 | 531 | 4.89/5.0 |
| SU Holdings | 3 | $78,682 | 269 | 4.93/5.0 |
Analyzing the strategies of top hosts, such as their property selection, pricing, and guest communication, can offer valuable lessons for optimizing your own Airbnb operations in Rocky Harbour.
Dive Deeper: Advanced Rocky Harbour STR Market Data (2026)
Ready to unlock more insights? AirROI provides access to advanced metrics and comprehensive Airbnb data for Rocky Harbour. Explore detailed analytics beyond this report to refine your investment strategy, optimize pricing, and maximize your vacation rental profits.
Explore Advanced MetricsRocky Harbour Short-Term Rental Market Composition (2026): Property & Room Types
Room Type Distribution
Property Type Distribution
Market Composition Insights for Rocky Harbour
- The Rocky Harbour Airbnb market composition is heavily skewed towards Entire Home/Apt listings, which make up 90.3% of the 113 active rentals. This indicates strong guest preference for privacy and space.
- Looking at the property type distribution in Rocky Harbour, House properties are the most common (52.2%), reflecting the local real estate landscape.
- Houses represent a significant 52.2% portion, catering likely to families or larger groups.
- The presence of 12.4% Hotel/Boutique listings indicates integration with traditional hospitality.
- Smaller segments like others (combined 0.9%) offer potential for unique stay experiences.
Rocky Harbour Airbnb Room Capacity Analysis (2026): Bedroom Distribution
Distribution of Listings by Number of Bedrooms
Room Capacity Insights for Rocky Harbour
- The dominant room capacity in Rocky Harbour is 1 bedroom listings, making up 52.2% of the market. This suggests a strong demand for properties suitable for couples or solo travelers.
- Together, 1 bedroom and 2 bedrooms properties represent 87.6% of the active Airbnb listings in Rocky Harbour, indicating a high concentration in these sizes.
- With over half the market (52.2%) consisting of studios or 1-bedroom units, Rocky Harbour is particularly well-suited for individuals or couples.
Rocky Harbour Vacation Rental Guest Capacity Trends (2026)
Distribution of Listings by Guest Capacity
Guest Capacity Insights for Rocky Harbour
- The most common guest capacity trend in Rocky Harbour vacation rentals is listings accommodating 4 guests (39.8%). This suggests the primary traveler segment is likely small families or groups.
- Properties designed for 4 guests and 2 guests dominate the Rocky Harbour STR market, accounting for 78.7% of listings.
- 13.3% of properties accommodate 6+ guests, serving the market segment for larger families or group travel in Rocky Harbour.
- On average, properties in Rocky Harbour are equipped to host 3.4 guests.
Rocky Harbour Airbnb Booking Patterns (2026): Available vs. Booked Days
Available Days Distribution
Booked Days Distribution
Booking Pattern Insights for Rocky Harbour
- The most common availability pattern in Rocky Harbour falls within the 181-270 days range, representing 66.4% of listings. This suggests many properties have significant open periods on their calendars.
- Approximately 92.9% of listings show high availability (181+ days open annually), indicating potential for increased bookings or specific owner usage patterns.
- For booked days, the 91-180 days range is most frequent in Rocky Harbour (63.7%), reflecting common guest stay durations or potential owner blocking patterns.
- A notable 10.6% of properties secure long booking periods (181+ days booked per year), highlighting successful long-term rental strategies or significant owner usage.
Rocky Harbour Airbnb Minimum Stay Requirements Analysis
Distribution of Listings by Minimum Night Requirement
1 Night
56 listings
49.6% of total
2 Nights
23 listings
20.4% of total
3 Nights
3 listings
2.7% of total
30+ Nights
31 listings
27.4% of total
Key Insights
- The most prevalent minimum stay requirement in Rocky Harbour is 1 Night, adopted by 49.6% of listings. This highlights the market's preference for shorter, flexible bookings.
- A strong majority (70.0%) of the Rocky Harbour Airbnb data shows acceptance of very short stays (1-2 nights), indicating a dynamic, high-turnover market.
- A significant segment (27.4%) caters to monthly stays (30+ nights) in Rocky Harbour, pointing to opportunities in the extended-stay market.
Recommendations
- Align with the market by considering a 1 Night minimum stay, as 49.6% of Rocky Harbour hosts use this setting.
- Explore offering discounts for stays of 30+ nights to attract the 27.4% of the market seeking extended stays.
- Adjust minimum nights based on seasonality – potentially shorter during low season and longer during peak demand periods in Rocky Harbour.
Rocky Harbour Airbnb Cancellation Policy Trends Analysis (2026)
Limited
10 listings
8.8% of total
Flexible
23 listings
20.4% of total
Moderate
51 listings
45.1% of total
Firm
23 listings
20.4% of total
Strict
6 listings
5.3% of total
Cancellation Policy Insights for Rocky Harbour
- The prevailing Airbnb cancellation policy trend in Rocky Harbour is Moderate, used by 45.1% of listings.
- There's a relatively balanced mix between guest-friendly (65.5%) and stricter (25.7%) policies, offering choices for different guest needs.
- Strict cancellation policies are quite rare (5.3%), potentially making listings with this policy less competitive unless justified by high demand or property type.
Recommendations for Hosts
- Consider adopting a Moderate policy to align with the 45.1% market standard in Rocky Harbour.
- Using a Strict policy might deter some guests, as only 5.3% of listings use it. Evaluate if potential revenue protection outweighs possible lower booking rates.
- Regularly review your cancellation policy against competitors and market demand shifts in Rocky Harbour.
Rocky Harbour STR Booking Lead Time Analysis (2026)
Average Booking Lead Time by Month
Booking Lead Time Insights for Rocky Harbour
- The overall average booking lead time for vacation rentals in Rocky Harbour is 101 days.
- Guests book furthest in advance for stays during April (average 195 days), likely coinciding with peak travel demand or local events.
- The shortest booking windows occur for stays in January (average 23 days), indicating more last-minute travel plans during this time.
- Seasonally, Spring (138 days avg.) sees the longest lead times, while Winter (29 days avg.) has the shortest, reflecting typical travel planning cycles.
Recommendations for Hosts
- Use the overall average lead time (101 days) as a baseline for your pricing and availability strategy in Rocky Harbour.
- For April stays, consider implementing length-of-stay discounts or slightly higher rates for bookings made less than 195 days out to capitalize on advance planning.
- Target marketing efforts for the Spring season well in advance (at least 138 days) to capture early planners.
- Monitor your own booking lead times against these Rocky Harbour averages to identify opportunities for dynamic pricing adjustments.
Popular & Essential Airbnb Amenities in Rocky Harbour (2026)
Amenity Prevalence
Amenity Insights for Rocky Harbour
- Essential amenities in Rocky Harbour that guests expect include: Free parking on premises, Smoke alarm, Wifi. Lacking these (any) could significantly impact bookings.
- Popular amenities like Heating, TV, Fire extinguisher are common but not universal. Offering these can provide a competitive edge.
Recommendations for Hosts
- Ensure your listing includes all essential amenities for Rocky Harbour: Free parking on premises, Smoke alarm, Wifi.
- Prioritize adding missing essentials: Smoke alarm, Wifi.
- Consider adding popular differentiators like Heating or TV to increase appeal.
- Highlight unique or less common amenities you offer (e.g., hot tub, dedicated workspace, EV charger) in your listing description and photos.
- Regularly check competitor amenities in Rocky Harbour to stay competitive.
Rocky Harbour Airbnb Guest Demographics & Profile Analysis (2026)
Guest Profile Summary for Rocky Harbour
- The typical guest profile for Airbnb in Rocky Harbour consists of primarily domestic travelers (76%), often arriving from nearby Toronto, typically belonging to the Post-2000s (Gen Z/Alpha) group (50%), primarily speaking English or French.
- Domestic travelers account for 75.8% of guests.
- Key international markets include Canada (75.8%) and United States (15.2%).
- Top languages spoken are English (68.6%) followed by French (13.8%).
- A significant demographic segment is the Post-2000s (Gen Z/Alpha) group, representing 50% of guests.
Recommendations for Hosts
- Target domestic marketing efforts towards travelers from Toronto and Ottawa.
- Tailor amenities and listing descriptions to appeal to the dominant Post-2000s (Gen Z/Alpha) demographic (e.g., highlight fast WiFi, smart home features, local guides).
- Highlight unique local experiences or amenities relevant to the primary guest profile.
- Consider seasonal promotions aligned with peak travel times for key origin markets.
Nearby Short-Term Rental Market Comparison
How does the Rocky Harbour Airbnb market stack up against its neighbors? Compare key performance metrics like average monthly revenue, ADR, and occupancy rates in surrounding areas to understand the broader regional STR landscape.
| Market | Active Properties | Monthly Revenue | Daily Rate | Avg. Occupancy |
|---|---|---|---|---|
| Norris Point | 38 | $2,192 | $183.87 | 56% |
| Pasadena | 12 | $2,072 | $165.03 | 48% |
| Deer Lake | 48 | $1,641 | $114.22 | 52% |
| Trout River | 16 | $1,639 | $131.89 | 55% |
| Woody Point | 25 | $1,562 | $232.25 | 42% |
| Corner Brook | 68 | $1,508 | $106.34 | 56% |
| Cow Head | 14 | $1,467 | $147.97 | 53% |
| Steady Brook | 19 | $1,345 | $158.93 | 33% |
| Lark Harbour | 10 | $1,249 | $153.35 | 46% |
| Springdale | 16 | $1,210 | $181.80 | 30% |