West Kelowna Airbnb Market Analysis 2026: Short Term Rental Data & Vacation Rental Statistics in British Columbia, Canada
Is Airbnb profitable in West Kelowna in 2026? Explore comprehensive Airbnb analytics for West Kelowna, British Columbia, Canada to uncover income potential. This 2026 STR market report for West Kelowna, based on AirROI data from February 2025 to January 2026, reveals key trends in the market of 376 active listings.
Whether you're considering an Airbnb investment in West Kelowna, optimizing your existing vacation rental, or exploring rental arbitrage opportunities, understanding the West Kelowna Airbnb data is crucial. Navigating the high regulation landscape is key to maximizing your short term rental income potential. Let's dive into the specifics.
Key West Kelowna Airbnb Performance Metrics Overview
Monthly Airbnb Revenue Variations & Income Potential in West Kelowna (2026)
Understanding the monthly revenue variations for Airbnb listings in West Kelowna is key to maximizing your short term rental income potential. Seasonality significantly impacts earnings. Our analysis, based on data from the past 12 months, shows that the peak revenue month for STRs in West Kelowna is typically August, while January often presents the lowest earnings, highlighting opportunities for strategic pricing adjustments during shoulder and low seasons. Explore the typical Airbnb income in West Kelowna across different performance tiers:
- Best-in-class properties (Top 10%) achieve $7,061+ monthly, often utilizing dynamic pricing and superior guest experiences.
- Strong performing properties (Top 25%) earn $4,560 or more, indicating effective management and desirable locations/amenities.
- Typical properties (Median) generate around $2,754 per month, representing the average market performance.
- Entry-level properties (Bottom 25%) see earnings around $1,536, often with potential for optimization.
Average Monthly Airbnb Earnings Trend in West Kelowna
West Kelowna Airbnb Occupancy Rate Trends (2026)
Maximize your bookings by understanding the West Kelowna STR occupancy trends. Seasonal demand shifts significantly influence how often properties are booked. Typically, Augustsees the highest demand (peak season occupancy), while January experiences the lowest (low season). Effective strategies, like adjusting minimum stays or offering promotions, can boost occupancy during slower periods. Here's how different property tiers perform in West Kelowna:
- Best-in-class properties (Top 10%) achieve 83%+ occupancy, indicating high desirability and potentially optimized availability.
- Strong performing properties (Top 25%) maintain 68% or higher occupancy, suggesting good market fit and guest satisfaction.
- Typical properties (Median) have an occupancy rate around 48%.
- Entry-level properties (Bottom 25%) average 28% occupancy, potentially facing higher vacancy.
Average Monthly Occupancy Rate Trend in West Kelowna
Average Daily Rate (ADR) Airbnb Trends in West Kelowna (2026)
Effective short term rental pricing strategy in West Kelowna involves understanding monthly ADR fluctuations. The Average Daily Rate (ADR) for Airbnb in West Kelowna typically peaks in July and dips lowest during January. Leveraging Airbnb dynamic pricing tools or strategies based on this seasonality can significantly boost revenue. Here's a look at the typical nightly rates achieved:
- Best-in-class properties (Top 10%) command rates of $503+ per night, often due to premium features or locations.
- Strong performing properties (Top 25%) achieve nightly rates of $321 or more.
- Typical properties (Median) charge around $197 per night.
- Entry-level properties (Bottom 25%) earn around $126 per night.
Average Daily Rate (ADR) Trend by Month in West Kelowna
Get Live West Kelowna Market Intelligence 👇

Explore Real-time Analytics
Airbnb Seasonality Analysis & Trends in West Kelowna (2026)
Peak Season (August, July, June)
- Revenue averages $6,323 per month
- Occupancy rates average 66.8%
- Daily rates average $300
Shoulder Season
- Revenue averages $3,064 per month
- Occupancy maintains around 45.4%
- Daily rates hold near $251
Low Season (January, February, November)
- Revenue drops to average $1,773 per month
- Occupancy decreases to average 34.3%
- Daily rates adjust to average $234
Seasonality Insights for West Kelowna
- The Airbnb seasonality in West Kelowna shows highly seasonal trends requiring careful strategy. While the sections above show seasonal averages, it's also insightful to look at the extremes:
- During the high season, the absolute peak month showcases West Kelowna's highest earning potential, with monthly revenues capable of climbing to $7,107, occupancy reaching a high of 72.5%, and ADRs peaking at $304.
- Conversely, the slowest single month of the year, typically falling within the low season, marks the market's lowest point. In this month, revenue might dip to $1,347, occupancy could drop to 24.7%, and ADRs may adjust down to $226.
- Understanding both the seasonal averages and these monthly peaks and troughs in revenue, occupancy, and ADR is crucial for maximizing your Airbnb profit potential in West Kelowna.
Seasonal Strategies for Maximizing Profit
- Peak Season: Maximize revenue through premium pricing and potentially longer minimum stays. Ensure high availability.
- Low Season: Offer competitive pricing, special promotions (e.g., extended stay discounts), and flexible cancellation policies. Target off-season travelers like remote workers or budget-conscious guests.
- Shoulder Seasons: Implement dynamic pricing that balances peak and low rates. Target weekend travelers or specific events. Offer slightly more flexible terms than peak season.
- Regularly analyze your own performance against these West Kelowna seasonality benchmarks and adjust your pricing and availability strategy accordingly.
Best Areas for Airbnb Investment in West Kelowna (2026)
Exploring the top neighborhoods for short-term rentals in West Kelowna? This section highlights key areas, outlining why they are attractive for hosts and guests, along with notable local attractions. Consider these locations based on your target guest profile and investment strategy.
| Neighborhood / Area | Why Host Here? (Target Guests & Appeal) | Key Attractions & Landmarks |
|---|---|---|
| Westbank | Vibrant community with access to beaches and parks. Great for families and tourists looking for outdoor activities and waterfront relaxation. | Westside Parks, Johnson Bentley Memorial Aquatic Centre, Gellatly Bay |
| Lakeview Heights | Known for its scenic views of Okanagan Lake and wineries. Attracts wine lovers and those seeking picturesque landscapes and outdoor adventures. | Mission Hill Family Estate, Quails' Gate Winery, Okanagan Lake Hiking Trails |
| Pritchard Park | A family-friendly neighborhood with proximity to schools and parks. Ideal for guests looking for a calm and relaxing atmosphere. | Pritchard Park, Nearby hiking trails |
| Mount Boucherie | Features beautiful views and proximity to outdoor activities like hiking and skiing, appealing to adventurers and nature lovers. | Mount Boucherie hiking trails, Okanagan Lake |
| Peachland | A charming lakeside community with a relaxed vibe. Popular with visitors seeking tranquility and scenic views of the lake. | Peachland Beach, Peachland Lookout, Okanagan Lake |
| Shannon Lake | A suburban area with parks and recreational opportunities, suitable for families and long-term stays. | Shannon Lake Regional Park, Shannon Lake Golf Course |
| Glenrosa | Offering a mixture of residential and beautiful landscapes, appealing for short-term stays and family getaways. | Glenrosa Trail, Nearby wineries |
| Summerland | A quaint town with stunning views and numerous outdoor activities. Great for those who enjoy scenic landscapes and small-town charm. | Summerland Waterfront Resort, Kettle Valley Steam Railway, Okanagan Lake |
Understanding Airbnb License Requirements & STR Laws in West Kelowna (2026)
Yes, West Kelowna, British Columbia, Canada enforces high STR regulations. Obtaining a license and ensuring compliance is almost certainly required according to current 2026 STR laws. Always verify the latest short term rental regulations and Airbnb license requirements directly with local government authorities for West Kelowna to ensure full compliance before hosting.
(Source: AirROI data, 2026, based on 93% licensed listings)
Top Performing Airbnb Properties in West Kelowna (2026)
Benchmark your potential! Explore examples of top-performing Airbnb properties in West Kelownabased on Trailing Twelve Month (TTM) revenue. Analyze their characteristics, revenue, occupancy rate, and ADR to understand what drives success in this market.
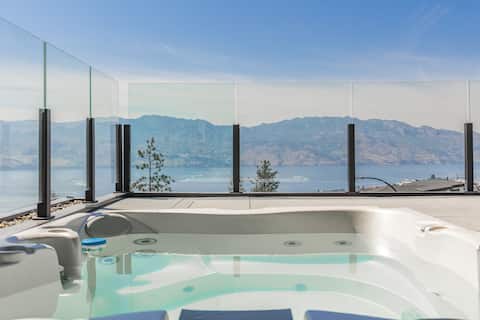
Pool | Hot Tub | Poker Table | King Bed
Entire Place • 4 bedrooms
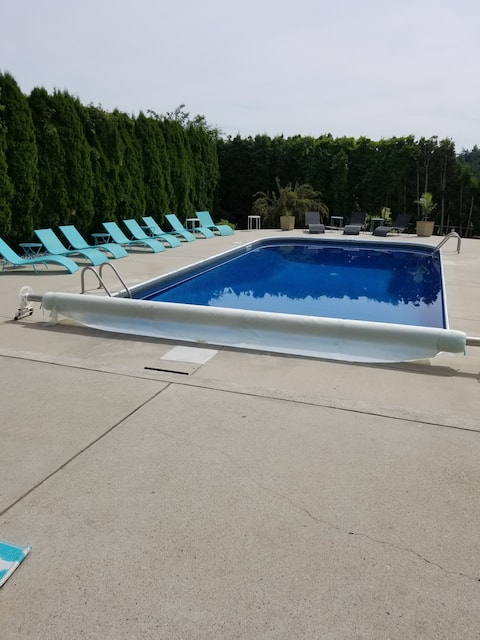
Somer Oasis with swimming pool and hottub
Entire Place • 4 bedrooms
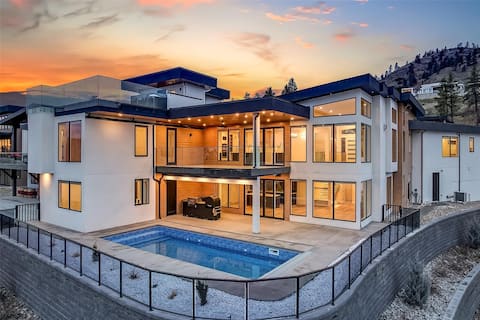
Resort-Style Home with Lake Views
Entire Place • 4 bedrooms
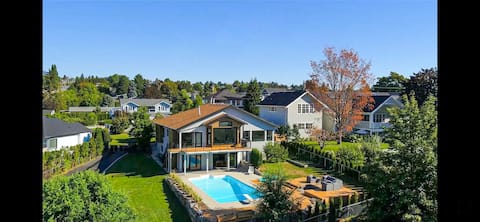
luxury_kelowna_house
Entire Place • 5 bedrooms

Year-Round Heated Pool Hot Tub Vineyard Lake Views
Entire Place • 4 bedrooms

Hillside Villa-Pool|Hot Tub|King Bed|Okanagan View
Entire Place • 4 bedrooms
Note: Performance varies based on location, size, amenities, seasonality, and management quality. Data reflects the past 12 months.
Top Performing Airbnb Hosts in West Kelowna (2026)
Learn from the best! This table showcases top-performing Airbnb hosts in West Kelowna based on the number of properties managed and estimated total revenue over the past year. Analyze their scale and performance metrics.
| Host Name | Properties | Grossing Revenue | Stay Reviews | Avg Rating |
|---|---|---|---|---|
| Amanda | 13 | $736,116 | 371 | 4.76/5.0 |
| Prime Stays Management Inc. | 5 | $464,605 | 71 | 4.65/5.0 |
| Lavasan | 5 | $441,663 | 408 | 4.73/5.0 |
| Stay Locations | 11 | $376,224 | 164 | 4.61/5.0 |
| Jocelyn | 4 | $235,463 | 542 | 4.74/5.0 |
| Shannon | 5 | $217,401 | 140 | 4.80/5.0 |
| Jianxue | 2 | $208,331 | 127 | 4.96/5.0 |
| The Prestige Suites | 1 | $185,124 | 22 | 4.95/5.0 |
| Leslie | 1 | $179,792 | 93 | 4.90/5.0 |
| Aoife | 6 | $173,844 | 57 | 4.93/5.0 |
Analyzing the strategies of top hosts, such as their property selection, pricing, and guest communication, can offer valuable lessons for optimizing your own Airbnb operations in West Kelowna.
Dive Deeper: Advanced West Kelowna STR Market Data (2026)
Ready to unlock more insights? AirROI provides access to advanced metrics and comprehensive Airbnb data for West Kelowna. Explore detailed analytics beyond this report to refine your investment strategy, optimize pricing, and maximize your vacation rental profits.
Explore Advanced MetricsWest Kelowna Short-Term Rental Market Composition (2026): Property & Room Types
Room Type Distribution
Property Type Distribution
Market Composition Insights for West Kelowna
- The West Kelowna Airbnb market composition is heavily skewed towards Entire Home/Apt listings, which make up 87.5% of the 376 active rentals. This indicates strong guest preference for privacy and space.
- Looking at the property type distribution in West Kelowna, Others properties are the most common (34%), reflecting the local real estate landscape.
- Houses represent a significant 33.8% portion, catering likely to families or larger groups.
- The presence of 5.6% Hotel/Boutique listings indicates integration with traditional hospitality.
- Smaller segments like outdoor/unique (combined 3.2%) offer potential for unique stay experiences.
West Kelowna Airbnb Room Capacity Analysis (2026): Bedroom Distribution
Distribution of Listings by Number of Bedrooms
Room Capacity Insights for West Kelowna
- The dominant room capacity in West Kelowna is 2 bedrooms listings, making up 32.7% of the market. This suggests a strong demand for properties suitable for couples or solo travelers.
- Together, 2 bedrooms and 1 bedroom properties represent 57.7% of the active Airbnb listings in West Kelowna, indicating a high concentration in these sizes.
- A significant 31.1% of listings offer 3+ bedrooms, catering to larger groups and families seeking more space in West Kelowna.
West Kelowna Vacation Rental Guest Capacity Trends (2026)
Distribution of Listings by Guest Capacity
Guest Capacity Insights for West Kelowna
- The most common guest capacity trend in West Kelowna vacation rentals is listings accommodating 4 guests (25%). This suggests the primary traveler segment is likely small families or groups.
- Properties designed for 4 guests and 8+ guests dominate the West Kelowna STR market, accounting for 47.3% of listings.
- 44.4% of properties accommodate 6+ guests, serving the market segment for larger families or group travel in West Kelowna.
- On average, properties in West Kelowna are equipped to host 4.7 guests.
West Kelowna Airbnb Booking Patterns (2026): Available vs. Booked Days
Available Days Distribution
Booked Days Distribution
Booking Pattern Insights for West Kelowna
- The most common availability pattern in West Kelowna falls within the 181-270 days range, representing 40.2% of listings. This suggests many properties have significant open periods on their calendars.
- Approximately 75.8% of listings show high availability (181+ days open annually), indicating potential for increased bookings or specific owner usage patterns.
- For booked days, the 91-180 days range is most frequent in West Kelowna (41.8%), reflecting common guest stay durations or potential owner blocking patterns.
- A notable 25.0% of properties secure long booking periods (181+ days booked per year), highlighting successful long-term rental strategies or significant owner usage.
West Kelowna Airbnb Minimum Stay Requirements Analysis
Distribution of Listings by Minimum Night Requirement
1 Night
76 listings
20.2% of total
2 Nights
61 listings
16.2% of total
3 Nights
31 listings
8.2% of total
4-6 Nights
34 listings
9% of total
7-29 Nights
18 listings
4.8% of total
30+ Nights
156 listings
41.5% of total
Key Insights
- The most prevalent minimum stay requirement in West Kelowna is 30+ Nights, adopted by 41.5% of listings. This highlights the market's preference for longer commitments.
- A significant segment (41.5%) caters to monthly stays (30+ nights) in West Kelowna, pointing to opportunities in the extended-stay market.
Recommendations
- Align with the market by considering a 30+ Nights minimum stay, as 41.5% of West Kelowna hosts use this setting.
- If feasible, allowing 1-night stays, especially midweek or during low season, could capture last-minute bookings, as only 20.2% currently do.
- Explore offering discounts for stays of 30+ nights to attract the 41.5% of the market seeking extended stays.
- Adjust minimum nights based on seasonality – potentially shorter during low season and longer during peak demand periods in West Kelowna.
West Kelowna Airbnb Cancellation Policy Trends Analysis (2026)
Super Strict 30 Days
5 listings
1.3% of total
Limited
23 listings
6.1% of total
Super Strict 60 Days
13 listings
3.5% of total
Flexible
40 listings
10.7% of total
Moderate
100 listings
26.7% of total
Firm
166 listings
44.3% of total
Strict
28 listings
7.5% of total
Cancellation Policy Insights for West Kelowna
- The prevailing Airbnb cancellation policy trend in West Kelowna is Firm, used by 44.3% of listings.
- A majority (51.8%) of hosts in West Kelowna utilize Firm or Strict policies, indicating a market where hosts prioritize booking security.
- Strict cancellation policies are quite rare (7.5%), potentially making listings with this policy less competitive unless justified by high demand or property type.
Recommendations for Hosts
- Consider adopting a Firm policy to align with the 44.3% market standard in West Kelowna.
- Using a Strict policy might deter some guests, as only 7.5% of listings use it. Evaluate if potential revenue protection outweighs possible lower booking rates.
- Regularly review your cancellation policy against competitors and market demand shifts in West Kelowna.
West Kelowna STR Booking Lead Time Analysis (2026)
Average Booking Lead Time by Month
Booking Lead Time Insights for West Kelowna
- The overall average booking lead time for vacation rentals in West Kelowna is 58 days.
- Guests book furthest in advance for stays during July (average 81 days), likely coinciding with peak travel demand or local events.
- The shortest booking windows occur for stays in January (average 30 days), indicating more last-minute travel plans during this time.
- Seasonally, Summer (76 days avg.) sees the longest lead times, while Winter (33 days avg.) has the shortest, reflecting typical travel planning cycles.
Recommendations for Hosts
- Use the overall average lead time (58 days) as a baseline for your pricing and availability strategy in West Kelowna.
- For July stays, consider implementing length-of-stay discounts or slightly higher rates for bookings made less than 81 days out to capitalize on advance planning.
- Target marketing efforts for the Summer season well in advance (at least 76 days) to capture early planners.
- Monitor your own booking lead times against these West Kelowna averages to identify opportunities for dynamic pricing adjustments.
Popular & Essential Airbnb Amenities in West Kelowna (2026)
Amenity Prevalence
Amenity Insights for West Kelowna
- Essential amenities in West Kelowna that guests expect include: Wifi, Smoke alarm, Free parking on premises, Air conditioning, Heating. Lacking these (any) could significantly impact bookings.
- Popular amenities like TV, Hot water, Dishes and silverware are common but not universal. Offering these can provide a competitive edge.
Recommendations for Hosts
- Ensure your listing includes all essential amenities for West Kelowna: Wifi, Smoke alarm, Free parking on premises, Air conditioning, Heating.
- Prioritize adding missing essentials: Smoke alarm, Free parking on premises, Air conditioning, Heating.
- Consider adding popular differentiators like TV or Hot water to increase appeal.
- Highlight unique or less common amenities you offer (e.g., hot tub, dedicated workspace, EV charger) in your listing description and photos.
- Regularly check competitor amenities in West Kelowna to stay competitive.
West Kelowna Airbnb Guest Demographics & Profile Analysis (2026)
Guest Profile Summary for West Kelowna
- The typical guest profile for Airbnb in West Kelowna consists of primarily domestic travelers (81%), often arriving from nearby Vancouver, typically belonging to the Post-2000s (Gen Z/Alpha) group (50%), primarily speaking English or French.
- Domestic travelers account for 80.7% of guests.
- Key international markets include Canada (80.7%) and United States (6.9%).
- Top languages spoken are English (63.9%) followed by French (8.3%).
- A significant demographic segment is the Post-2000s (Gen Z/Alpha) group, representing 50% of guests.
Recommendations for Hosts
- Target domestic marketing efforts towards travelers from Vancouver and Calgary.
- Tailor amenities and listing descriptions to appeal to the dominant Post-2000s (Gen Z/Alpha) demographic (e.g., highlight fast WiFi, smart home features, local guides).
- Highlight unique local experiences or amenities relevant to the primary guest profile.
- Consider seasonal promotions aligned with peak travel times for key origin markets.
Nearby Short-Term Rental Market Comparison
How does the West Kelowna Airbnb market stack up against its neighbors? Compare key performance metrics like average monthly revenue, ADR, and occupancy rates in surrounding areas to understand the broader regional STR landscape.
| Market | Active Properties | Monthly Revenue | Daily Rate | Avg. Occupancy |
|---|---|---|---|---|
| Brewster | 12 | $4,214 | $369.24 | 48% |
| Mazama | 32 | $3,962 | $350.44 | 42% |
| Okanogan County | 28 | $3,248 | $366.02 | 36% |
| Pateros | 14 | $3,219 | $333.58 | 42% |
| Revelstoke | 275 | $3,096 | $285.35 | 46% |
| Winthrop | 181 | $2,871 | $284.93 | 38% |
| Westbank First Nation #9 | 69 | $2,825 | $227.51 | 55% |
| Area B (Shelter Bay/Mica Creek) | 75 | $2,753 | $306.38 | 40% |
| Area E (Naramata/Greyback) | 74 | $2,720 | $276.87 | 48% |
| Area M (Beautiful Nicola Valley - North) | 11 | $2,505 | $256.98 | 39% |