Sooke Airbnb Market Analysis 2026: Short Term Rental Data & Vacation Rental Statistics in British Columbia, Canada
Is Airbnb profitable in Sooke in 2026? Explore comprehensive Airbnb analytics for Sooke, British Columbia, Canada to uncover income potential. This 2026 STR market report for Sooke, based on AirROI data from February 2025 to January 2026, reveals key trends in the niche market of 144 active listings.
Whether you're considering an Airbnb investment in Sooke, optimizing your existing vacation rental, or exploring rental arbitrage opportunities, understanding the Sooke Airbnb data is crucial. Navigating the high regulation landscape is key to maximizing your short term rental income potential. Let's dive into the specifics.
Key Sooke Airbnb Performance Metrics Overview
Monthly Airbnb Revenue Variations & Income Potential in Sooke (2026)
Understanding the monthly revenue variations for Airbnb listings in Sooke is key to maximizing your short term rental income potential. Seasonality significantly impacts earnings. Our analysis, based on data from the past 12 months, shows that the peak revenue month for STRs in Sooke is typically August, while January often presents the lowest earnings, highlighting opportunities for strategic pricing adjustments during shoulder and low seasons. Explore the typical Airbnb income in Sooke across different performance tiers:
- Best-in-class properties (Top 10%) achieve $5,156+ monthly, often utilizing dynamic pricing and superior guest experiences.
- Strong performing properties (Top 25%) earn $3,756 or more, indicating effective management and desirable locations/amenities.
- Typical properties (Median) generate around $2,302 per month, representing the average market performance.
- Entry-level properties (Bottom 25%) see earnings around $1,289, often with potential for optimization.
Average Monthly Airbnb Earnings Trend in Sooke
Sooke Airbnb Occupancy Rate Trends (2026)
Maximize your bookings by understanding the Sooke STR occupancy trends. Seasonal demand shifts significantly influence how often properties are booked. Typically, Augustsees the highest demand (peak season occupancy), while January experiences the lowest (low season). Effective strategies, like adjusting minimum stays or offering promotions, can boost occupancy during slower periods. Here's how different property tiers perform in Sooke:
- Best-in-class properties (Top 10%) achieve 84%+ occupancy, indicating high desirability and potentially optimized availability.
- Strong performing properties (Top 25%) maintain 71% or higher occupancy, suggesting good market fit and guest satisfaction.
- Typical properties (Median) have an occupancy rate around 53%.
- Entry-level properties (Bottom 25%) average 31% occupancy, potentially facing higher vacancy.
Average Monthly Occupancy Rate Trend in Sooke
Average Daily Rate (ADR) Airbnb Trends in Sooke (2026)
Effective short term rental pricing strategy in Sooke involves understanding monthly ADR fluctuations. The Average Daily Rate (ADR) for Airbnb in Sooke typically peaks in August and dips lowest during February. Leveraging Airbnb dynamic pricing tools or strategies based on this seasonality can significantly boost revenue. Here's a look at the typical nightly rates achieved:
- Best-in-class properties (Top 10%) command rates of $261+ per night, often due to premium features or locations.
- Strong performing properties (Top 25%) achieve nightly rates of $191 or more.
- Typical properties (Median) charge around $139 per night.
- Entry-level properties (Bottom 25%) earn around $99 per night.
Average Daily Rate (ADR) Trend by Month in Sooke
Get Live Sooke Market Intelligence 👇

Explore Real-time Analytics
Airbnb Seasonality Analysis & Trends in Sooke (2026)
Peak Season (August, July, September)
- Revenue averages $4,227 per month
- Occupancy rates average 68.4%
- Daily rates average $184
Shoulder Season
- Revenue averages $2,576 per month
- Occupancy maintains around 48.5%
- Daily rates hold near $166
Low Season (January, February, April)
- Revenue drops to average $1,806 per month
- Occupancy decreases to average 39.0%
- Daily rates adjust to average $159
Seasonality Insights for Sooke
- The Airbnb seasonality in Sooke shows highly seasonal trends requiring careful strategy. While the sections above show seasonal averages, it's also insightful to look at the extremes:
- During the high season, the absolute peak month showcases Sooke's highest earning potential, with monthly revenues capable of climbing to $4,736, occupancy reaching a high of 73.8%, and ADRs peaking at $187.
- Conversely, the slowest single month of the year, typically falling within the low season, marks the market's lowest point. In this month, revenue might dip to $1,635, occupancy could drop to 33.0%, and ADRs may adjust down to $157.
- Understanding both the seasonal averages and these monthly peaks and troughs in revenue, occupancy, and ADR is crucial for maximizing your Airbnb profit potential in Sooke.
Seasonal Strategies for Maximizing Profit
- Peak Season: Maximize revenue through premium pricing and potentially longer minimum stays. Ensure high availability.
- Low Season: Offer competitive pricing, special promotions (e.g., extended stay discounts), and flexible cancellation policies. Target off-season travelers like remote workers or budget-conscious guests.
- Shoulder Seasons: Implement dynamic pricing that balances peak and low rates. Target weekend travelers or specific events. Offer slightly more flexible terms than peak season.
- Regularly analyze your own performance against these Sooke seasonality benchmarks and adjust your pricing and availability strategy accordingly.
Best Areas for Airbnb Investment in Sooke (2026)
Exploring the top neighborhoods for short-term rentals in Sooke? This section highlights key areas, outlining why they are attractive for hosts and guests, along with notable local attractions. Consider these locations based on your target guest profile and investment strategy.
| Neighborhood / Area | Why Host Here? (Target Guests & Appeal) | Key Attractions & Landmarks |
|---|---|---|
| East Sooke | A beautiful natural area known for its stunning coastal views and proximity to East Sooke Regional Park. Popular among nature lovers and hiking enthusiasts. | East Sooke Regional Park, Aylard Farm, Sooke Potholes Provincial Park, Sooke Harbour, Whiffin Spit |
| Sooke Village | The heart of Sooke featuring local shops, restaurants, and community events. Offers a more urban base close to amenities while still being near nature. | Sooke Village, Sooke Community Centre, Kaltasin Beach, Local markets, Sooke Fine Arts Show |
| Muir Creek | A serene location with access to beautiful beaches and outdoor activities. Ideal for families seeking relaxation and recreational opportunities. | Muir Creek Beach, Sooke River, Muir Creek Park, Scenic hiking trails, Kayaking spots |
| Sooke Basin | This area offers stunning waterfront views and is perfect for travelers seeking tranquility along the water. Ideal for kayaking and wildlife watching. | Sooke Basin, Wildlife watching, Fishing spots, Kayaking adventures, Scenic viewpoints |
| French Beach | Known for its picturesque beach and natural beauty, perfect for weekend getaways and outdoor adventures. | French Beach Provincial Park, Hiking trails, Picnic areas, Wild beach environments, Wildlife viewing |
| Port Renfrew | A bit further but a gem for those looking for adventure and beauty. Offers access to the Juan de Fuca Trail and stunning coastal scenery. | Juan de Fuca Trail, Avatar Grove, Botanical Beach Provincial Park, Recreational fishing, Nature tours |
| Sombrio Beach | Famous for its surfing and wild, rugged natural beauty, attracting outdoor enthusiasts and adventure seekers. | Sombrio Beach, Surfing spots, Hiking trails, Rock formations, Camping areas |
| Otter Point | A quiet residential area offering proximity to beaches and parks, appealing to those wanting a peaceful retreat close to nature. | Otter Point Provincial Park, Beaches, Scenic drives, Picnic areas, Nature trails |
Understanding Airbnb License Requirements & STR Laws in Sooke (2026)
Yes, Sooke, British Columbia, Canada enforces high STR regulations. Obtaining a license and ensuring compliance is almost certainly required according to current 2026 STR laws. Always verify the latest short term rental regulations and Airbnb license requirements directly with local government authorities for Sooke to ensure full compliance before hosting.
(Source: AirROI data, 2026, based on 78% licensed listings)
Top Performing Airbnb Properties in Sooke (2026)
Benchmark your potential! Explore examples of top-performing Airbnb properties in Sookebased on Trailing Twelve Month (TTM) revenue. Analyze their characteristics, revenue, occupancy rate, and ADR to understand what drives success in this market.
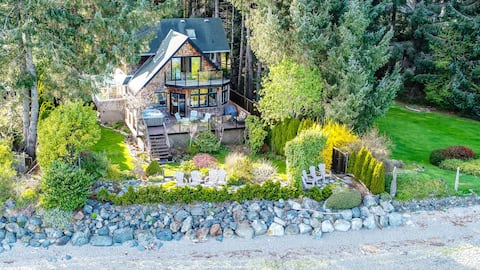
Private Oceanfront Beach House with Hot tub!
Entire Place • 4 bedrooms

Beautiful beachfront Villa on 80 acres of farmland
Entire Place • 4 bedrooms
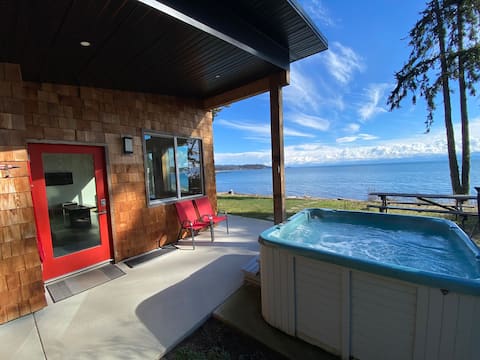
Oceanfront Cabin w/ hot tub, 2 BR w/ King bed
Entire Place • 2 bedrooms
Freedom To Fly
Entire Place • 2 bedrooms

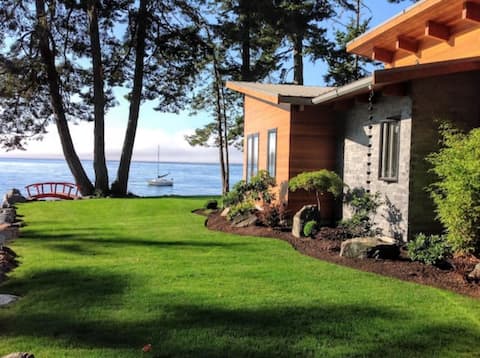
The Covehouse - a secluded oceanfront cottage
Entire Place • 3 bedrooms
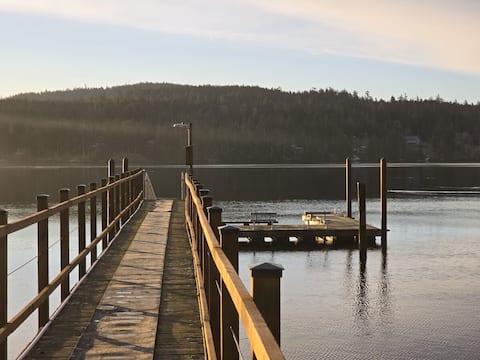
Oceanfront House: Beach Access, Hot Tub & Kayaks
Entire Place • 3 bedrooms
Note: Performance varies based on location, size, amenities, seasonality, and management quality. Data reflects the past 12 months.
Top Performing Airbnb Hosts in Sooke (2026)
Learn from the best! This table showcases top-performing Airbnb hosts in Sooke based on the number of properties managed and estimated total revenue over the past year. Analyze their scale and performance metrics.
| Host Name | Properties | Grossing Revenue | Stay Reviews | Avg Rating |
|---|---|---|---|---|
| True Key | 11 | $290,390 | 119 | 4.63/5.0 |
| Joshua | 7 | $263,314 | 397 | 4.93/5.0 |
| Tiffiny | 5 | $249,991 | 222 | 4.94/5.0 |
| Frederick | 6 | $217,573 | 355 | 4.87/5.0 |
| Becky | 2 | $191,586 | 288 | 4.97/5.0 |
| Kathy | 2 | $90,311 | 318 | 4.97/5.0 |
| Kier-Anna | 1 | $87,407 | 356 | 4.99/5.0 |
| Christine | 1 | $84,844 | 211 | 4.94/5.0 |
| Loki & Kara | 1 | $83,921 | 461 | 4.99/5.0 |
| Steve And Sarah | 2 | $64,649 | 517 | 4.93/5.0 |
Analyzing the strategies of top hosts, such as their property selection, pricing, and guest communication, can offer valuable lessons for optimizing your own Airbnb operations in Sooke.
Dive Deeper: Advanced Sooke STR Market Data (2026)
Ready to unlock more insights? AirROI provides access to advanced metrics and comprehensive Airbnb data for Sooke. Explore detailed analytics beyond this report to refine your investment strategy, optimize pricing, and maximize your vacation rental profits.
Explore Advanced MetricsSooke Short-Term Rental Market Composition (2026): Property & Room Types
Room Type Distribution
Property Type Distribution
Market Composition Insights for Sooke
- The Sooke Airbnb market composition is heavily skewed towards Entire Home/Apt listings, which make up 88.9% of the 144 active rentals. This indicates strong guest preference for privacy and space.
- Looking at the property type distribution in Sooke, House properties are the most common (43.8%), reflecting the local real estate landscape.
- Houses represent a significant 43.8% portion, catering likely to families or larger groups.
- The presence of 13.9% Hotel/Boutique listings indicates integration with traditional hospitality.
- Smaller segments like unique stays (combined 1.4%) offer potential for unique stay experiences.
Sooke Airbnb Room Capacity Analysis (2026): Bedroom Distribution
Distribution of Listings by Number of Bedrooms
Room Capacity Insights for Sooke
- The dominant room capacity in Sooke is 1 bedroom listings, making up 44.4% of the market. This suggests a strong demand for properties suitable for couples or solo travelers.
- Together, 1 bedroom and 2 bedrooms properties represent 76.3% of the active Airbnb listings in Sooke, indicating a high concentration in these sizes.
Sooke Vacation Rental Guest Capacity Trends (2026)
Distribution of Listings by Guest Capacity
Guest Capacity Insights for Sooke
- The most common guest capacity trend in Sooke vacation rentals is listings accommodating 4 guests (31.3%). This suggests the primary traveler segment is likely small families or groups.
- Properties designed for 4 guests and 2 guests dominate the Sooke STR market, accounting for 59.8% of listings.
- 24.3% of properties accommodate 6+ guests, serving the market segment for larger families or group travel in Sooke.
- On average, properties in Sooke are equipped to host 3.7 guests.
Sooke Airbnb Booking Patterns (2026): Available vs. Booked Days
Available Days Distribution
Booked Days Distribution
Booking Pattern Insights for Sooke
- The most common availability pattern in Sooke falls within the 271-366 days range, representing 31.3% of listings. This suggests many properties have significant open periods on their calendars.
- Approximately 62.6% of listings show high availability (181+ days open annually), indicating potential for increased bookings or specific owner usage patterns.
- For booked days, the 91-180 days range is most frequent in Sooke (34%), reflecting common guest stay durations or potential owner blocking patterns.
- A notable 38.2% of properties secure long booking periods (181+ days booked per year), highlighting successful long-term rental strategies or significant owner usage.
Sooke Airbnb Minimum Stay Requirements Analysis
Distribution of Listings by Minimum Night Requirement
1 Night
26 listings
18.1% of total
2 Nights
45 listings
31.3% of total
3 Nights
2 listings
1.4% of total
4-6 Nights
3 listings
2.1% of total
7-29 Nights
4 listings
2.8% of total
30+ Nights
64 listings
44.4% of total
Key Insights
- The most prevalent minimum stay requirement in Sooke is 30+ Nights, adopted by 44.4% of listings. This highlights the market's preference for longer commitments.
- A significant segment (44.4%) caters to monthly stays (30+ nights) in Sooke, pointing to opportunities in the extended-stay market.
Recommendations
- Align with the market by considering a 30+ Nights minimum stay, as 44.4% of Sooke hosts use this setting.
- If feasible, allowing 1-night stays, especially midweek or during low season, could capture last-minute bookings, as only 18.1% currently do.
- A 2-night minimum appears standard (31.3%). Consider this for weekends or peak periods.
- Explore offering discounts for stays of 30+ nights to attract the 44.4% of the market seeking extended stays.
- Adjust minimum nights based on seasonality – potentially shorter during low season and longer during peak demand periods in Sooke.
Sooke Airbnb Cancellation Policy Trends Analysis (2026)
Limited
6 listings
4.2% of total
Super Strict 30 Days
1 listings
0.7% of total
Flexible
30 listings
20.8% of total
Moderate
49 listings
34% of total
Firm
48 listings
33.3% of total
Strict
10 listings
6.9% of total
Cancellation Policy Insights for Sooke
- The prevailing Airbnb cancellation policy trend in Sooke is Moderate, used by 34% of listings.
- There's a relatively balanced mix between guest-friendly (54.8%) and stricter (40.2%) policies, offering choices for different guest needs.
- Strict cancellation policies are quite rare (6.9%), potentially making listings with this policy less competitive unless justified by high demand or property type.
Recommendations for Hosts
- Consider adopting a Moderate policy to align with the 34% market standard in Sooke.
- Using a Strict policy might deter some guests, as only 6.9% of listings use it. Evaluate if potential revenue protection outweighs possible lower booking rates.
- Regularly review your cancellation policy against competitors and market demand shifts in Sooke.
Sooke STR Booking Lead Time Analysis (2026)
Average Booking Lead Time by Month
Booking Lead Time Insights for Sooke
- The overall average booking lead time for vacation rentals in Sooke is 54 days.
- Guests book furthest in advance for stays during August (average 99 days), likely coinciding with peak travel demand or local events.
- The shortest booking windows occur for stays in November (average 33 days), indicating more last-minute travel plans during this time.
- Seasonally, Summer (86 days avg.) sees the longest lead times, while Winter (45 days avg.) has the shortest, reflecting typical travel planning cycles.
Recommendations for Hosts
- Use the overall average lead time (54 days) as a baseline for your pricing and availability strategy in Sooke.
- For August stays, consider implementing length-of-stay discounts or slightly higher rates for bookings made less than 99 days out to capitalize on advance planning.
- Target marketing efforts for the Summer season well in advance (at least 86 days) to capture early planners.
- Monitor your own booking lead times against these Sooke averages to identify opportunities for dynamic pricing adjustments.
Popular & Essential Airbnb Amenities in Sooke (2026)
Amenity Prevalence
Amenity Insights for Sooke
- Essential amenities in Sooke that guests expect include: Smoke alarm, Free parking on premises, Wifi. Lacking these (any) could significantly impact bookings.
- Popular amenities like Heating, Hot water, Dishes and silverware are common but not universal. Offering these can provide a competitive edge.
Recommendations for Hosts
- Ensure your listing includes all essential amenities for Sooke: Smoke alarm, Free parking on premises, Wifi.
- Prioritize adding missing essentials: Smoke alarm, Free parking on premises, Wifi.
- Consider adding popular differentiators like Heating or Hot water to increase appeal.
- Highlight unique or less common amenities you offer (e.g., hot tub, dedicated workspace, EV charger) in your listing description and photos.
- Regularly check competitor amenities in Sooke to stay competitive.
Sooke Airbnb Guest Demographics & Profile Analysis (2026)
Guest Profile Summary for Sooke
- The typical guest profile for Airbnb in Sooke consists of primarily domestic travelers (67%), often arriving from nearby Vancouver, typically belonging to the Post-2000s (Gen Z/Alpha) group (50%), primarily speaking English or French.
- Domestic travelers account for 67.0% of guests.
- Key international markets include Canada (67%) and United States (20.9%).
- Top languages spoken are English (63.5%) followed by French (12.2%).
- A significant demographic segment is the Post-2000s (Gen Z/Alpha) group, representing 50% of guests.
Recommendations for Hosts
- Target domestic marketing efforts towards travelers from Vancouver and Victoria.
- Tailor amenities and listing descriptions to appeal to the dominant Post-2000s (Gen Z/Alpha) demographic (e.g., highlight fast WiFi, smart home features, local guides).
- Highlight unique local experiences or amenities relevant to the primary guest profile.
- Consider seasonal promotions aligned with peak travel times for key origin markets.
Nearby Short-Term Rental Market Comparison
How does the Sooke Airbnb market stack up against its neighbors? Compare key performance metrics like average monthly revenue, ADR, and occupancy rates in surrounding areas to understand the broader regional STR landscape.
| Market | Active Properties | Monthly Revenue | Daily Rate | Avg. Occupancy |
|---|---|---|---|---|
| Erlands Point-Kitsap Lake | 12 | $5,285 | $366.41 | 47% |
| Olalla | 13 | $4,868 | $334.79 | 49% |
| Sudden Valley | 63 | $4,821 | $324.44 | 51% |
| Warm Beach | 10 | $4,811 | $319.50 | 43% |
| Woodinville | 35 | $4,409 | $340.44 | 51% |
| Moclips | 108 | $4,391 | $433.53 | 39% |
| Amanda Park | 11 | $4,328 | $447.54 | 40% |
| Friday Harbor | 235 | $4,233 | $420.06 | 43% |
| Eastsound | 269 | $4,153 | $367.43 | 42% |
| Allyn | 21 | $4,114 | $419.46 | 35% |