Penticton Airbnb Market Analysis 2026: Short Term Rental Data & Vacation Rental Statistics in British Columbia, Canada
Is Airbnb profitable in Penticton in 2026? Explore comprehensive Airbnb analytics for Penticton, British Columbia, Canada to uncover income potential. This 2026 STR market report for Penticton, based on AirROI data from February 2025 to January 2026, reveals key trends in the market of 291 active listings.
Whether you're considering an Airbnb investment in Penticton, optimizing your existing vacation rental, or exploring rental arbitrage opportunities, understanding the Penticton Airbnb data is crucial. Navigating the high regulation landscape is key to maximizing your short term rental income potential. Let's dive into the specifics.
Key Penticton Airbnb Performance Metrics Overview
Monthly Airbnb Revenue Variations & Income Potential in Penticton (2026)
Understanding the monthly revenue variations for Airbnb listings in Penticton is key to maximizing your short term rental income potential. Seasonality significantly impacts earnings. Our analysis, based on data from the past 12 months, shows that the peak revenue month for STRs in Penticton is typically July, while January often presents the lowest earnings, highlighting opportunities for strategic pricing adjustments during shoulder and low seasons. Explore the typical Airbnb income in Penticton across different performance tiers:
- Best-in-class properties (Top 10%) achieve $6,226+ monthly, often utilizing dynamic pricing and superior guest experiences.
- Strong performing properties (Top 25%) earn $3,862 or more, indicating effective management and desirable locations/amenities.
- Typical properties (Median) generate around $2,323 per month, representing the average market performance.
- Entry-level properties (Bottom 25%) see earnings around $1,285, often with potential for optimization.
Average Monthly Airbnb Earnings Trend in Penticton
Penticton Airbnb Occupancy Rate Trends (2026)
Maximize your bookings by understanding the Penticton STR occupancy trends. Seasonal demand shifts significantly influence how often properties are booked. Typically, Julysees the highest demand (peak season occupancy), while January experiences the lowest (low season). Effective strategies, like adjusting minimum stays or offering promotions, can boost occupancy during slower periods. Here's how different property tiers perform in Penticton:
- Best-in-class properties (Top 10%) achieve 83%+ occupancy, indicating high desirability and potentially optimized availability.
- Strong performing properties (Top 25%) maintain 68% or higher occupancy, suggesting good market fit and guest satisfaction.
- Typical properties (Median) have an occupancy rate around 48%.
- Entry-level properties (Bottom 25%) average 27% occupancy, potentially facing higher vacancy.
Average Monthly Occupancy Rate Trend in Penticton
Average Daily Rate (ADR) Airbnb Trends in Penticton (2026)
Effective short term rental pricing strategy in Penticton involves understanding monthly ADR fluctuations. The Average Daily Rate (ADR) for Airbnb in Penticton typically peaks in August and dips lowest during February. Leveraging Airbnb dynamic pricing tools or strategies based on this seasonality can significantly boost revenue. Here's a look at the typical nightly rates achieved:
- Best-in-class properties (Top 10%) command rates of $387+ per night, often due to premium features or locations.
- Strong performing properties (Top 25%) achieve nightly rates of $244 or more.
- Typical properties (Median) charge around $160 per night.
- Entry-level properties (Bottom 25%) earn around $108 per night.
Average Daily Rate (ADR) Trend by Month in Penticton
Get Live Penticton Market Intelligence 👇

Explore Real-time Analytics
Airbnb Seasonality Analysis & Trends in Penticton (2026)
Peak Season (July, August, September)
- Revenue averages $5,081 per month
- Occupancy rates average 66.0%
- Daily rates average $227
Shoulder Season
- Revenue averages $2,668 per month
- Occupancy maintains around 46.2%
- Daily rates hold near $201
Low Season (January, February, December)
- Revenue drops to average $1,808 per month
- Occupancy decreases to average 32.4%
- Daily rates adjust to average $194
Seasonality Insights for Penticton
- The Airbnb seasonality in Penticton shows highly seasonal trends requiring careful strategy. While the sections above show seasonal averages, it's also insightful to look at the extremes:
- During the high season, the absolute peak month showcases Penticton's highest earning potential, with monthly revenues capable of climbing to $5,711, occupancy reaching a high of 71.2%, and ADRs peaking at $230.
- Conversely, the slowest single month of the year, typically falling within the low season, marks the market's lowest point. In this month, revenue might dip to $1,572, occupancy could drop to 23.7%, and ADRs may adjust down to $188.
- Understanding both the seasonal averages and these monthly peaks and troughs in revenue, occupancy, and ADR is crucial for maximizing your Airbnb profit potential in Penticton.
Seasonal Strategies for Maximizing Profit
- Peak Season: Maximize revenue through premium pricing and potentially longer minimum stays. Ensure high availability.
- Low Season: Offer competitive pricing, special promotions (e.g., extended stay discounts), and flexible cancellation policies. Target off-season travelers like remote workers or budget-conscious guests.
- Shoulder Seasons: Implement dynamic pricing that balances peak and low rates. Target weekend travelers or specific events. Offer slightly more flexible terms than peak season.
- Regularly analyze your own performance against these Penticton seasonality benchmarks and adjust your pricing and availability strategy accordingly.
Best Areas for Airbnb Investment in Penticton (2026)
Exploring the top neighborhoods for short-term rentals in Penticton? This section highlights key areas, outlining why they are attractive for hosts and guests, along with notable local attractions. Consider these locations based on your target guest profile and investment strategy.
| Neighborhood / Area | Why Host Here? (Target Guests & Appeal) | Key Attractions & Landmarks |
|---|---|---|
| Okanagan Beach | A popular beach destination known for its scenic beauty and outdoor activities. Ideal for families and tourists who enjoy water sports, hiking, and relaxing by the lake. | Okanagan Lake, Penticton Marina, Skaha Lake, Kettle Valley Rail Trail, Penticton River Channel |
| Downtown Penticton | The heart of the city, offering vibrant dining, shopping, and entertainment options. A great base for visitors to explore local culture and events. | Penticton Farmer's Market, Okanagan Wine Festival, Penticton Art Gallery, Theatre Penticton, Local breweries and wineries |
| Skaha Lakeshore | A picturesque area with beautiful beaches and parklands along Skaha Lake. Perfect for guests looking for relaxation and access to nature. | Skaha Lake Park, Skaha Beach, Penticton BMX Track, Water sports rentals, Hiking trails |
| Naramata | A charming village known for its vineyards and wineries. Attracts wine enthusiasts and those seeking a quaint, countryside experience. | Naramata Bench wineries, Kettle Valley Winery, Naramata Heritage Trail, Farms and markets, Beautiful lake views |
| Penticton Indian Band Lands | Unique cultural experience with opportunities to explore Indigenous heritage and art. Offers visitors a different perspective on the Okanagan Valley. | Cultural events and experiences, Indigenous art galleries, Nature trails, Penticton River Channel access, Outdoor festivals |
| Penticton Lakeside Resort | Popular hotel and resort destination on the waterfront. A preferred choice for travelers seeking luxury with direct access to beaches and water activities. | Lakeside beaches, Spa services, Dining options, Waterfront activities, Events and conferences |
| Vaseux Lake | A quieter area ideal for those looking to escape the busier parts of Penticton, perfect for nature lovers and birdwatchers. | Vaseux Lake Provincial Park, Birdwatching spots, Hiking trails, Nature photography, Wildlife viewing |
| Penticton Arts District | A hub for creativity and culture, featuring artists, galleries, and art-related events. Ideal for those interested in the local art scene. | Penticton Art Gallery, Art Walks and Workshops, Local artist studios, Cultural festivals, Community art events |
Understanding Airbnb License Requirements & STR Laws in Penticton (2026)
Yes, Penticton, British Columbia, Canada enforces high STR regulations. Obtaining a license and ensuring compliance is almost certainly required according to current 2026 STR laws. Always verify the latest short term rental regulations and Airbnb license requirements directly with local government authorities for Penticton to ensure full compliance before hosting.
(Source: AirROI data, 2026, based on 85% licensed listings)
Top Performing Airbnb Properties in Penticton (2026)
Benchmark your potential! Explore examples of top-performing Airbnb properties in Pentictonbased on Trailing Twelve Month (TTM) revenue. Analyze their characteristics, revenue, occupancy rate, and ADR to understand what drives success in this market.
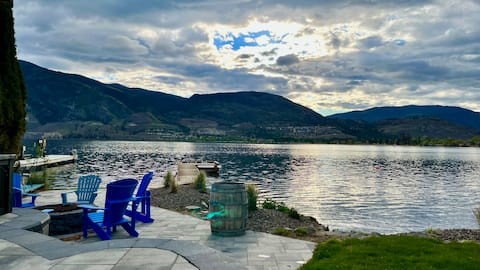
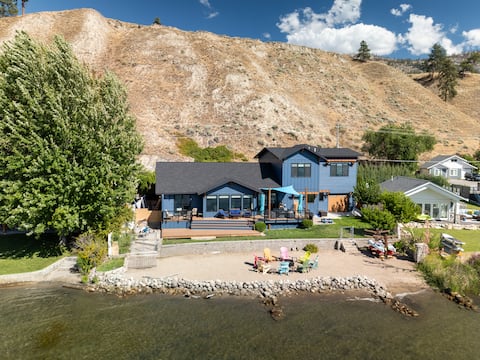
Perfect vacation home & 100ft of private lakefront
Entire Place • 5 bedrooms

Stunning Modern Farmhouse in Perfect Location
Entire Place • 3 bedrooms
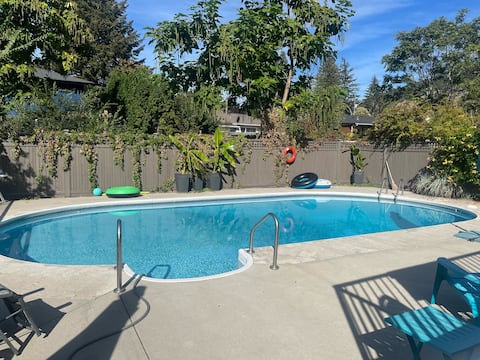
Ultimate Pool House – 5 Kings, Near Beach/Wineries
Entire Place • 5 bedrooms

Luxurious 4BR Beach Retreat w/ Backyard & Balcony
Entire Place • 4 bedrooms

Private Lakefront Beach House off Naramata Bench
Entire Place • 4 bedrooms
Sunshine Lakehouse on Skaha, Penticton
Entire Place • 5 bedrooms
Note: Performance varies based on location, size, amenities, seasonality, and management quality. Data reflects the past 12 months.
Top Performing Airbnb Hosts in Penticton (2026)
Learn from the best! This table showcases top-performing Airbnb hosts in Penticton based on the number of properties managed and estimated total revenue over the past year. Analyze their scale and performance metrics.
| Host Name | Properties | Grossing Revenue | Stay Reviews | Avg Rating |
|---|---|---|---|---|
| Jason | 7 | $392,799 | 108 | 4.96/5.0 |
| Kyle | 5 | $226,292 | 197 | 4.95/5.0 |
| Paul Benjamin | 1 | $147,778 | 39 | 4.77/5.0 |
| Lianna | 3 | $145,736 | 440 | 4.95/5.0 |
| SunSage Vacation Rentals Ltd | 4 | $128,606 | 238 | 4.95/5.0 |
| Adam | 1 | $114,342 | 5 | 5.00/5.0 |
| Tina And Steve | 1 | $107,475 | 33 | 5.00/5.0 |
| Meghan | 1 | $104,162 | 80 | 4.98/5.0 |
| Alex | 4 | $102,848 | 128 | 4.90/5.0 |
| Michael | 1 | $99,327 | 53 | 4.96/5.0 |
Analyzing the strategies of top hosts, such as their property selection, pricing, and guest communication, can offer valuable lessons for optimizing your own Airbnb operations in Penticton.
Dive Deeper: Advanced Penticton STR Market Data (2026)
Ready to unlock more insights? AirROI provides access to advanced metrics and comprehensive Airbnb data for Penticton. Explore detailed analytics beyond this report to refine your investment strategy, optimize pricing, and maximize your vacation rental profits.
Explore Advanced MetricsPenticton Short-Term Rental Market Composition (2026): Property & Room Types
Room Type Distribution
Property Type Distribution
Market Composition Insights for Penticton
- The Penticton Airbnb market composition is heavily skewed towards Entire Home/Apt listings, which make up 84.9% of the 291 active rentals. This indicates strong guest preference for privacy and space.
- Looking at the property type distribution in Penticton, House properties are the most common (47.1%), reflecting the local real estate landscape.
- Houses represent a significant 47.1% portion, catering likely to families or larger groups.
- The presence of 19.9% Hotel/Boutique listings indicates integration with traditional hospitality.
- Smaller segments like outdoor/unique (combined 0.7%) offer potential for unique stay experiences.
Penticton Airbnb Room Capacity Analysis (2026): Bedroom Distribution
Distribution of Listings by Number of Bedrooms
Room Capacity Insights for Penticton
- The dominant room capacity in Penticton is 1 bedroom listings, making up 32.6% of the market. This suggests a strong demand for properties suitable for couples or solo travelers.
- Together, 1 bedroom and 2 bedrooms properties represent 64.9% of the active Airbnb listings in Penticton, indicating a high concentration in these sizes.
- A significant 28.5% of listings offer 3+ bedrooms, catering to larger groups and families seeking more space in Penticton.
Penticton Vacation Rental Guest Capacity Trends (2026)
Distribution of Listings by Guest Capacity
Guest Capacity Insights for Penticton
- The most common guest capacity trend in Penticton vacation rentals is listings accommodating 4 guests (35.4%). This suggests the primary traveler segment is likely small families or groups.
- Properties designed for 4 guests and 6 guests dominate the Penticton STR market, accounting for 59.1% of listings.
- 32.3% of properties accommodate 6+ guests, serving the market segment for larger families or group travel in Penticton.
- On average, properties in Penticton are equipped to host 4.2 guests.
Penticton Airbnb Booking Patterns (2026): Available vs. Booked Days
Available Days Distribution
Booked Days Distribution
Booking Pattern Insights for Penticton
- The most common availability pattern in Penticton falls within the 271-366 days range, representing 40.5% of listings. This suggests many properties have significant open periods on their calendars.
- Approximately 74.5% of listings show high availability (181+ days open annually), indicating potential for increased bookings or specific owner usage patterns.
- For booked days, the 91-180 days range is most frequent in Penticton (33.7%), reflecting common guest stay durations or potential owner blocking patterns.
- A notable 27.1% of properties secure long booking periods (181+ days booked per year), highlighting successful long-term rental strategies or significant owner usage.
Penticton Airbnb Minimum Stay Requirements Analysis
Distribution of Listings by Minimum Night Requirement
1 Night
39 listings
13.4% of total
2 Nights
40 listings
13.7% of total
3 Nights
24 listings
8.2% of total
4-6 Nights
27 listings
9.3% of total
7-29 Nights
25 listings
8.6% of total
30+ Nights
136 listings
46.7% of total
Key Insights
- The most prevalent minimum stay requirement in Penticton is 30+ Nights, adopted by 46.7% of listings. This highlights the market's preference for longer commitments.
- A significant segment (46.7%) caters to monthly stays (30+ nights) in Penticton, pointing to opportunities in the extended-stay market.
Recommendations
- Align with the market by considering a 30+ Nights minimum stay, as 46.7% of Penticton hosts use this setting.
- If feasible, allowing 1-night stays, especially midweek or during low season, could capture last-minute bookings, as only 13.4% currently do.
- Explore offering discounts for stays of 30+ nights to attract the 46.7% of the market seeking extended stays.
- Adjust minimum nights based on seasonality – potentially shorter during low season and longer during peak demand periods in Penticton.
Penticton Airbnb Cancellation Policy Trends Analysis (2026)
Super Strict 30 Days
12 listings
4.1% of total
Limited
19 listings
6.5% of total
Super Strict 60 Days
1 listings
0.3% of total
Flexible
26 listings
8.9% of total
Moderate
83 listings
28.5% of total
Firm
125 listings
43% of total
Strict
25 listings
8.6% of total
Cancellation Policy Insights for Penticton
- The prevailing Airbnb cancellation policy trend in Penticton is Firm, used by 43% of listings.
- A majority (51.6%) of hosts in Penticton utilize Firm or Strict policies, indicating a market where hosts prioritize booking security.
- Strict cancellation policies are quite rare (8.6%), potentially making listings with this policy less competitive unless justified by high demand or property type.
Recommendations for Hosts
- Consider adopting a Firm policy to align with the 43% market standard in Penticton.
- Using a Strict policy might deter some guests, as only 8.6% of listings use it. Evaluate if potential revenue protection outweighs possible lower booking rates.
- Regularly review your cancellation policy against competitors and market demand shifts in Penticton.
Penticton STR Booking Lead Time Analysis (2026)
Average Booking Lead Time by Month
Booking Lead Time Insights for Penticton
- The overall average booking lead time for vacation rentals in Penticton is 67 days.
- Guests book furthest in advance for stays during July (average 104 days), likely coinciding with peak travel demand or local events.
- The shortest booking windows occur for stays in January (average 28 days), indicating more last-minute travel plans during this time.
- Seasonally, Summer (93 days avg.) sees the longest lead times, while Winter (39 days avg.) has the shortest, reflecting typical travel planning cycles.
Recommendations for Hosts
- Use the overall average lead time (67 days) as a baseline for your pricing and availability strategy in Penticton.
- For July stays, consider implementing length-of-stay discounts or slightly higher rates for bookings made less than 104 days out to capitalize on advance planning.
- Target marketing efforts for the Summer season well in advance (at least 93 days) to capture early planners.
- Monitor your own booking lead times against these Penticton averages to identify opportunities for dynamic pricing adjustments.
Popular & Essential Airbnb Amenities in Penticton (2026)
Amenity Prevalence
Amenity Insights for Penticton
- Essential amenities in Penticton that guests expect include: Smoke alarm, Wifi, TV, Air conditioning. Lacking these (any) could significantly impact bookings.
- Popular amenities like Heating, Free parking on premises, Coffee maker are common but not universal. Offering these can provide a competitive edge.
Recommendations for Hosts
- Ensure your listing includes all essential amenities for Penticton: Smoke alarm, Wifi, TV, Air conditioning.
- Prioritize adding missing essentials: Smoke alarm, Wifi, TV, Air conditioning.
- Consider adding popular differentiators like Heating or Free parking on premises to increase appeal.
- Highlight unique or less common amenities you offer (e.g., hot tub, dedicated workspace, EV charger) in your listing description and photos.
- Regularly check competitor amenities in Penticton to stay competitive.
Penticton Airbnb Guest Demographics & Profile Analysis (2026)
Guest Profile Summary for Penticton
- The typical guest profile for Airbnb in Penticton consists of primarily domestic travelers (85%), often arriving from nearby Vancouver, typically belonging to the Post-2000s (Gen Z/Alpha) group (50%), primarily speaking English or French.
- Domestic travelers account for 85.2% of guests.
- Key international markets include Canada (85.2%) and United States (9.2%).
- Top languages spoken are English (71.9%) followed by French (8.4%).
- A significant demographic segment is the Post-2000s (Gen Z/Alpha) group, representing 50% of guests.
Recommendations for Hosts
- Target domestic marketing efforts towards travelers from Vancouver and Calgary.
- Tailor amenities and listing descriptions to appeal to the dominant Post-2000s (Gen Z/Alpha) demographic (e.g., highlight fast WiFi, smart home features, local guides).
- Highlight unique local experiences or amenities relevant to the primary guest profile.
- Consider seasonal promotions aligned with peak travel times for key origin markets.
Nearby Short-Term Rental Market Comparison
How does the Penticton Airbnb market stack up against its neighbors? Compare key performance metrics like average monthly revenue, ADR, and occupancy rates in surrounding areas to understand the broader regional STR landscape.
| Market | Active Properties | Monthly Revenue | Daily Rate | Avg. Occupancy |
|---|---|---|---|---|
| Brewster | 12 | $4,214 | $369.24 | 48% |
| Mazama | 32 | $3,962 | $350.44 | 42% |
| Okanogan County | 28 | $3,248 | $366.02 | 36% |
| Pateros | 14 | $3,219 | $333.58 | 42% |
| Revelstoke | 275 | $3,096 | $285.35 | 46% |
| Winthrop | 181 | $2,871 | $284.93 | 38% |
| Westbank First Nation #9 | 69 | $2,825 | $227.51 | 55% |
| Area B (Shelter Bay/Mica Creek) | 75 | $2,753 | $306.38 | 40% |
| Area E (Naramata/Greyback) | 74 | $2,720 | $276.87 | 48% |
| West Kelowna | 376 | $2,682 | $251.30 | 50% |