Grand Forks Airbnb Market Analysis 2025: Short Term Rental Data & Vacation Rental Statistics in British Columbia, Canada
Is Airbnb profitable in Grand Forks in 2025? Explore comprehensive Airbnb analytics for Grand Forks, British Columbia, Canada to uncover income potential. This 2025 STR market report for Grand Forks, based on AirROI data from November 2024 to October 2025, reveals key trends in the niche market of 17 active listings.
Whether you're considering an Airbnb investment in Grand Forks, optimizing your existing vacation rental, or exploring rental arbitrage opportunities, understanding the Grand Forks Airbnb data is crucial. Navigating the high regulation landscape is key to maximizing your short term rental income potential. Let's dive into the specifics.
Key Grand Forks Airbnb Performance Metrics Overview
Monthly Airbnb Revenue Variations & Income Potential in Grand Forks (2025)
Understanding the monthly revenue variations for Airbnb listings in Grand Forks is key to maximizing your short term rental income potential. Seasonality significantly impacts earnings. Our analysis, based on data from the past 12 months, shows that the peak revenue month for STRs in Grand Forks is typically August, while January often presents the lowest earnings, highlighting opportunities for strategic pricing adjustments during shoulder and low seasons. Explore the typical Airbnb income in Grand Forks across different performance tiers:
- Best-in-class properties (Top 10%) achieve $2,597+ monthly, often utilizing dynamic pricing and superior guest experiences.
- Strong performing properties (Top 25%) earn $2,148 or more, indicating effective management and desirable locations/amenities.
- Typical properties (Median) generate around $1,679 per month, representing the average market performance.
- Entry-level properties (Bottom 25%) see earnings around $1,111, often with potential for optimization.
Average Monthly Airbnb Earnings Trend in Grand Forks
Grand Forks Airbnb Occupancy Rate Trends (2025)
Maximize your bookings by understanding the Grand Forks STR occupancy trends. Seasonal demand shifts significantly influence how often properties are booked. Typically, Augustsees the highest demand (peak season occupancy), while January experiences the lowest (low season). Effective strategies, like adjusting minimum stays or offering promotions, can boost occupancy during slower periods. Here's how different property tiers perform in Grand Forks:
- Best-in-class properties (Top 10%) achieve 79%+ occupancy, indicating high desirability and potentially optimized availability.
- Strong performing properties (Top 25%) maintain 66% or higher occupancy, suggesting good market fit and guest satisfaction.
- Typical properties (Median) have an occupancy rate around 49%.
- Entry-level properties (Bottom 25%) average 32% occupancy, potentially facing higher vacancy.
Average Monthly Occupancy Rate Trend in Grand Forks
Average Daily Rate (ADR) Airbnb Trends in Grand Forks (2025)
Effective short term rental pricing strategy in Grand Forks involves understanding monthly ADR fluctuations. The Average Daily Rate (ADR) for Airbnb in Grand Forks typically peaks in November and dips lowest during June. Leveraging Airbnb dynamic pricing tools or strategies based on this seasonality can significantly boost revenue. Here's a look at the typical nightly rates achieved:
- Best-in-class properties (Top 10%) command rates of $224+ per night, often due to premium features or locations.
- Strong performing properties (Top 25%) achieve nightly rates of $137 or more.
- Typical properties (Median) charge around $96 per night.
- Entry-level properties (Bottom 25%) earn around $83 per night.
Average Daily Rate (ADR) Trend by Month in Grand Forks
Get Live Grand Forks Market Intelligence 👇
Explore Real-time Analytics
Airbnb Seasonality Analysis & Trends in Grand Forks (2025)
Peak Season (August, July, April)
- Revenue averages $2,461 per month
- Occupancy rates average 63.6%
- Daily rates average $129
Shoulder Season
- Revenue averages $1,733 per month
- Occupancy maintains around 52.7%
- Daily rates hold near $126
Low Season (January, November, December)
- Revenue drops to average $1,106 per month
- Occupancy decreases to average 32.6%
- Daily rates adjust to average $136
Seasonality Insights for Grand Forks
- The Airbnb seasonality in Grand Forks shows highly seasonal trends requiring careful strategy. While the sections above show seasonal averages, it's also insightful to look at the extremes:
- During the high season, the absolute peak month showcases Grand Forks's highest earning potential, with monthly revenues capable of climbing to $2,639, occupancy reaching a high of 65.5%, and ADRs peaking at $137.
- Conversely, the slowest single month of the year, typically falling within the low season, marks the market's lowest point. In this month, revenue might dip to $873, occupancy could drop to 27.9%, and ADRs may adjust down to $116.
- Understanding both the seasonal averages and these monthly peaks and troughs in revenue, occupancy, and ADR is crucial for maximizing your Airbnb profit potential in Grand Forks.
Seasonal Strategies for Maximizing Profit
- Peak Season: Maximize revenue through premium pricing and potentially longer minimum stays. Ensure high availability.
- Low Season: Offer competitive pricing, special promotions (e.g., extended stay discounts), and flexible cancellation policies. Target off-season travelers like remote workers or budget-conscious guests.
- Shoulder Seasons: Implement dynamic pricing that balances peak and low rates. Target weekend travelers or specific events. Offer slightly more flexible terms than peak season.
- Regularly analyze your own performance against these Grand Forks seasonality benchmarks and adjust your pricing and availability strategy accordingly.
Best Areas for Airbnb Investment in Grand Forks (2025)
Exploring the top neighborhoods for short-term rentals in Grand Forks? This section highlights key areas, outlining why they are attractive for hosts and guests, along with notable local attractions. Consider these locations based on your target guest profile and investment strategy.
| Neighborhood / Area | Why Host Here? (Target Guests & Appeal) | Key Attractions & Landmarks |
|---|---|---|
| South Grand Forks | A charming area close to the river and outdoor activities, attracting those who enjoy nature and recreational pursuits. Ideal for visitors seeking a small-town experience with access to beautiful landscapes. | Grand Forks Heritage Centre, Boundary Museum Society, Kettle River, Christina Lake, Phoenix Mountain Ski Resort |
| Downtown Grand Forks | The heart of the city with convenient access to shops, restaurants, and local events. Attracts both tourists and locals for its vibrant atmosphere and community feel. | Grand Forks Art Gallery, local cafes and shops, Parks and Recreation facilities, Columbia Valley |
| Rural Grand Forks | Large properties with scenic views, perfect for vacationers seeking rural retreat experiences. Attracts guests looking for peace, tranquility, and a break from city life. | vineyards and wineries, hiking trails, farms and orchards, wildlife viewing, craft markets |
| Boundary Bay | An area known for its stunning landscapes and recreational opportunities, including fishing and boating. Ideal for nature lovers and adventure seekers. | Boundary Bay Regional Park, fishing spots, hiking trails, wildlife watching, scenic views |
| Grand Forks City Park | A beautiful park area frequented by families and outdoor enthusiasts. Great for travelers looking for outdoor activities and community events. | City Park swimming pool, sports fields, picnic areas, playgrounds |
| Christina Lake | Famous for its warm waters and family-friendly atmosphere, perfect for summer vacations. Attracts visitors looking for water sports and relaxation. | Christina Lake Provincial Park, beaches, water sports rentals, local cafes and shops |
| Phoenix Mountain | A popular winter destination for skiing and snowboarding, attracting winter sports enthusiasts. Ideal for weekend getaways and seasonal travelers. | Phoenix Mountain Ski Resort, winter hiking trails, local eateries, snowshoeing paths |
| Kettle Valley Rail Trail | An extensive biking and hiking trail offering scenic routes for outdoor enthusiasts. Great for those looking to explore the natural beauty of the region. | Kettle Valley Rail Trail, biking, hiking, foliage scenery, wildlife viewing |
Understanding Airbnb License Requirements & STR Laws in Grand Forks (2025)
Yes, Grand Forks, British Columbia, Canada enforces high STR regulations. Obtaining a license and ensuring compliance is almost certainly required according to current 2025 STR laws. Always verify the latest short term rental regulations and Airbnb license requirements directly with local government authorities for Grand Forks to ensure full compliance before hosting.
(Source: AirROI data, 2025, based on 71% licensed listings)
Top Performing Airbnb Properties in Grand Forks (2025)
Benchmark your potential! Explore examples of top-performing Airbnb properties in Grand Forksbased on Trailing Twelve Month (TTM) revenue. Analyze their characteristics, revenue, occupancy rate, and ADR to understand what drives success in this market.
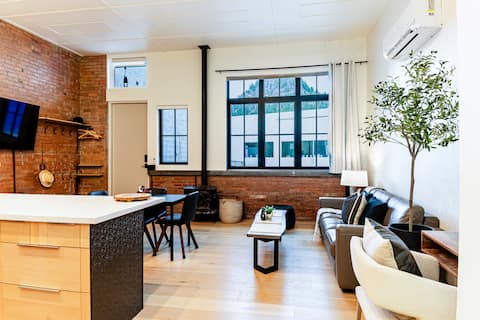
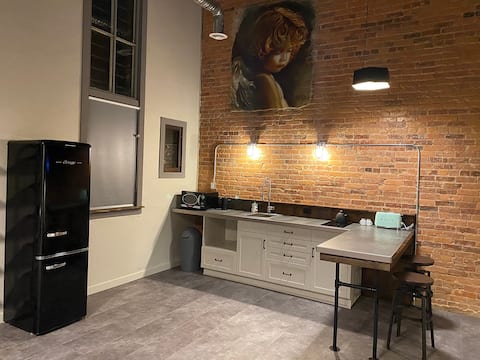
Modern industrial suite in Grand Forks
Entire Place • 1 bedroom
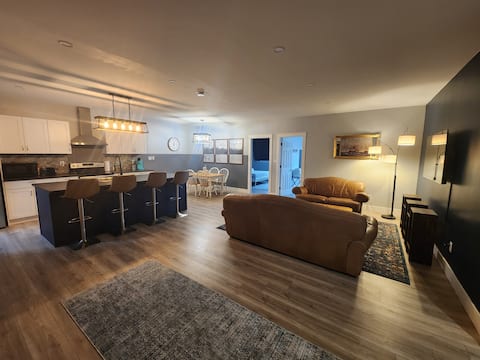
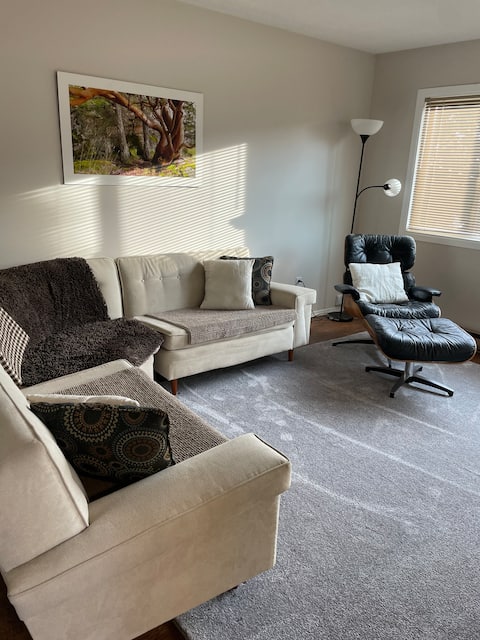
Kettle Blue Downtown — Cozy & Modern 2BR Retreat
Entire Place • 2 bedrooms
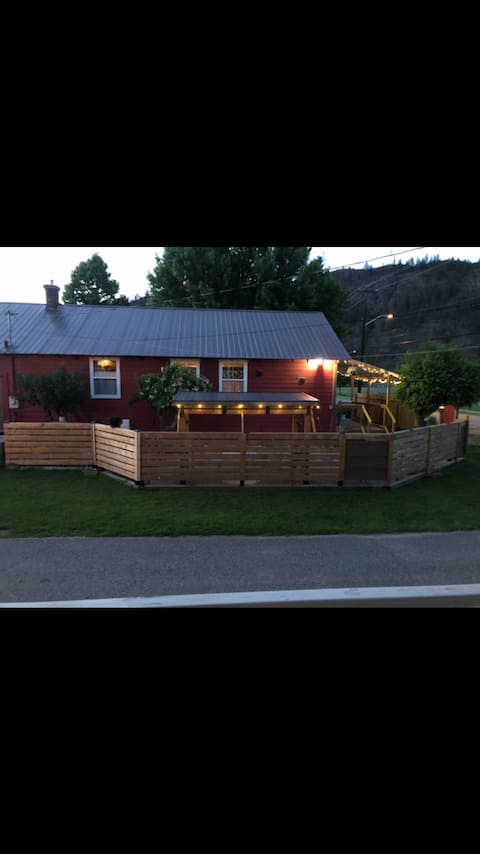
The Boundary Bunkhouse
Entire Place • 2 bedrooms
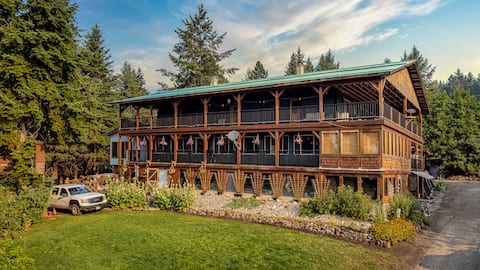
8BR Lodge: Therapeutic Massage & Scenic Views
Entire Place • 8 bedrooms
Grand Forks Skyview
Entire Place • 2 bedrooms
The Grand Hideout in Downtown Grand Forks
Entire Place • 1 bedroom
Note: Performance varies based on location, size, amenities, seasonality, and management quality. Data reflects the past 12 months.
Top Performing Airbnb Hosts in Grand Forks (2025)
Learn from the best! This table showcases top-performing Airbnb hosts in Grand Forks based on the number of properties managed and estimated total revenue over the past year. Analyze their scale and performance metrics.
| Host Name | Properties | Grossing Revenue | Stay Reviews | Avg Rating |
|---|---|---|---|---|
| Jan | 2 | $41,502 | 34 | 4.91/5.0 |
| Xandre | 2 | $30,886 | 42 | 4.88/5.0 |
| Leah | 2 | $29,380 | 19 | 4.87/5.0 |
| Tom | 1 | $24,204 | 33 | 5.00/5.0 |
| Jocelyn W | 1 | $23,692 | 39 | 4.54/5.0 |
| Izzy | 1 | $19,319 | 260 | 4.89/5.0 |
| Peter | 1 | $19,029 | 45 | 4.80/5.0 |
| Robbi | 1 | $17,456 | 23 | 4.96/5.0 |
| Wanda | 1 | $16,245 | 185 | 4.91/5.0 |
| Ginny | 1 | $11,823 | 88 | 4.90/5.0 |
Analyzing the strategies of top hosts, such as their property selection, pricing, and guest communication, can offer valuable lessons for optimizing your own Airbnb operations in Grand Forks.
Dive Deeper: Advanced Grand Forks STR Market Data (2025)
Ready to unlock more insights? AirROI provides access to advanced metrics and comprehensive Airbnb data for Grand Forks. Explore detailed analytics beyond this report to refine your investment strategy, optimize pricing, and maximize your vacation rental profits.
Explore Advanced MetricsGrand Forks Short-Term Rental Market Composition (2025): Property & Room Types
Room Type Distribution
Property Type Distribution
Market Composition Insights for Grand Forks
- The Grand Forks Airbnb market composition is heavily skewed towards Entire Home/Apt listings, which make up 88.2% of the 17 active rentals. This indicates strong guest preference for privacy and space.
- Looking at the property type distribution in Grand Forks, Apartment/Condo properties are the most common (41.2%), reflecting the local real estate landscape.
- Houses represent a significant 29.4% portion, catering likely to families or larger groups.
- The presence of 5.9% Hotel/Boutique listings indicates integration with traditional hospitality.
Grand Forks Airbnb Room Capacity Analysis (2025): Bedroom Distribution
Distribution of Listings by Number of Bedrooms
Room Capacity Insights for Grand Forks
- The dominant room capacity in Grand Forks is 1 bedroom listings, making up 52.9% of the market. This suggests a strong demand for properties suitable for couples or solo travelers.
- Together, 1 bedroom and 2 bedrooms properties represent 76.4% of the active Airbnb listings in Grand Forks, indicating a high concentration in these sizes.
- With over half the market (52.9%) consisting of studios or 1-bedroom units, Grand Forks is particularly well-suited for individuals or couples.
Grand Forks Vacation Rental Guest Capacity Trends (2025)
Distribution of Listings by Guest Capacity
Guest Capacity Insights for Grand Forks
- The most common guest capacity trend in Grand Forks vacation rentals is listings accommodating 4 guests (52.9%). This suggests the primary traveler segment is likely small families or groups.
- Properties designed for 4 guests and 8+ guests dominate the Grand Forks STR market, accounting for 64.7% of listings.
- 11.8% of properties accommodate 6+ guests, serving the market segment for larger families or group travel in Grand Forks.
- On average, properties in Grand Forks are equipped to host 3.7 guests.
Grand Forks Airbnb Booking Patterns (2025): Available vs. Booked Days
Available Days Distribution
Booked Days Distribution
Booking Pattern Insights for Grand Forks
- The most common availability pattern in Grand Forks falls within the 271-366 days range, representing 41.2% of listings. This suggests many properties have significant open periods on their calendars.
- Approximately 64.7% of listings show high availability (181+ days open annually), indicating potential for increased bookings or specific owner usage patterns.
- For booked days, the 181-270 days range is most frequent in Grand Forks (35.3%), reflecting common guest stay durations or potential owner blocking patterns.
- A notable 35.3% of properties secure long booking periods (181+ days booked per year), highlighting successful long-term rental strategies or significant owner usage.
Grand Forks Airbnb Minimum Stay Requirements Analysis
Distribution of Listings by Minimum Night Requirement
1 Night
5 listings
31.3% of total
2 Nights
1 listings
6.3% of total
3 Nights
2 listings
12.5% of total
30+ Nights
8 listings
50% of total
Key Insights
- The most prevalent minimum stay requirement in Grand Forks is 30+ Nights, adopted by 50% of listings. This highlights the market's preference for longer commitments.
- A significant segment (50%) caters to monthly stays (30+ nights) in Grand Forks, pointing to opportunities in the extended-stay market.
Recommendations
- Align with the market by considering a 30+ Nights minimum stay, as 50% of Grand Forks hosts use this setting.
- Explore offering discounts for stays of 30+ nights to attract the 50% of the market seeking extended stays.
- Adjust minimum nights based on seasonality – potentially shorter during low season and longer during peak demand periods in Grand Forks.
Grand Forks Airbnb Cancellation Policy Trends Analysis (2025)
Limited
2 listings
11.8% of total
Flexible
7 listings
41.2% of total
Moderate
6 listings
35.3% of total
Firm
2 listings
11.8% of total
Cancellation Policy Insights for Grand Forks
- The prevailing Airbnb cancellation policy trend in Grand Forks is Flexible, used by 41.2% of listings.
- The market strongly favors guest-friendly terms, with 76.5% of listings offering Flexible or Moderate policies. This suggests guests in Grand Forks may expect booking flexibility.
Recommendations for Hosts
- Consider adopting a Flexible policy to align with the 41.2% market standard in Grand Forks.
- Regularly review your cancellation policy against competitors and market demand shifts in Grand Forks.
Grand Forks STR Booking Lead Time Analysis (2025)
Average Booking Lead Time by Month
Booking Lead Time Insights for Grand Forks
- The overall average booking lead time for vacation rentals in Grand Forks is 61 days.
- Guests book furthest in advance for stays during August (average 98 days), likely coinciding with peak travel demand or local events.
- The shortest booking windows occur for stays in November (average 24 days), indicating more last-minute travel plans during this time.
- Seasonally, Summer (72 days avg.) sees the longest lead times, while Winter (31 days avg.) has the shortest, reflecting typical travel planning cycles.
Recommendations for Hosts
- Use the overall average lead time (61 days) as a baseline for your pricing and availability strategy in Grand Forks.
- For August stays, consider implementing length-of-stay discounts or slightly higher rates for bookings made less than 98 days out to capitalize on advance planning.
- Target marketing efforts for the Summer season well in advance (at least 72 days) to capture early planners.
- Monitor your own booking lead times against these Grand Forks averages to identify opportunities for dynamic pricing adjustments.
Popular & Essential Airbnb Amenities in Grand Forks (2025)
Amenity Prevalence
Amenity Insights for Grand Forks
- Essential amenities in Grand Forks that guests expect include: Hot water, Free parking on premises, Smoke alarm, Coffee maker, Kitchen, Heating, Wifi. Lacking these (any) could significantly impact bookings.
- Popular amenities like Refrigerator, Dishes and silverware, Bed linens are common but not universal. Offering these can provide a competitive edge.
Recommendations for Hosts
- Ensure your listing includes all essential amenities for Grand Forks: Hot water, Free parking on premises, Smoke alarm, Coffee maker, Kitchen, Heating, Wifi.
- Consider adding popular differentiators like Refrigerator or Dishes and silverware to increase appeal.
- Highlight unique or less common amenities you offer (e.g., hot tub, dedicated workspace, EV charger) in your listing description and photos.
- Regularly check competitor amenities in Grand Forks to stay competitive.
Grand Forks Airbnb Guest Demographics & Profile Analysis (2025)
Guest Profile Summary for Grand Forks
- The typical guest profile for Airbnb in Grand Forks consists of primarily domestic travelers (87%), often arriving from nearby Kelowna, typically belonging to the Post-2000s (Gen Z/Alpha) group (50%), primarily speaking English or French.
- Domestic travelers account for 87.0% of guests.
- Key international markets include Canada (87%) and United States (9.3%).
- Top languages spoken are English (78.2%) followed by French (7.7%).
- A significant demographic segment is the Post-2000s (Gen Z/Alpha) group, representing 50% of guests.
Recommendations for Hosts
- Target domestic marketing efforts towards travelers from Kelowna and Calgary.
- Tailor amenities and listing descriptions to appeal to the dominant Post-2000s (Gen Z/Alpha) demographic (e.g., highlight fast WiFi, smart home features, local guides).
- Highlight unique local experiences or amenities relevant to the primary guest profile.
- Consider seasonal promotions aligned with peak travel times for key origin markets.
Nearby Short-Term Rental Market Comparison
How does the Grand Forks Airbnb market stack up against its neighbors? Compare key performance metrics like average monthly revenue, ADR, and occupancy rates in surrounding areas to understand the broader regional STR landscape.
| Market | Active Properties | Monthly Revenue | Daily Rate | Avg. Occupancy |
|---|---|---|---|---|
| Brewster | 12 | $3,747 | $388.17 | 43% |
| Pateros | 13 | $3,489 | $343.94 | 41% |
| Revelstoke | 277 | $3,296 | $287.10 | 47% |
| Area B (Shelter Bay/Mica Creek) | 75 | $3,182 | $305.37 | 43% |
| Westbank First Nation #9 | 71 | $2,900 | $232.47 | 54% |
| Sun Peaks Mountain Resort Municipality | 342 | $2,817 | $310.30 | 38% |
| Area C (Silver Star) | 253 | $2,595 | $335.71 | 42% |
| West Kelowna | 360 | $2,569 | $248.62 | 47% |
| Lake Country | 119 | $2,563 | $269.23 | 48% |
| Area E (Naramata/Greyback) | 78 | $2,526 | $272.34 | 47% |