District of North Vancouver Airbnb Market Analysis 2026: Short Term Rental Data & Vacation Rental Statistics in British Columbia, Canada
Is Airbnb profitable in District of North Vancouver in 2026? Explore comprehensive Airbnb analytics for District of North Vancouver, British Columbia, Canada to uncover income potential. This 2026 STR market report for District of North Vancouver, based on AirROI data from February 2025 to January 2026, reveals key trends in the market of 468 active listings.
Whether you're considering an Airbnb investment in District of North Vancouver, optimizing your existing vacation rental, or exploring rental arbitrage opportunities, understanding the District of North Vancouver Airbnb data is crucial. Navigating the high regulation landscape is key to maximizing your short term rental income potential. Let's dive into the specifics.
Key District of North Vancouver Airbnb Performance Metrics Overview
Monthly Airbnb Revenue Variations & Income Potential in District of North Vancouver (2026)
Understanding the monthly revenue variations for Airbnb listings in District of North Vancouver is key to maximizing your short term rental income potential. Seasonality significantly impacts earnings. Our analysis, based on data from the past 12 months, shows that the peak revenue month for STRs in District of North Vancouver is typically July, while February often presents the lowest earnings, highlighting opportunities for strategic pricing adjustments during shoulder and low seasons. Explore the typical Airbnb income in District of North Vancouver across different performance tiers:
- Best-in-class properties (Top 10%) achieve $4,808+ monthly, often utilizing dynamic pricing and superior guest experiences.
- Strong performing properties (Top 25%) earn $3,342 or more, indicating effective management and desirable locations/amenities.
- Typical properties (Median) generate around $2,300 per month, representing the average market performance.
- Entry-level properties (Bottom 25%) see earnings around $1,420, often with potential for optimization.
Average Monthly Airbnb Earnings Trend in District of North Vancouver
District of North Vancouver Airbnb Occupancy Rate Trends (2026)
Maximize your bookings by understanding the District of North Vancouver STR occupancy trends. Seasonal demand shifts significantly influence how often properties are booked. Typically, Julysees the highest demand (peak season occupancy), while January experiences the lowest (low season). Effective strategies, like adjusting minimum stays or offering promotions, can boost occupancy during slower periods. Here's how different property tiers perform in District of North Vancouver:
- Best-in-class properties (Top 10%) achieve 89%+ occupancy, indicating high desirability and potentially optimized availability.
- Strong performing properties (Top 25%) maintain 78% or higher occupancy, suggesting good market fit and guest satisfaction.
- Typical properties (Median) have an occupancy rate around 60%.
- Entry-level properties (Bottom 25%) average 35% occupancy, potentially facing higher vacancy.
Average Monthly Occupancy Rate Trend in District of North Vancouver
Average Daily Rate (ADR) Airbnb Trends in District of North Vancouver (2026)
Effective short term rental pricing strategy in District of North Vancouver involves understanding monthly ADR fluctuations. The Average Daily Rate (ADR) for Airbnb in District of North Vancouver typically peaks in August and dips lowest during February. Leveraging Airbnb dynamic pricing tools or strategies based on this seasonality can significantly boost revenue. Here's a look at the typical nightly rates achieved:
- Best-in-class properties (Top 10%) command rates of $366+ per night, often due to premium features or locations.
- Strong performing properties (Top 25%) achieve nightly rates of $186 or more.
- Typical properties (Median) charge around $127 per night.
- Entry-level properties (Bottom 25%) earn around $93 per night.
Average Daily Rate (ADR) Trend by Month in District of North Vancouver
Get Live District of North Vancouver Market Intelligence 👇

Explore Real-time Analytics
Airbnb Seasonality Analysis & Trends in District of North Vancouver (2026)
Peak Season (July, August, September)
- Revenue averages $4,099 per month
- Occupancy rates average 69.5%
- Daily rates average $199
Shoulder Season
- Revenue averages $2,608 per month
- Occupancy maintains around 54.2%
- Daily rates hold near $185
Low Season (January, February, March)
- Revenue drops to average $1,796 per month
- Occupancy decreases to average 44.6%
- Daily rates adjust to average $175
Seasonality Insights for District of North Vancouver
- The Airbnb seasonality in District of North Vancouver shows highly seasonal trends requiring careful strategy. While the sections above show seasonal averages, it's also insightful to look at the extremes:
- During the high season, the absolute peak month showcases District of North Vancouver's highest earning potential, with monthly revenues capable of climbing to $4,533, occupancy reaching a high of 72.0%, and ADRs peaking at $200.
- Conversely, the slowest single month of the year, typically falling within the low season, marks the market's lowest point. In this month, revenue might dip to $1,692, occupancy could drop to 35.1%, and ADRs may adjust down to $169.
- Understanding both the seasonal averages and these monthly peaks and troughs in revenue, occupancy, and ADR is crucial for maximizing your Airbnb profit potential in District of North Vancouver.
Seasonal Strategies for Maximizing Profit
- Peak Season: Maximize revenue through premium pricing and potentially longer minimum stays. Ensure high availability.
- Low Season: Offer competitive pricing, special promotions (e.g., extended stay discounts), and flexible cancellation policies. Target off-season travelers like remote workers or budget-conscious guests.
- Shoulder Seasons: Implement dynamic pricing that balances peak and low rates. Target weekend travelers or specific events. Offer slightly more flexible terms than peak season.
- Regularly analyze your own performance against these District of North Vancouver seasonality benchmarks and adjust your pricing and availability strategy accordingly.
Best Areas for Airbnb Investment in District of North Vancouver (2026)
Exploring the top neighborhoods for short-term rentals in District of North Vancouver? This section highlights key areas, outlining why they are attractive for hosts and guests, along with notable local attractions. Consider these locations based on your target guest profile and investment strategy.
| Neighborhood / Area | Why Host Here? (Target Guests & Appeal) | Key Attractions & Landmarks |
|---|---|---|
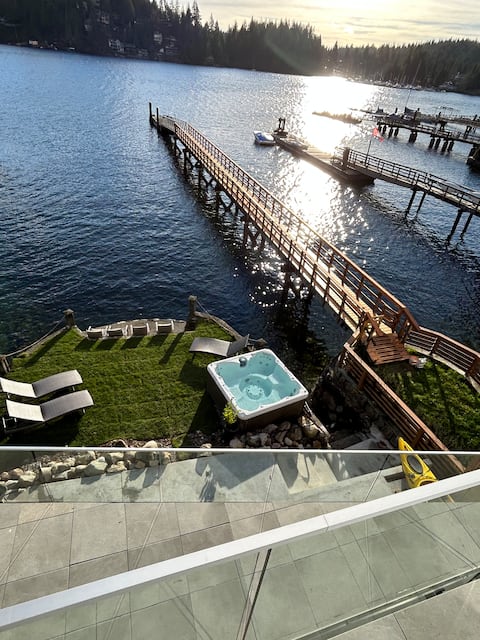
| Deep Cove | A picturesque village known for its stunning waterfront views and outdoor activities. Ideal for tourists looking for nature, kayaking, and hiking in a serene environment. | Deep Cove Kayak Centre, Seymour Mountain, Deep Cove Park, Honey's Donuts, Cove Park, Baden Powell Trail |
| Lynn Valley | Famous for its natural beauty and hiking trails, Lynn Valley attracts nature lovers and adventure seekers. Close to Lynn Canyon Park and the suspension bridge, it offers a unique experience. | Lynn Canyon Park, Lynn Canyon Suspension Bridge, Lynn Valley Village, Cascade Falls, Baden Powell Trail |
| West Vancouver | An affluent suburb with stunning views of the ocean and mountains, West Vancouver is appealing to those seeking luxury and tranquility. Great for upscale short-term stays. | Ambleside Park, Lighthouse Park, West Vancouver Museum, Caulfield Village, Sea to Sky Highway |
| Edgemont Village | A charming community with boutique shops and restaurants, Edgemont Village is perfect for visitors who appreciate a quaint and cozy atmosphere. Close to nature parks and trails. | Edgemont Village shops, Murdo Fraser Park, Capilano River Regional Park, Cleveland Dam, Lynn Canyon Park |
| Lower Lonsdale | An emerging neighborhood with easy access to downtown Vancouver via the SeaBus, Lower Lonsdale is popular with tourists looking for urban convenience and waterfront views. | Lonsdale Quay Market, Shipyard Park, Museum and Archives, North Vancouver Public Library, Casual dining and breweries |
| Mount Seymour | A popular area for skiing and snowboarding in the winter, and hiking in the summer. Attracts outdoor enthusiasts year-round with easy access to the mountains. | Mount Seymour Provincial Park, Ski Resort, Hiking trails, Biking trails, Picnic areas |
| Parkgate | Located near Garibaldi Provincial Park, Parkgate is perfect for nature lovers and outdoor activities, including hiking, biking, and exploring the local flora and fauna. | Garibaldi Provincial Park, Parkgate Park, Indian River, Outdoor recreation areas, Local dining options |
| Norgate | A family-friendly neighborhood with easy access to parks and recreational facilities. Great for families looking for a cozy and comfortable Airbnb experience. | Norgate Park, Westview Park, Local shops, Community Centre, Recreation activities |
Understanding Airbnb License Requirements & STR Laws in District of North Vancouver (2026)
Yes, District of North Vancouver, British Columbia, Canada enforces high STR regulations. Obtaining a license and ensuring compliance is almost certainly required according to current 2026 STR laws. Always verify the latest short term rental regulations and Airbnb license requirements directly with local government authorities for District of North Vancouver to ensure full compliance before hosting.
(Source: AirROI data, 2026, based on 82% licensed listings)
Top Performing Airbnb Properties in District of North Vancouver (2026)
Benchmark your potential! Explore examples of top-performing Airbnb properties in District of North Vancouverbased on Trailing Twelve Month (TTM) revenue. Analyze their characteristics, revenue, occupancy rate, and ADR to understand what drives success in this market.
Waterfront Luxury Home - FIFA Vancouver
Entire Place • 4 bedrooms
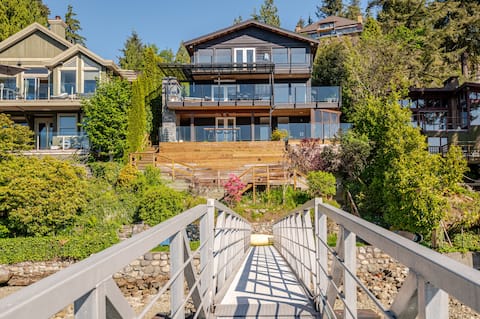
Gorgeous Waterfront Home w/ Private Dock & Sauna
Entire Place • 5 bedrooms

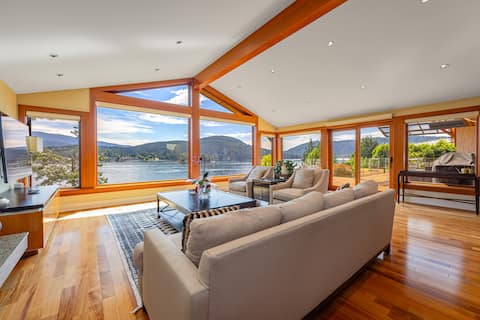
***Panoramic Water View***Villa Très Jolie
Entire Place • 6 bedrooms

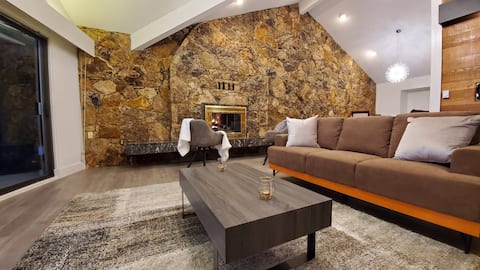
Modern 3 Bed 2.5 Bath Home with Theatre + Sauna
Entire Place • 3 bedrooms
Deep Cove Stunning Waterfront House
Entire Place • 4 bedrooms
Views, Charming 5 bedroom west coast residence
Entire Place • 6 bedrooms
Note: Performance varies based on location, size, amenities, seasonality, and management quality. Data reflects the past 12 months.
Top Performing Airbnb Hosts in District of North Vancouver (2026)
Learn from the best! This table showcases top-performing Airbnb hosts in District of North Vancouver based on the number of properties managed and estimated total revenue over the past year. Analyze their scale and performance metrics.
| Host Name | Properties | Grossing Revenue | Stay Reviews | Avg Rating |
|---|---|---|---|---|
| Siavash | 22 | $366,141 | 7078 | 4.80/5.0 |
| John | 1 | $200,812 | 53 | 4.98/5.0 |
| Max | 2 | $198,329 | 112 | 4.86/5.0 |
| Kelly | 2 | $197,317 | 25 | 5.00/5.0 |
| Mei | 3 | $146,305 | 77 | 4.85/5.0 |
| Arthur | 1 | $130,885 | 66 | 4.88/5.0 |
| Arash | 1 | $123,974 | 86 | 4.80/5.0 |
| Hugh | 1 | $115,979 | 15 | 5.00/5.0 |
| Lien | 2 | $102,347 | 265 | 4.75/5.0 |
| Olivier | 2 | $101,555 | 107 | 4.96/5.0 |
Analyzing the strategies of top hosts, such as their property selection, pricing, and guest communication, can offer valuable lessons for optimizing your own Airbnb operations in District of North Vancouver.
Dive Deeper: Advanced District of North Vancouver STR Market Data (2026)
Ready to unlock more insights? AirROI provides access to advanced metrics and comprehensive Airbnb data for District of North Vancouver. Explore detailed analytics beyond this report to refine your investment strategy, optimize pricing, and maximize your vacation rental profits.
Explore Advanced MetricsDistrict of North Vancouver Short-Term Rental Market Composition (2026): Property & Room Types
Room Type Distribution
Property Type Distribution
Market Composition Insights for District of North Vancouver
- The District of North Vancouver Airbnb market composition is heavily skewed towards Entire Home/Apt listings, which make up 87.4% of the 468 active rentals. This indicates strong guest preference for privacy and space.
- Looking at the property type distribution in District of North Vancouver, Others properties are the most common (45.3%), reflecting the local real estate landscape.
- Houses represent a significant 42.3% portion, catering likely to families or larger groups.
- Smaller segments like hotel/boutique, outdoor/unique (combined 4.5%) offer potential for unique stay experiences.
District of North Vancouver Airbnb Room Capacity Analysis (2026): Bedroom Distribution
Distribution of Listings by Number of Bedrooms
Room Capacity Insights for District of North Vancouver
- The dominant room capacity in District of North Vancouver is 1 bedroom listings, making up 37.6% of the market. This suggests a strong demand for properties suitable for couples or solo travelers.
- Together, 1 bedroom and 2 bedrooms properties represent 69.2% of the active Airbnb listings in District of North Vancouver, indicating a high concentration in these sizes.
District of North Vancouver Vacation Rental Guest Capacity Trends (2026)
Distribution of Listings by Guest Capacity
Guest Capacity Insights for District of North Vancouver
- The most common guest capacity trend in District of North Vancouver vacation rentals is listings accommodating 4 guests (31.6%). This suggests the primary traveler segment is likely small families or groups.
- Properties designed for 4 guests and 2 guests dominate the District of North Vancouver STR market, accounting for 55.1% of listings.
- 17.3% of properties accommodate 6+ guests, serving the market segment for larger families or group travel in District of North Vancouver.
- On average, properties in District of North Vancouver are equipped to host 3.5 guests.
District of North Vancouver Airbnb Booking Patterns (2026): Available vs. Booked Days
Available Days Distribution
Booked Days Distribution
Booking Pattern Insights for District of North Vancouver
- The most common availability pattern in District of North Vancouver falls within the 91-180 days range, representing 30.6% of listings. This suggests many properties have significant open periods on their calendars.
- Approximately 57.2% of listings show high availability (181+ days open annually), indicating potential for increased bookings or specific owner usage patterns.
- For booked days, the 181-270 days range is most frequent in District of North Vancouver (31%), reflecting common guest stay durations or potential owner blocking patterns.
- A notable 44.2% of properties secure long booking periods (181+ days booked per year), highlighting successful long-term rental strategies or significant owner usage.
District of North Vancouver Airbnb Minimum Stay Requirements Analysis
Distribution of Listings by Minimum Night Requirement
1 Night
55 listings
11.8% of total
2 Nights
66 listings
14.1% of total
3 Nights
50 listings
10.7% of total
4-6 Nights
24 listings
5.1% of total
7-29 Nights
47 listings
10% of total
30+ Nights
226 listings
48.3% of total
Key Insights
- The most prevalent minimum stay requirement in District of North Vancouver is 30+ Nights, adopted by 48.3% of listings. This highlights the market's preference for longer commitments.
- A significant segment (48.3%) caters to monthly stays (30+ nights) in District of North Vancouver, pointing to opportunities in the extended-stay market.
Recommendations
- Align with the market by considering a 30+ Nights minimum stay, as 48.3% of District of North Vancouver hosts use this setting.
- If feasible, allowing 1-night stays, especially midweek or during low season, could capture last-minute bookings, as only 11.8% currently do.
- Explore offering discounts for stays of 30+ nights to attract the 48.3% of the market seeking extended stays.
- Adjust minimum nights based on seasonality – potentially shorter during low season and longer during peak demand periods in District of North Vancouver.
District of North Vancouver Airbnb Cancellation Policy Trends Analysis (2026)
Limited
24 listings
5.1% of total
Super Strict 30 Days
1 listings
0.2% of total
Flexible
47 listings
10% of total
Moderate
124 listings
26.5% of total
Firm
233 listings
49.8% of total
Strict
39 listings
8.3% of total
Cancellation Policy Insights for District of North Vancouver
- The prevailing Airbnb cancellation policy trend in District of North Vancouver is Firm, used by 49.8% of listings.
- A majority (58.1%) of hosts in District of North Vancouver utilize Firm or Strict policies, indicating a market where hosts prioritize booking security.
- Strict cancellation policies are quite rare (8.3%), potentially making listings with this policy less competitive unless justified by high demand or property type.
Recommendations for Hosts
- Consider adopting a Firm policy to align with the 49.8% market standard in District of North Vancouver.
- Using a Strict policy might deter some guests, as only 8.3% of listings use it. Evaluate if potential revenue protection outweighs possible lower booking rates.
- Regularly review your cancellation policy against competitors and market demand shifts in District of North Vancouver.
District of North Vancouver STR Booking Lead Time Analysis (2026)
Average Booking Lead Time by Month
Booking Lead Time Insights for District of North Vancouver
- The overall average booking lead time for vacation rentals in District of North Vancouver is 51 days.
- Guests book furthest in advance for stays during July (average 84 days), likely coinciding with peak travel demand or local events.
- The shortest booking windows occur for stays in February (average 23 days), indicating more last-minute travel plans during this time.
- Seasonally, Summer (72 days avg.) sees the longest lead times, while Winter (34 days avg.) has the shortest, reflecting typical travel planning cycles.
Recommendations for Hosts
- Use the overall average lead time (51 days) as a baseline for your pricing and availability strategy in District of North Vancouver.
- For July stays, consider implementing length-of-stay discounts or slightly higher rates for bookings made less than 84 days out to capitalize on advance planning.
- Target marketing efforts for the Summer season well in advance (at least 72 days) to capture early planners.
- Monitor your own booking lead times against these District of North Vancouver averages to identify opportunities for dynamic pricing adjustments.
Popular & Essential Airbnb Amenities in District of North Vancouver (2026)
Amenity Prevalence
Amenity Insights for District of North Vancouver
- Essential amenities in District of North Vancouver that guests expect include: Wifi, Smoke alarm, Heating, Hot water. Lacking these (any) could significantly impact bookings.
- Popular amenities like Dishes and silverware, Kitchen, Hangers are common but not universal. Offering these can provide a competitive edge.
Recommendations for Hosts
- Ensure your listing includes all essential amenities for District of North Vancouver: Wifi, Smoke alarm, Heating, Hot water.
- Prioritize adding missing essentials: Smoke alarm, Heating, Hot water.
- Consider adding popular differentiators like Dishes and silverware or Kitchen to increase appeal.
- Highlight unique or less common amenities you offer (e.g., hot tub, dedicated workspace, EV charger) in your listing description and photos.
- Regularly check competitor amenities in District of North Vancouver to stay competitive.
District of North Vancouver Airbnb Guest Demographics & Profile Analysis (2026)
Guest Profile Summary for District of North Vancouver
- The typical guest profile for Airbnb in District of North Vancouver consists of a mix of domestic (46%) and international guests, with top international origins including United States, typically belonging to the Post-2000s (Gen Z/Alpha) group (50%), primarily speaking English or French.
- Domestic travelers account for 45.9% of guests.
- Key international markets include Canada (45.9%) and United States (34.8%).
- Top languages spoken are English (59.8%) followed by French (9.2%).
- A significant demographic segment is the Post-2000s (Gen Z/Alpha) group, representing 50% of guests.
Recommendations for Hosts
- Balance marketing efforts between domestic and international channels based on the guest mix.
- Tailor amenities and listing descriptions to appeal to the dominant Post-2000s (Gen Z/Alpha) demographic (e.g., highlight fast WiFi, smart home features, local guides).
- Highlight unique local experiences or amenities relevant to the primary guest profile.
- Consider seasonal promotions aligned with peak travel times for key origin markets.
Nearby Short-Term Rental Market Comparison
How does the District of North Vancouver Airbnb market stack up against its neighbors? Compare key performance metrics like average monthly revenue, ADR, and occupancy rates in surrounding areas to understand the broader regional STR landscape.
| Market | Active Properties | Monthly Revenue | Daily Rate | Avg. Occupancy |
|---|---|---|---|---|
| Sudden Valley | 63 | $4,821 | $324.44 | 51% |
| Warm Beach | 10 | $4,811 | $319.50 | 43% |
| Friday Harbor | 235 | $4,233 | $420.06 | 43% |
| Eastsound | 269 | $4,153 | $367.43 | 42% |
| Whistler | 277 | $4,107 | $378.89 | 47% |
| Area C (Pemberton Valley/Mount Currie/D'Arcy) | 88 | $3,959 | $396.43 | 46% |
| Whistler Resort Municipality | 2,185 | $3,958 | $385.95 | 43% |
| Orcas Island | 11 | $3,910 | $468.54 | 33% |
| Port Angeles | 685 | $3,855 | $281.12 | 51% |
| Beaver | 24 | $3,844 | $296.72 | 57% |