Area F (Columbia Lake/Windermere Lake) Airbnb Market Analysis 2026: Short Term Rental Data & Vacation Rental Statistics in British Columbia, Canada
Is Airbnb profitable in Area F (Columbia Lake/Windermere Lake) in 2026? Explore comprehensive Airbnb analytics for Area F (Columbia Lake/Windermere Lake), British Columbia, Canada to uncover income potential. This 2026 STR market report for Area F (Columbia Lake/Windermere Lake), based on AirROI data from February 2025 to January 2026, reveals key trends in the market of 384 active listings.
Whether you're considering an Airbnb investment in Area F (Columbia Lake/Windermere Lake), optimizing your existing vacation rental, or exploring rental arbitrage opportunities, understanding the Area F (Columbia Lake/Windermere Lake) Airbnb data is crucial. Navigating the high regulation landscape is key to maximizing your short term rental income potential. Let's dive into the specifics.
Key Area F (Columbia Lake/Windermere Lake) Airbnb Performance Metrics Overview
Monthly Airbnb Revenue Variations & Income Potential in Area F (Columbia Lake/Windermere Lake) (2026)
Understanding the monthly revenue variations for Airbnb listings in Area F (Columbia Lake/Windermere Lake) is key to maximizing your short term rental income potential. Seasonality significantly impacts earnings. Our analysis, based on data from the past 12 months, shows that the peak revenue month for STRs in Area F (Columbia Lake/Windermere Lake) is typically August, while April often presents the lowest earnings, highlighting opportunities for strategic pricing adjustments during shoulder and low seasons. Explore the typical Airbnb income in Area F (Columbia Lake/Windermere Lake) across different performance tiers:
- Best-in-class properties (Top 10%) achieve $7,331+ monthly, often utilizing dynamic pricing and superior guest experiences.
- Strong performing properties (Top 25%) earn $4,789 or more, indicating effective management and desirable locations/amenities.
- Typical properties (Median) generate around $2,724 per month, representing the average market performance.
- Entry-level properties (Bottom 25%) see earnings around $1,467, often with potential for optimization.
Average Monthly Airbnb Earnings Trend in Area F (Columbia Lake/Windermere Lake)
Area F (Columbia Lake/Windermere Lake) Airbnb Occupancy Rate Trends (2026)
Maximize your bookings by understanding the Area F (Columbia Lake/Windermere Lake) STR occupancy trends. Seasonal demand shifts significantly influence how often properties are booked. Typically, Julysees the highest demand (peak season occupancy), while November experiences the lowest (low season). Effective strategies, like adjusting minimum stays or offering promotions, can boost occupancy during slower periods. Here's how different property tiers perform in Area F (Columbia Lake/Windermere Lake):
- Best-in-class properties (Top 10%) achieve 75%+ occupancy, indicating high desirability and potentially optimized availability.
- Strong performing properties (Top 25%) maintain 59% or higher occupancy, suggesting good market fit and guest satisfaction.
- Typical properties (Median) have an occupancy rate around 41%.
- Entry-level properties (Bottom 25%) average 22% occupancy, potentially facing higher vacancy.
Average Monthly Occupancy Rate Trend in Area F (Columbia Lake/Windermere Lake)
Average Daily Rate (ADR) Airbnb Trends in Area F (Columbia Lake/Windermere Lake) (2026)
Effective short term rental pricing strategy in Area F (Columbia Lake/Windermere Lake) involves understanding monthly ADR fluctuations. The Average Daily Rate (ADR) for Airbnb in Area F (Columbia Lake/Windermere Lake) typically peaks in December and dips lowest during April. Leveraging Airbnb dynamic pricing tools or strategies based on this seasonality can significantly boost revenue. Here's a look at the typical nightly rates achieved:
- Best-in-class properties (Top 10%) command rates of $448+ per night, often due to premium features or locations.
- Strong performing properties (Top 25%) achieve nightly rates of $322 or more.
- Typical properties (Median) charge around $211 per night.
- Entry-level properties (Bottom 25%) earn around $143 per night.
Average Daily Rate (ADR) Trend by Month in Area F (Columbia Lake/Windermere Lake)
Get Live Area F (Columbia Lake/Windermere Lake) Market Intelligence 👇
.png)
Explore Real-time Analytics
Airbnb Seasonality Analysis & Trends in Area F (Columbia Lake/Windermere Lake) (2026)
Peak Season (August, July, February)
- Revenue averages $5,451 per month
- Occupancy rates average 60.8%
- Daily rates average $264
Shoulder Season
- Revenue averages $3,253 per month
- Occupancy maintains around 38.7%
- Daily rates hold near $259
Low Season (April, October, November)
- Revenue drops to average $2,198 per month
- Occupancy decreases to average 30.5%
- Daily rates adjust to average $237
Seasonality Insights for Area F (Columbia Lake/Windermere Lake)
- The Airbnb seasonality in Area F (Columbia Lake/Windermere Lake) shows highly seasonal trends requiring careful strategy. While the sections above show seasonal averages, it's also insightful to look at the extremes:
- During the high season, the absolute peak month showcases Area F (Columbia Lake/Windermere Lake)'s highest earning potential, with monthly revenues capable of climbing to $6,175, occupancy reaching a high of 65.3%, and ADRs peaking at $300.
- Conversely, the slowest single month of the year, typically falling within the low season, marks the market's lowest point. In this month, revenue might dip to $1,908, occupancy could drop to 28.4%, and ADRs may adjust down to $213.
- Understanding both the seasonal averages and these monthly peaks and troughs in revenue, occupancy, and ADR is crucial for maximizing your Airbnb profit potential in Area F (Columbia Lake/Windermere Lake).
Seasonal Strategies for Maximizing Profit
- Peak Season: Maximize revenue through premium pricing and potentially longer minimum stays. Ensure high availability.
- Low Season: Offer competitive pricing, special promotions (e.g., extended stay discounts), and flexible cancellation policies. Target off-season travelers like remote workers or budget-conscious guests.
- Shoulder Seasons: Implement dynamic pricing that balances peak and low rates. Target weekend travelers or specific events. Offer slightly more flexible terms than peak season.
- Regularly analyze your own performance against these Area F (Columbia Lake/Windermere Lake) seasonality benchmarks and adjust your pricing and availability strategy accordingly.
Best Areas for Airbnb Investment in Area F (Columbia Lake/Windermere Lake) (2026)
Exploring the top neighborhoods for short-term rentals in Area F (Columbia Lake/Windermere Lake)? This section highlights key areas, outlining why they are attractive for hosts and guests, along with notable local attractions. Consider these locations based on your target guest profile and investment strategy.
| Neighborhood / Area | Why Host Here? (Target Guests & Appeal) | Key Attractions & Landmarks |
|---|---|---|
| Columbia Lake | A beautiful alpine lake offering outdoor recreational activities year-round. Ideal for families and nature lovers, it's perfect for those looking to enjoy water sports in the summer and snow activities in the winter. | Columbia Lake Provincial Park, Windermere Valley, kitesurfing and wakeboarding, hiking trails, boating activities |
| Windermere Lake | Windermere Lake is known for its stunning scenery and warm waters, attracting tourists looking for a relaxing getaway. The area provides various water-based activities and is a key location for summer rentals. | Windermere Beach, Kinsmen Park, waterfront restaurants, fishing spots, various hiking routes |
| Fairmont Hot Springs | Famous for its natural hot springs, this area attracts visitors year-round, especially during ski season and summer months for relaxation and spa experiences. | Fairmont Hot Springs Resort, natural hot pools, skiing at Fairmont Ski Area, golf courses, hiking trails |
| Invermere | A charming town on the shores of Lake Windermere, known for its vibrant local culture and outdoor activities, making it a popular destination for both summer and winter travelers. | Kinsmen Park, Lake Windermere, Windermere Farmer's Market, invermere's art galleries, Summer water sports |
| Aqua Park | A modern water park attraction, which is a great draw for families and children during the hot summer months, contributing to the area's rental demand. | Aqua Park, water slides, swimming areas, family activities, picnic areas |
| Radium Hot Springs | Renowned for its mineral hot springs, Radium offers relaxation and wellness experiences, making it a hit with health-conscious travelers. | Radium Hot Springs Pool, Kootenay National Park, golfing at Radium Resort, wildlife viewing, nearby hiking trails |
| Panorama Mountain Resort | Famous for its ski slopes and outdoor adventures, this resort attracts visitors year-round for skiing, mountain biking, and hiking, making it attractive for Airbnb hosting. | Panorama Ski Resort, mountain biking trails, hot springs nearby, golfing at Panorama, scenic viewpoints |
| Mount Nelson | A hidden gem for nature lovers, offering hiking and stunning views. It attracts tourists looking for a quiet retreat away from the bustling areas. | Mount Nelson Trail, wildflower viewing, wildlife observation, photography spots, nearby lakes |
Understanding Airbnb License Requirements & STR Laws in Area F (Columbia Lake/Windermere Lake) (2026)
Yes, Area F (Columbia Lake/Windermere Lake), British Columbia, Canada enforces high STR regulations. Obtaining a license and ensuring compliance is almost certainly required according to current 2026 STR laws. Always verify the latest short term rental regulations and Airbnb license requirements directly with local government authorities for Area F (Columbia Lake/Windermere Lake) to ensure full compliance before hosting.
(Source: AirROI data, 2026, based on 87% licensed listings)
Top Performing Airbnb Properties in Area F (Columbia Lake/Windermere Lake) (2026)
Benchmark your potential! Explore examples of top-performing Airbnb properties in Area F (Columbia Lake/Windermere Lake)based on Trailing Twelve Month (TTM) revenue. Analyze their characteristics, revenue, occupancy rate, and ADR to understand what drives success in this market.

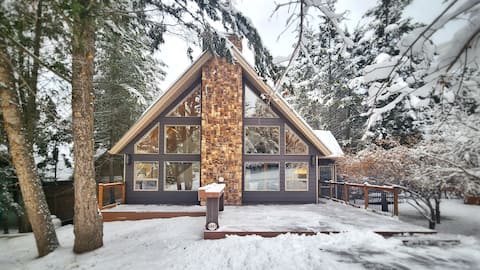
Rundlestone Ridge | 13-Person Hot Tub | Ski-In/Out
Entire Place • 5 bedrooms
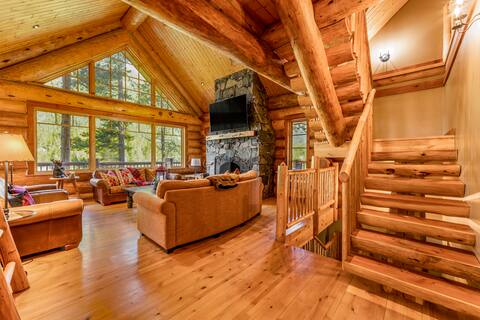
Modern Cabin • Hot Tub • 2 Kings • Beach Access
Entire Place • 5 bedrooms
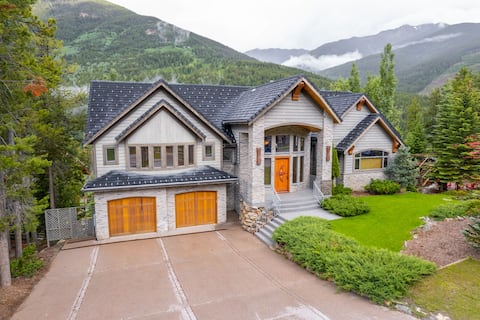
Luxury Log Chalet, Ski In/Out, Pool+Private HotTub
Entire Place • 5 bedrooms

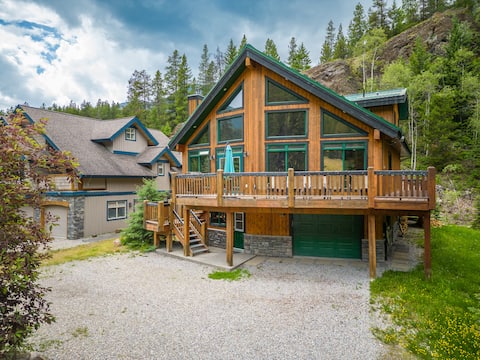
Luxurious cabin in the mountains
Entire Place • 6 bedrooms
Eagle Lodge | Pool + Private Hot Tub | Ski In/Out
Entire Place • 4 bedrooms
Greywolf Lodge | Private Hot Tub | Wood Fireplace
Entire Place • 5 bedrooms
Note: Performance varies based on location, size, amenities, seasonality, and management quality. Data reflects the past 12 months.
Top Performing Airbnb Hosts in Area F (Columbia Lake/Windermere Lake) (2026)
Learn from the best! This table showcases top-performing Airbnb hosts in Area F (Columbia Lake/Windermere Lake) based on the number of properties managed and estimated total revenue over the past year. Analyze their scale and performance metrics.
| Host Name | Properties | Grossing Revenue | Stay Reviews | Avg Rating |
|---|---|---|---|---|
| Aisling Baile | 65 | $3,144,434 | 2769 | 4.79/5.0 |
| Fairmont Creek Vacation Rental | 35 | $904,444 | 626 | 4.80/5.0 |
| Shawna | 30 | $850,929 | 986 | 4.79/5.0 |
| Shy | 9 | $538,269 | 389 | 4.76/5.0 |
| Carolyn | 14 | $487,370 | 123 | 4.77/5.0 |
| Nomadics Vacation Rentals | 3 | $190,650 | 272 | 4.73/5.0 |
| Debra | 3 | $183,101 | 266 | 5.00/5.0 |
| Jarret | 3 | $178,719 | 165 | 4.97/5.0 |
| Heather & Chris | 1 | $178,444 | 105 | 4.99/5.0 |
| Ryland | 7 | $169,875 | 427 | 4.85/5.0 |
Analyzing the strategies of top hosts, such as their property selection, pricing, and guest communication, can offer valuable lessons for optimizing your own Airbnb operations in Area F (Columbia Lake/Windermere Lake).
Dive Deeper: Advanced Area F (Columbia Lake/Windermere Lake) STR Market Data (2026)
Ready to unlock more insights? AirROI provides access to advanced metrics and comprehensive Airbnb data for Area F (Columbia Lake/Windermere Lake). Explore detailed analytics beyond this report to refine your investment strategy, optimize pricing, and maximize your vacation rental profits.
Explore Advanced MetricsArea F (Columbia Lake/Windermere Lake) Short-Term Rental Market Composition (2026): Property & Room Types
Room Type Distribution
Property Type Distribution
Market Composition Insights for Area F (Columbia Lake/Windermere Lake)
- The Area F (Columbia Lake/Windermere Lake) Airbnb market composition is heavily skewed towards Entire Home/Apt listings, which make up 99.2% of the 384 active rentals. This indicates strong guest preference for privacy and space.
- Looking at the property type distribution in Area F (Columbia Lake/Windermere Lake), House properties are the most common (46.4%), reflecting the local real estate landscape.
- Houses represent a significant 46.4% portion, catering likely to families or larger groups.
- Smaller segments like others, unique stays, hotel/boutique (combined 4.7%) offer potential for unique stay experiences.
Area F (Columbia Lake/Windermere Lake) Airbnb Room Capacity Analysis (2026): Bedroom Distribution
Distribution of Listings by Number of Bedrooms
Room Capacity Insights for Area F (Columbia Lake/Windermere Lake)
- The dominant room capacity in Area F (Columbia Lake/Windermere Lake) is 1 bedroom listings, making up 24% of the market. This suggests a strong demand for properties suitable for couples or solo travelers.
- Together, 1 bedroom and 3 bedrooms properties represent 47.2% of the active Airbnb listings in Area F (Columbia Lake/Windermere Lake), indicating a high concentration in these sizes.
- A significant 51.3% of listings offer 3+ bedrooms, catering to larger groups and families seeking more space in Area F (Columbia Lake/Windermere Lake).
Area F (Columbia Lake/Windermere Lake) Vacation Rental Guest Capacity Trends (2026)
Distribution of Listings by Guest Capacity
Guest Capacity Insights for Area F (Columbia Lake/Windermere Lake)
- The most common guest capacity trend in Area F (Columbia Lake/Windermere Lake) vacation rentals is listings accommodating 8+ guests (43.5%). This suggests the primary traveler segment is likely larger groups.
- Properties designed for 8+ guests and 4 guests dominate the Area F (Columbia Lake/Windermere Lake) STR market, accounting for 66.9% of listings.
- 64.8% of properties accommodate 6+ guests, serving the market segment for larger families or group travel in Area F (Columbia Lake/Windermere Lake).
- On average, properties in Area F (Columbia Lake/Windermere Lake) are equipped to host 6.2 guests.
Area F (Columbia Lake/Windermere Lake) Airbnb Booking Patterns (2026): Available vs. Booked Days
Available Days Distribution
Booked Days Distribution
Booking Pattern Insights for Area F (Columbia Lake/Windermere Lake)
- The most common availability pattern in Area F (Columbia Lake/Windermere Lake) falls within the 181-270 days range, representing 44.8% of listings. This suggests many properties have significant open periods on their calendars.
- Approximately 78.7% of listings show high availability (181+ days open annually), indicating potential for increased bookings or specific owner usage patterns.
- For booked days, the 91-180 days range is most frequent in Area F (Columbia Lake/Windermere Lake) (44.8%), reflecting common guest stay durations or potential owner blocking patterns.
- A notable 22.9% of properties secure long booking periods (181+ days booked per year), highlighting successful long-term rental strategies or significant owner usage.
Area F (Columbia Lake/Windermere Lake) Airbnb Minimum Stay Requirements Analysis
Distribution of Listings by Minimum Night Requirement
1 Night
22 listings
5.7% of total
2 Nights
105 listings
27.3% of total
3 Nights
26 listings
6.8% of total
4-6 Nights
6 listings
1.6% of total
7-29 Nights
11 listings
2.9% of total
30+ Nights
214 listings
55.7% of total
Key Insights
- The most prevalent minimum stay requirement in Area F (Columbia Lake/Windermere Lake) is 30+ Nights, adopted by 55.7% of listings. This highlights the market's preference for longer commitments.
- A significant segment (55.7%) caters to monthly stays (30+ nights) in Area F (Columbia Lake/Windermere Lake), pointing to opportunities in the extended-stay market.
Recommendations
- Align with the market by considering a 30+ Nights minimum stay, as 55.7% of Area F (Columbia Lake/Windermere Lake) hosts use this setting.
- If feasible, allowing 1-night stays, especially midweek or during low season, could capture last-minute bookings, as only 5.7% currently do.
- Explore offering discounts for stays of 30+ nights to attract the 55.7% of the market seeking extended stays.
- Adjust minimum nights based on seasonality – potentially shorter during low season and longer during peak demand periods in Area F (Columbia Lake/Windermere Lake).
Area F (Columbia Lake/Windermere Lake) Airbnb Cancellation Policy Trends Analysis (2026)
Super Strict 30 Days
6 listings
1.6% of total
Super Strict 60 Days
4 listings
1% of total
Limited
97 listings
25.3% of total
Flexible
14 listings
3.7% of total
Moderate
67 listings
17.5% of total
Firm
164 listings
42.8% of total
Strict
31 listings
8.1% of total
Cancellation Policy Insights for Area F (Columbia Lake/Windermere Lake)
- The prevailing Airbnb cancellation policy trend in Area F (Columbia Lake/Windermere Lake) is Firm, used by 42.8% of listings.
- A majority (50.9%) of hosts in Area F (Columbia Lake/Windermere Lake) utilize Firm or Strict policies, indicating a market where hosts prioritize booking security.
- Strict cancellation policies are quite rare (8.1%), potentially making listings with this policy less competitive unless justified by high demand or property type.
Recommendations for Hosts
- Consider adopting a Firm policy to align with the 42.8% market standard in Area F (Columbia Lake/Windermere Lake).
- Using a Strict policy might deter some guests, as only 8.1% of listings use it. Evaluate if potential revenue protection outweighs possible lower booking rates.
- Regularly review your cancellation policy against competitors and market demand shifts in Area F (Columbia Lake/Windermere Lake).
Area F (Columbia Lake/Windermere Lake) STR Booking Lead Time Analysis (2026)
Average Booking Lead Time by Month
Booking Lead Time Insights for Area F (Columbia Lake/Windermere Lake)
- The overall average booking lead time for vacation rentals in Area F (Columbia Lake/Windermere Lake) is 68 days.
- Guests book furthest in advance for stays during December (average 97 days), likely coinciding with peak travel demand or local events.
- The shortest booking windows occur for stays in November (average 34 days), indicating more last-minute travel plans during this time.
- Seasonally, Summer (84 days avg.) sees the longest lead times, while Fall (48 days avg.) has the shortest, reflecting typical travel planning cycles.
Recommendations for Hosts
- Use the overall average lead time (68 days) as a baseline for your pricing and availability strategy in Area F (Columbia Lake/Windermere Lake).
- For December stays, consider implementing length-of-stay discounts or slightly higher rates for bookings made less than 97 days out to capitalize on advance planning.
- Target marketing efforts for the Summer season well in advance (at least 84 days) to capture early planners.
- Monitor your own booking lead times against these Area F (Columbia Lake/Windermere Lake) averages to identify opportunities for dynamic pricing adjustments.
Popular & Essential Airbnb Amenities in Area F (Columbia Lake/Windermere Lake) (2026)
Amenity Prevalence
Amenity Insights for Area F (Columbia Lake/Windermere Lake)
- Essential amenities in Area F (Columbia Lake/Windermere Lake) that guests expect include: Smoke alarm, Free parking on premises, Wifi, Kitchen, Heating, TV. Lacking these (any) could significantly impact bookings.
- Popular amenities like Refrigerator, Hot water, Dishes and silverware are common but not universal. Offering these can provide a competitive edge.
Recommendations for Hosts
- Ensure your listing includes all essential amenities for Area F (Columbia Lake/Windermere Lake): Smoke alarm, Free parking on premises, Wifi, Kitchen, Heating, TV.
- Prioritize adding missing essentials: Smoke alarm, Free parking on premises, Wifi, Kitchen, Heating, TV.
- Consider adding popular differentiators like Refrigerator or Hot water to increase appeal.
- Highlight unique or less common amenities you offer (e.g., hot tub, dedicated workspace, EV charger) in your listing description and photos.
- Regularly check competitor amenities in Area F (Columbia Lake/Windermere Lake) to stay competitive.
Area F (Columbia Lake/Windermere Lake) Airbnb Guest Demographics & Profile Analysis (2026)
Guest Profile Summary for Area F (Columbia Lake/Windermere Lake)
- The typical guest profile for Airbnb in Area F (Columbia Lake/Windermere Lake) consists of primarily domestic travelers (83%), often arriving from nearby Calgary, typically belonging to the Post-2000s (Gen Z/Alpha) group (50%), primarily speaking English or French.
- Domestic travelers account for 83.3% of guests.
- Key international markets include Canada (83.3%) and United States (11.1%).
- Top languages spoken are English (65.6%) followed by French (8.2%).
- A significant demographic segment is the Post-2000s (Gen Z/Alpha) group, representing 50% of guests.
Recommendations for Hosts
- Target domestic marketing efforts towards travelers from Calgary and Edmonton.
- Tailor amenities and listing descriptions to appeal to the dominant Post-2000s (Gen Z/Alpha) demographic (e.g., highlight fast WiFi, smart home features, local guides).
- Highlight unique local experiences or amenities relevant to the primary guest profile.
- Consider seasonal promotions aligned with peak travel times for key origin markets.
Nearby Short-Term Rental Market Comparison
How does the Area F (Columbia Lake/Windermere Lake) Airbnb market stack up against its neighbors? Compare key performance metrics like average monthly revenue, ADR, and occupancy rates in surrounding areas to understand the broader regional STR landscape.
| Market | Active Properties | Monthly Revenue | Daily Rate | Avg. Occupancy |
|---|---|---|---|---|
| Canmore | 1,763 | $5,784 | $319.27 | 61% |
| Harvie Heights | 209 | $5,319 | $305.53 | 63% |
| Banff | 137 | $4,939 | $420.71 | 44% |
| Dead Man's Flats | 203 | $4,909 | $260.53 | 59% |
| Lake Louise | 18 | $4,806 | $453.98 | 32% |
| Area A (Kicking Horse/Kinbasket Lake) | 470 | $3,464 | $252.34 | 52% |
| Area B (Lake Koocanusa) | 25 | $3,156 | $426.19 | 40% |
| Area A (Upper Flathead/Elk Valley) | 230 | $3,082 | $286.60 | 41% |
| Bighorn No. 8 | 14 | $2,753 | $202.46 | 50% |
| Invermere | 198 | $2,497 | $219.30 | 46% |