Area C (Silver Star) Airbnb Market Analysis 2026: Short Term Rental Data & Vacation Rental Statistics in British Columbia, Canada
Is Airbnb profitable in Area C (Silver Star) in 2026? Explore comprehensive Airbnb analytics for Area C (Silver Star), British Columbia, Canada to uncover income potential. This 2026 STR market report for Area C (Silver Star), based on AirROI data from February 2025 to January 2026, reveals key trends in the market of 249 active listings.
Whether you're considering an Airbnb investment in Area C (Silver Star), optimizing your existing vacation rental, or exploring rental arbitrage opportunities, understanding the Area C (Silver Star) Airbnb data is crucial. Navigating the high regulation landscape is key to maximizing your short term rental income potential. Let's dive into the specifics.
Key Area C (Silver Star) Airbnb Performance Metrics Overview
Monthly Airbnb Revenue Variations & Income Potential in Area C (Silver Star) (2026)
Understanding the monthly revenue variations for Airbnb listings in Area C (Silver Star) is key to maximizing your short term rental income potential. Seasonality significantly impacts earnings. Our analysis, based on data from the past 12 months, shows that the peak revenue month for STRs in Area C (Silver Star) is typically February, while October often presents the lowest earnings, highlighting opportunities for strategic pricing adjustments during shoulder and low seasons. Explore the typical Airbnb income in Area C (Silver Star) across different performance tiers:
- Best-in-class properties (Top 10%) achieve $7,152+ monthly, often utilizing dynamic pricing and superior guest experiences.
- Strong performing properties (Top 25%) earn $4,618 or more, indicating effective management and desirable locations/amenities.
- Typical properties (Median) generate around $2,724 per month, representing the average market performance.
- Entry-level properties (Bottom 25%) see earnings around $1,451, often with potential for optimization.
Average Monthly Airbnb Earnings Trend in Area C (Silver Star)
Area C (Silver Star) Airbnb Occupancy Rate Trends (2026)
Maximize your bookings by understanding the Area C (Silver Star) STR occupancy trends. Seasonal demand shifts significantly influence how often properties are booked. Typically, Februarysees the highest demand (peak season occupancy), while November experiences the lowest (low season). Effective strategies, like adjusting minimum stays or offering promotions, can boost occupancy during slower periods. Here's how different property tiers perform in Area C (Silver Star):
- Best-in-class properties (Top 10%) achieve 79%+ occupancy, indicating high desirability and potentially optimized availability.
- Strong performing properties (Top 25%) maintain 58% or higher occupancy, suggesting good market fit and guest satisfaction.
- Typical properties (Median) have an occupancy rate around 34%.
- Entry-level properties (Bottom 25%) average 19% occupancy, potentially facing higher vacancy.
Average Monthly Occupancy Rate Trend in Area C (Silver Star)
Average Daily Rate (ADR) Airbnb Trends in Area C (Silver Star) (2026)
Effective short term rental pricing strategy in Area C (Silver Star) involves understanding monthly ADR fluctuations. The Average Daily Rate (ADR) for Airbnb in Area C (Silver Star) typically peaks in January and dips lowest during May. Leveraging Airbnb dynamic pricing tools or strategies based on this seasonality can significantly boost revenue. Here's a look at the typical nightly rates achieved:
- Best-in-class properties (Top 10%) command rates of $614+ per night, often due to premium features or locations.
- Strong performing properties (Top 25%) achieve nightly rates of $466 or more.
- Typical properties (Median) charge around $270 per night.
- Entry-level properties (Bottom 25%) earn around $182 per night.
Average Daily Rate (ADR) Trend by Month in Area C (Silver Star)
Get Live Area C (Silver Star) Market Intelligence 👇
.png)
Explore Real-time Analytics
Airbnb Seasonality Analysis & Trends in Area C (Silver Star) (2026)
Peak Season (February, March, January)
- Revenue averages $5,866 per month
- Occupancy rates average 53.8%
- Daily rates average $381
Shoulder Season
- Revenue averages $2,914 per month
- Occupancy maintains around 35.6%
- Daily rates hold near $330
Low Season (May, June, October)
- Revenue drops to average $2,160 per month
- Occupancy decreases to average 32.3%
- Daily rates adjust to average $299
Seasonality Insights for Area C (Silver Star)
- The Airbnb seasonality in Area C (Silver Star) shows highly seasonal trends requiring careful strategy. While the sections above show seasonal averages, it's also insightful to look at the extremes:
- During the high season, the absolute peak month showcases Area C (Silver Star)'s highest earning potential, with monthly revenues capable of climbing to $7,329, occupancy reaching a high of 70.2%, and ADRs peaking at $422.
- Conversely, the slowest single month of the year, typically falling within the low season, marks the market's lowest point. In this month, revenue might dip to $2,149, occupancy could drop to 26.6%, and ADRs may adjust down to $293.
- Understanding both the seasonal averages and these monthly peaks and troughs in revenue, occupancy, and ADR is crucial for maximizing your Airbnb profit potential in Area C (Silver Star).
Seasonal Strategies for Maximizing Profit
- Peak Season: Maximize revenue through premium pricing and potentially longer minimum stays. Ensure high availability.
- Low Season: Offer competitive pricing, special promotions (e.g., extended stay discounts), and flexible cancellation policies. Target off-season travelers like remote workers or budget-conscious guests.
- Shoulder Seasons: Implement dynamic pricing that balances peak and low rates. Target weekend travelers or specific events. Offer slightly more flexible terms than peak season.
- Regularly analyze your own performance against these Area C (Silver Star) seasonality benchmarks and adjust your pricing and availability strategy accordingly.
Best Areas for Airbnb Investment in Area C (Silver Star) (2026)
Exploring the top neighborhoods for short-term rentals in Area C (Silver Star)? This section highlights key areas, outlining why they are attractive for hosts and guests, along with notable local attractions. Consider these locations based on your target guest profile and investment strategy.
| Neighborhood / Area | Why Host Here? (Target Guests & Appeal) | Key Attractions & Landmarks |
|---|---|---|
| Silver Star Village | A charming alpine village known for its world-class skiing and snowboarding. It's a prime location for winter sports enthusiasts and families seeking a cozy getaway in the mountains. | Silver Star Mountain Resort, Vernon Snowpark, Cross-Country Ski Trails, Snowshoeing Trails, Mountain Biking Trails, Silver Star Village shops and restaurants |
| Monashee Mountains | A stunning mountain range that attracts outdoor adventurers year-round, offering opportunities for hiking, mountain biking, and winter sports. It's ideal for nature lovers and those looking for a peaceful retreat. | Monashee Provincial Park, Hiking Trails, Scenic Viewpoints, Wildlife Viewing, Campgrounds, Fishing Spots |
| Okanagan Lake | A beautiful lake area perfect for summer vacations, known for water sports, beaches, and scenic views. Ideal for families and travelers wanting a warm-weather escape. | Okanagan Lake Provincial Park, Beach Access, Water Sports Rentals, Walking and Biking Trails, Local Wineries, Fishing |
| Vernon | A nearby city with vibrant culture and access to outdoor activities. It's a great base for guests wanting both urban amenities and natural attractions. | Kalamalka Lake Provincial Park, Okanagan Science Centre, Historic O'Keefe Ranch, Vernon Arts Centre, Local Farmers Market, Paddleboarding on the lakes |
| Enderby | A small town surrounded by beautiful landscapes, known for its artsy community and outdoor activities. Perfect for guests seeking a quieter experience with access to nature. | Enderby Cliffs Provincial Park, Riverside Park, Local Art Galleries, Fishing in the Shuswap River, Hiking Trails, Nearby Vineyards |
| Coldstream | Known for its agriculture and proximity to nature, Coldstream offers a peaceful escape with easy access to outdoor activities. A great choice for those wanting a more relaxed environment. | Coldstream Creek Provincial Park, Wildlife Viewing, Bike Trails, Local Wineries, Community Events, Parks and Recreation Areas |
| Lumby | A quaint village with a friendly community and access to outdoor pursuits. It's great for families and those looking for a rural experience. | Lumby Valley Park, Hiking Trails, Fishing Opportunities, Local Markets, Community Events, Historic Sites |
| Bella Vista | A neighborhood with sweeping views of Okanagan Lake and the mountains, perfect for those wanting scenic beauty and outdoor adventures. | Scenic Outlooks, Hiking Trails, Parks and Recreation Areas, Proximity to Wineries, Okanagan Lake Activities, Wildlife Viewing |
Understanding Airbnb License Requirements & STR Laws in Area C (Silver Star) (2026)
Yes, Area C (Silver Star), British Columbia, Canada enforces high STR regulations. Obtaining a license and ensuring compliance is almost certainly required according to current 2026 STR laws. Always verify the latest short term rental regulations and Airbnb license requirements directly with local government authorities for Area C (Silver Star) to ensure full compliance before hosting.
(Source: AirROI data, 2026, based on 99% licensed listings)
Top Performing Airbnb Properties in Area C (Silver Star) (2026)
Benchmark your potential! Explore examples of top-performing Airbnb properties in Area C (Silver Star)based on Trailing Twelve Month (TTM) revenue. Analyze their characteristics, revenue, occupancy rate, and ADR to understand what drives success in this market.
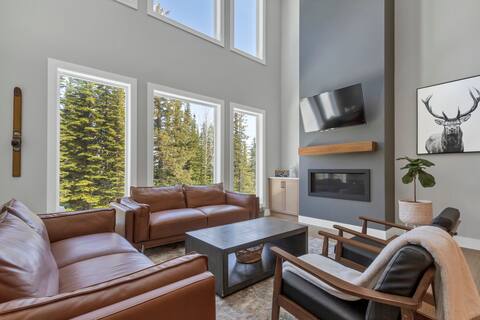
Executive Mountain Retreat
Entire Place • 4 bedrooms
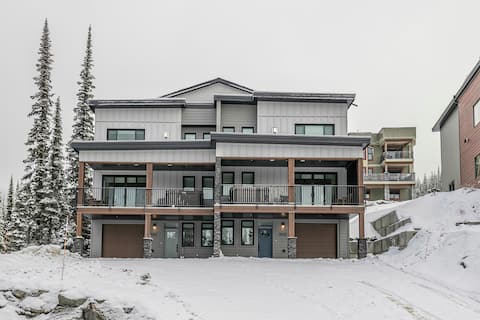
Entire duplex 2, hot tubs, garage & on the skiway
Entire Place • 6 bedrooms

Welcome La Casita Hobby Farm
Entire Place • 4 bedrooms

Silverstar Ski Chalet with hot tub
Entire Place • 3 bedrooms

Twin Peaks A at Silver Star. Trailside Joy!
Entire Place • 4 bedrooms

4 Bedroom Suite - Ski-in Ski-out, sleeps 17!
Entire Place • 4 bedrooms
Note: Performance varies based on location, size, amenities, seasonality, and management quality. Data reflects the past 12 months.
Top Performing Airbnb Hosts in Area C (Silver Star) (2026)
Learn from the best! This table showcases top-performing Airbnb hosts in Area C (Silver Star) based on the number of properties managed and estimated total revenue over the past year. Analyze their scale and performance metrics.
| Host Name | Properties | Grossing Revenue | Stay Reviews | Avg Rating |
|---|---|---|---|---|
| Silver Star Stays | 144 | $3,252,720 | 1812 | 4.86/5.0 |
| Samson Waters Canada | 14 | $626,390 | 122 | 4.82/5.0 |
| Tanis | 6 | $234,307 | 194 | 4.86/5.0 |
| Nomadics Vacation Rentals | 3 | $112,173 | 92 | 4.59/5.0 |
| Kyla | 1 | $110,925 | 22 | 4.91/5.0 |
| Cristina | 1 | $82,641 | 65 | 4.86/5.0 |
| Christina | 1 | $81,349 | 50 | 4.94/5.0 |
| Philip | 1 | $81,345 | 57 | 5.00/5.0 |
| Lance | 2 | $78,018 | 407 | 4.99/5.0 |
| Mark | 1 | $76,158 | 14 | 4.93/5.0 |
Analyzing the strategies of top hosts, such as their property selection, pricing, and guest communication, can offer valuable lessons for optimizing your own Airbnb operations in Area C (Silver Star).
Dive Deeper: Advanced Area C (Silver Star) STR Market Data (2026)
Ready to unlock more insights? AirROI provides access to advanced metrics and comprehensive Airbnb data for Area C (Silver Star). Explore detailed analytics beyond this report to refine your investment strategy, optimize pricing, and maximize your vacation rental profits.
Explore Advanced MetricsArea C (Silver Star) Short-Term Rental Market Composition (2026): Property & Room Types
Room Type Distribution
Property Type Distribution
Market Composition Insights for Area C (Silver Star)
- The Area C (Silver Star) Airbnb market composition is heavily skewed towards Entire Home/Apt listings, which make up 99.2% of the 249 active rentals. This indicates strong guest preference for privacy and space.
- Looking at the property type distribution in Area C (Silver Star), House properties are the most common (47.8%), reflecting the local real estate landscape.
- Houses represent a significant 47.8% portion, catering likely to families or larger groups.
- Smaller segments like outdoor/unique, hotel/boutique (combined 5.6%) offer potential for unique stay experiences.
Area C (Silver Star) Airbnb Room Capacity Analysis (2026): Bedroom Distribution
Distribution of Listings by Number of Bedrooms
Room Capacity Insights for Area C (Silver Star)
- The dominant room capacity in Area C (Silver Star) is 2 bedrooms listings, making up 30.9% of the market. This suggests a strong demand for properties suitable for couples or solo travelers.
- Together, 2 bedrooms and 3 bedrooms properties represent 48.6% of the active Airbnb listings in Area C (Silver Star), indicating a high concentration in these sizes.
- A significant 45.4% of listings offer 3+ bedrooms, catering to larger groups and families seeking more space in Area C (Silver Star).
Area C (Silver Star) Vacation Rental Guest Capacity Trends (2026)
Distribution of Listings by Guest Capacity
Guest Capacity Insights for Area C (Silver Star)
- The most common guest capacity trend in Area C (Silver Star) vacation rentals is listings accommodating 8+ guests (46.2%). This suggests the primary traveler segment is likely larger groups.
- Properties designed for 8+ guests and 4 guests dominate the Area C (Silver Star) STR market, accounting for 60.7% of listings.
- 69.5% of properties accommodate 6+ guests, serving the market segment for larger families or group travel in Area C (Silver Star).
- On average, properties in Area C (Silver Star) are equipped to host 6.3 guests.
Area C (Silver Star) Airbnb Booking Patterns (2026): Available vs. Booked Days
Available Days Distribution
Booked Days Distribution
Booking Pattern Insights for Area C (Silver Star)
- The most common availability pattern in Area C (Silver Star) falls within the 271-366 days range, representing 66.3% of listings. This suggests many properties have significant open periods on their calendars.
- Approximately 88.8% of listings show high availability (181+ days open annually), indicating potential for increased bookings or specific owner usage patterns.
- For booked days, the 31-90 days range is most frequent in Area C (Silver Star) (47%), reflecting common guest stay durations or potential owner blocking patterns.
- A notable 11.2% of properties secure long booking periods (181+ days booked per year), highlighting successful long-term rental strategies or significant owner usage.
Area C (Silver Star) Airbnb Minimum Stay Requirements Analysis
Distribution of Listings by Minimum Night Requirement
1 Night
9 listings
3.6% of total
2 Nights
21 listings
8.4% of total
3 Nights
74 listings
29.7% of total
4-6 Nights
15 listings
6% of total
7-29 Nights
1 listings
0.4% of total
30+ Nights
129 listings
51.8% of total
Key Insights
- The most prevalent minimum stay requirement in Area C (Silver Star) is 30+ Nights, adopted by 51.8% of listings. This highlights the market's preference for longer commitments.
- Very short stays (1-2 nights) are less common (12.0%), suggesting hosts prefer slightly longer bookings to optimize turnover.
- A significant segment (51.8%) caters to monthly stays (30+ nights) in Area C (Silver Star), pointing to opportunities in the extended-stay market.
Recommendations
- Align with the market by considering a 30+ Nights minimum stay, as 51.8% of Area C (Silver Star) hosts use this setting.
- If feasible, allowing 1-night stays, especially midweek or during low season, could capture last-minute bookings, as only 3.6% currently do.
- Explore offering discounts for stays of 30+ nights to attract the 51.8% of the market seeking extended stays.
- Adjust minimum nights based on seasonality – potentially shorter during low season and longer during peak demand periods in Area C (Silver Star).
Area C (Silver Star) Airbnb Cancellation Policy Trends Analysis (2026)
Limited
5 listings
2% of total
Super Strict 30 Days
154 listings
61.8% of total
Flexible
7 listings
2.8% of total
Moderate
25 listings
10% of total
Firm
54 listings
21.7% of total
Strict
4 listings
1.6% of total
Cancellation Policy Insights for Area C (Silver Star)
- The prevailing Airbnb cancellation policy trend in Area C (Silver Star) is Super Strict 30 Days, used by 61.8% of listings.
- There's a relatively balanced mix between guest-friendly (12.8%) and stricter (23.3%) policies, offering choices for different guest needs.
- Strict cancellation policies are quite rare (1.6%), potentially making listings with this policy less competitive unless justified by high demand or property type.
Recommendations for Hosts
- Consider adopting a Super Strict 30 Days policy to align with the 61.8% market standard in Area C (Silver Star).
- Using a Strict policy might deter some guests, as only 1.6% of listings use it. Evaluate if potential revenue protection outweighs possible lower booking rates.
- Regularly review your cancellation policy against competitors and market demand shifts in Area C (Silver Star).
Area C (Silver Star) STR Booking Lead Time Analysis (2026)
Average Booking Lead Time by Month
Booking Lead Time Insights for Area C (Silver Star)
- The overall average booking lead time for vacation rentals in Area C (Silver Star) is 89 days.
- Guests book furthest in advance for stays during January (average 122 days), likely coinciding with peak travel demand or local events.
- The shortest booking windows occur for stays in May (average 43 days), indicating more last-minute travel plans during this time.
- Seasonally, Winter (119 days avg.) sees the longest lead times, while Summer (52 days avg.) has the shortest, reflecting typical travel planning cycles.
Recommendations for Hosts
- Use the overall average lead time (89 days) as a baseline for your pricing and availability strategy in Area C (Silver Star).
- For January stays, consider implementing length-of-stay discounts or slightly higher rates for bookings made less than 122 days out to capitalize on advance planning.
- Target marketing efforts for the Winter season well in advance (at least 119 days) to capture early planners.
- Monitor your own booking lead times against these Area C (Silver Star) averages to identify opportunities for dynamic pricing adjustments.
Popular & Essential Airbnb Amenities in Area C (Silver Star) (2026)
Amenity Prevalence
Amenity Insights for Area C (Silver Star)
- Essential amenities in Area C (Silver Star) that guests expect include: Wifi, Free parking on premises, Heating, Smoke alarm, Kitchen, TV, Refrigerator, Hot water, Dishes and silverware, Coffee maker. Lacking these (any) could significantly impact bookings.
Recommendations for Hosts
- Ensure your listing includes all essential amenities for Area C (Silver Star): Wifi, Free parking on premises, Heating, Smoke alarm, Kitchen, TV, Refrigerator, Hot water, Dishes and silverware, Coffee maker.
- Prioritize adding missing essentials: Free parking on premises, Heating, Smoke alarm, Kitchen, TV, Refrigerator, Hot water, Dishes and silverware, Coffee maker.
- Highlight unique or less common amenities you offer (e.g., hot tub, dedicated workspace, EV charger) in your listing description and photos.
- Regularly check competitor amenities in Area C (Silver Star) to stay competitive.
Area C (Silver Star) Airbnb Guest Demographics & Profile Analysis (2026)
Guest Profile Summary for Area C (Silver Star)
- The typical guest profile for Airbnb in Area C (Silver Star) consists of primarily domestic travelers (80%), often arriving from nearby Vancouver, typically belonging to the Post-2000s (Gen Z/Alpha) group (50%), primarily speaking English or French.
- Domestic travelers account for 80.2% of guests.
- Key international markets include Canada (80.2%) and United States (9.2%).
- Top languages spoken are English (62.5%) followed by French (12.4%).
- A significant demographic segment is the Post-2000s (Gen Z/Alpha) group, representing 50% of guests.
Recommendations for Hosts
- Target domestic marketing efforts towards travelers from Vancouver and Calgary.
- Tailor amenities and listing descriptions to appeal to the dominant Post-2000s (Gen Z/Alpha) demographic (e.g., highlight fast WiFi, smart home features, local guides).
- Highlight unique local experiences or amenities relevant to the primary guest profile.
- Consider seasonal promotions aligned with peak travel times for key origin markets.
Nearby Short-Term Rental Market Comparison
How does the Area C (Silver Star) Airbnb market stack up against its neighbors? Compare key performance metrics like average monthly revenue, ADR, and occupancy rates in surrounding areas to understand the broader regional STR landscape.
| Market | Active Properties | Monthly Revenue | Daily Rate | Avg. Occupancy |
|---|---|---|---|---|
| Revelstoke | 275 | $3,096 | $285.35 | 46% |
| Westbank First Nation #9 | 69 | $2,825 | $227.51 | 55% |
| Area B (Shelter Bay/Mica Creek) | 75 | $2,753 | $306.38 | 40% |
| Area E (Naramata/Greyback) | 74 | $2,720 | $276.87 | 48% |
| West Kelowna | 376 | $2,682 | $251.30 | 50% |
| Area M (Beautiful Nicola Valley - North) | 11 | $2,505 | $256.98 | 39% |
| Area H (Manning Park/Tulameen/Siwash) | 42 | $2,493 | $274.63 | 38% |
| Lake Country | 126 | $2,491 | $277.02 | 49% |
| Area P (Rivers and the Peaks) | 20 | $2,470 | $287.48 | 45% |
| Area C (Inkaneep/Willowbrook) | 35 | $2,423 | $212.38 | 51% |