Razlog Airbnb Market Analysis 2026: Short Term Rental Data & Vacation Rental Statistics in Blagoevgrad, Bulgaria
Is Airbnb profitable in Razlog in 2026? Explore comprehensive Airbnb analytics for Razlog, Blagoevgrad, Bulgaria to uncover income potential. This 2026 STR market report for Razlog, based on AirROI data from February 2025 to January 2026, reveals key trends in the niche market of 88 active listings.
Whether you're considering an Airbnb investment in Razlog, optimizing your existing vacation rental, or exploring rental arbitrage opportunities, understanding the Razlog Airbnb data is crucial. Leveraging the low regulation environment is key to maximizing your short term rental income potential. Let's dive into the specifics.
Key Razlog Airbnb Performance Metrics Overview
Monthly Airbnb Revenue Variations & Income Potential in Razlog (2026)
Understanding the monthly revenue variations for Airbnb listings in Razlog is key to maximizing your short term rental income potential. Seasonality significantly impacts earnings. Our analysis, based on data from the past 12 months, shows that the peak revenue month for STRs in Razlog is typically February, while May often presents the lowest earnings, highlighting opportunities for strategic pricing adjustments during shoulder and low seasons. Explore the typical Airbnb income in Razlog across different performance tiers:
- Best-in-class properties (Top 10%) achieve $3,729+ monthly, often utilizing dynamic pricing and superior guest experiences.
- Strong performing properties (Top 25%) earn $1,777 or more, indicating effective management and desirable locations/amenities.
- Typical properties (Median) generate around $689 per month, representing the average market performance.
- Entry-level properties (Bottom 25%) see earnings around $306, often with potential for optimization.
Average Monthly Airbnb Earnings Trend in Razlog
Razlog Airbnb Occupancy Rate Trends (2026)
Maximize your bookings by understanding the Razlog STR occupancy trends. Seasonal demand shifts significantly influence how often properties are booked. Typically, Februarysees the highest demand (peak season occupancy), while January experiences the lowest (low season). Effective strategies, like adjusting minimum stays or offering promotions, can boost occupancy during slower periods. Here's how different property tiers perform in Razlog:
- Best-in-class properties (Top 10%) achieve 59%+ occupancy, indicating high desirability and potentially optimized availability.
- Strong performing properties (Top 25%) maintain 39% or higher occupancy, suggesting good market fit and guest satisfaction.
- Typical properties (Median) have an occupancy rate around 22%.
- Entry-level properties (Bottom 25%) average 10% occupancy, potentially facing higher vacancy.
Average Monthly Occupancy Rate Trend in Razlog
Average Daily Rate (ADR) Airbnb Trends in Razlog (2026)
Effective short term rental pricing strategy in Razlog involves understanding monthly ADR fluctuations. The Average Daily Rate (ADR) for Airbnb in Razlog typically peaks in December and dips lowest during April. Leveraging Airbnb dynamic pricing tools or strategies based on this seasonality can significantly boost revenue. Here's a look at the typical nightly rates achieved:
- Best-in-class properties (Top 10%) command rates of $393+ per night, often due to premium features or locations.
- Strong performing properties (Top 25%) achieve nightly rates of $192 or more.
- Typical properties (Median) charge around $86 per night.
- Entry-level properties (Bottom 25%) earn around $53 per night.
Average Daily Rate (ADR) Trend by Month in Razlog
Get Live Razlog Market Intelligence 👇

Explore Real-time Analytics
Airbnb Seasonality Analysis & Trends in Razlog (2026)
Peak Season (February, August, December)
- Revenue averages $1,911 per month
- Occupancy rates average 33.6%
- Daily rates average $173
Shoulder Season
- Revenue averages $1,420 per month
- Occupancy maintains around 26.7%
- Daily rates hold near $170
Low Season (March, May, June)
- Revenue drops to average $939 per month
- Occupancy decreases to average 24.5%
- Daily rates adjust to average $160
Seasonality Insights for Razlog
- The Airbnb seasonality in Razlog shows highly seasonal trends requiring careful strategy. While the sections above show seasonal averages, it's also insightful to look at the extremes:
- During the high season, the absolute peak month showcases Razlog's highest earning potential, with monthly revenues capable of climbing to $2,142, occupancy reaching a high of 39.6%, and ADRs peaking at $191.
- Conversely, the slowest single month of the year, typically falling within the low season, marks the market's lowest point. In this month, revenue might dip to $904, occupancy could drop to 20.2%, and ADRs may adjust down to $154.
- Understanding both the seasonal averages and these monthly peaks and troughs in revenue, occupancy, and ADR is crucial for maximizing your Airbnb profit potential in Razlog.
Seasonal Strategies for Maximizing Profit
- Peak Season: Maximize revenue through premium pricing and potentially longer minimum stays. Ensure high availability.
- Low Season: Offer competitive pricing, special promotions (e.g., extended stay discounts), and flexible cancellation policies. Target off-season travelers like remote workers or budget-conscious guests.
- Shoulder Seasons: Implement dynamic pricing that balances peak and low rates. Target weekend travelers or specific events. Offer slightly more flexible terms than peak season.
- Regularly analyze your own performance against these Razlog seasonality benchmarks and adjust your pricing and availability strategy accordingly.
Best Areas for Airbnb Investment in Razlog (2026)
Exploring the top neighborhoods for short-term rentals in Razlog? This section highlights key areas, outlining why they are attractive for hosts and guests, along with notable local attractions. Consider these locations based on your target guest profile and investment strategy.
| Neighborhood / Area | Why Host Here? (Target Guests & Appeal) | Key Attractions & Landmarks |
|---|---|---|
| Razlog Center | The heart of Razlog, providing access to local shops, restaurants, and cultural sites. Ideal for tourists who want to experience the local lifestyle and amenities. | Razlog Market, Church of St. John, Razlog Historical Museum, Local cafes and restaurants, Pirin Mountain views |
| Bansko Ski Resort | An acclaimed ski resort located a short distance from Razlog, popular among ski enthusiasts and winter sports lovers, making it a prime location for winter tourism. | Ski lifts and slopes, Bansko Gondola, Ski schools, Bansko nightlife, Hot springs nearby |
| Dobrinishte | A small, picturesque town known for its mineral waters and close proximity to Bansko, offering a relaxing environment with natural beauty. | Dobrinishte Mineral Baths, Pirin National Park, Hiking trails, Local thermal springs |
| Pirin National Park | A UNESCO World Heritage Site known for its stunning natural landscapes, attracting eco-tourists and adventure seekers throughout the year. | Hiking and trekking routes, Wildlife viewing, Natural hot springs, Glacial lakes, Scenic views |
| Kordopulov House | A historical site in the nearby village of Melnik, famous for its unique architecture and wine culture, attracting cultural tourists. | Kordopulov House Museum, Wine tastings, Melnik Museum, Local wineries |
| Yundola Pass | A scenic mountain pass that is popular for hiking and nature walks, offering incredible views and a quiet retreat for those looking to escape the city. | Hiking routes, Pine forests, Rural landscapes, Picnic spots |
| Pirin Golf & Country Club | A luxury golf resort located near Razlog, attracting visitors who enjoy golfing and upscale amenities. | Golf course, Spa and wellness center, Fine dining, Luxury accommodations |
| Local Villages | Charming villages nearby like Bachevo and Gorno Draglishte, offering authentic Bulgarian experiences and rich cultural heritage. | Traditional Bulgarian architecture, Local festivals, Artisan shops and crafts, Beautiful countryside |
Understanding Airbnb License Requirements & STR Laws in Razlog (2026)
While Razlog, Blagoevgrad, Bulgaria currently shows low STR regulations, specific Airbnb license requirements might still exist or change. Always verify the latest short term rental regulations and Airbnb license requirements directly with local government authorities for Razlog to ensure full compliance before hosting.
(Source: AirROI data, 2026, finding no licensed listings among those analyzed)
Top Performing Airbnb Properties in Razlog (2026)
Benchmark your potential! Explore examples of top-performing Airbnb properties in Razlogbased on Trailing Twelve Month (TTM) revenue. Analyze their characteristics, revenue, occupancy rate, and ADR to understand what drives success in this market.

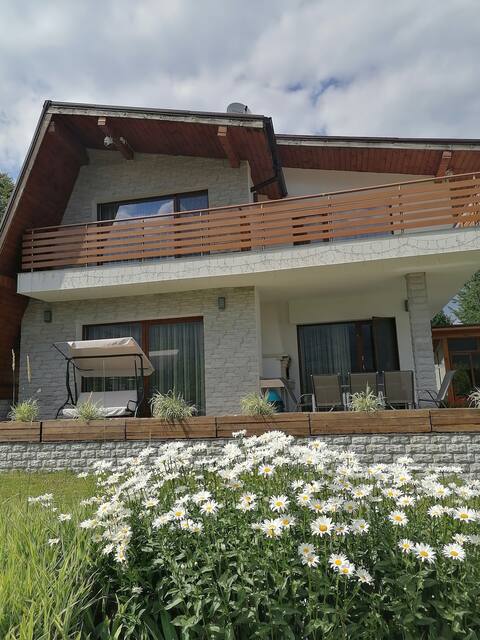
Pirin Golf Villa Relax_5 bedrooms_Bansko
Entire Place • 5 bedrooms

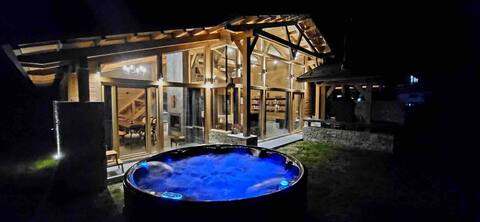
CHALET MARIA golf & ski
Entire Place • 5 bedrooms
Guest house Radost Guest house Radost
Entire Place • 3 bedrooms
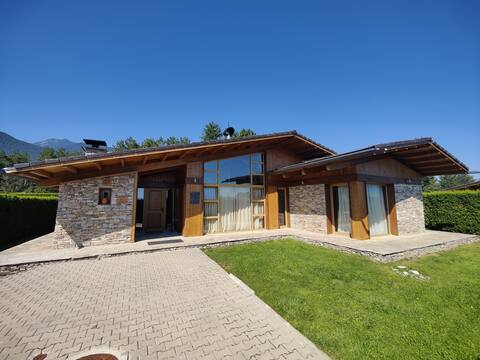
VILLA DONNA- Golf&Ski (Mountain Hawk chalet park)
Entire Place • 5 bedrooms
MAGNET - private chalet in the heart of Pirin
Entire Place • 3 bedrooms

VILLA MIRA - golf & ski Mountain Hawk chalet park
Entire Place • 5 bedrooms
Note: Performance varies based on location, size, amenities, seasonality, and management quality. Data reflects the past 12 months.
Top Performing Airbnb Hosts in Razlog (2026)
Learn from the best! This table showcases top-performing Airbnb hosts in Razlog based on the number of properties managed and estimated total revenue over the past year. Analyze their scale and performance metrics.
| Host Name | Properties | Grossing Revenue | Stay Reviews | Avg Rating |
|---|---|---|---|---|
| Yassen | 4 | $152,531 | 33 | 4.88/5.0 |
| Franko | 4 | $94,305 | 78 | 4.83/5.0 |
| Светослава | 1 | $72,209 | 6 | 4.83/5.0 |
| Radoslava | 1 | $44,548 | 28 | 5.00/5.0 |
| Sol | 1 | $40,021 | 36 | 5.00/5.0 |
| Olga | 1 | $36,771 | 12 | 5.00/5.0 |
| Galina | 3 | $27,320 | 37 | 4.81/5.0 |
| Kristina | 1 | $22,965 | 13 | 4.69/5.0 |
| Beatris | 1 | $16,813 | 1 | Not Rated |
| Pirin Golf & Country Club | 5 | $16,786 | 7 | Not Rated |
Analyzing the strategies of top hosts, such as their property selection, pricing, and guest communication, can offer valuable lessons for optimizing your own Airbnb operations in Razlog.
Dive Deeper: Advanced Razlog STR Market Data (2026)
Ready to unlock more insights? AirROI provides access to advanced metrics and comprehensive Airbnb data for Razlog. Explore detailed analytics beyond this report to refine your investment strategy, optimize pricing, and maximize your vacation rental profits.
Explore Advanced MetricsRazlog Short-Term Rental Market Composition (2026): Property & Room Types
Room Type Distribution
Property Type Distribution
Market Composition Insights for Razlog
- The Razlog Airbnb market composition is heavily skewed towards Entire Home/Apt listings, which make up 95.5% of the 88 active rentals. This indicates strong guest preference for privacy and space.
- Looking at the property type distribution in Razlog, Apartment/Condo properties are the most common (64.8%), reflecting the local real estate landscape.
- Houses represent a significant 29.5% portion, catering likely to families or larger groups.
- Smaller segments like hotel/boutique, others (combined 5.7%) offer potential for unique stay experiences.
Razlog Airbnb Room Capacity Analysis (2026): Bedroom Distribution
Distribution of Listings by Number of Bedrooms
Room Capacity Insights for Razlog
- The dominant room capacity in Razlog is 1 bedroom listings, making up 46.6% of the market. This suggests a strong demand for properties suitable for couples or solo travelers.
- Together, 1 bedroom and 3 bedrooms properties represent 65.9% of the active Airbnb listings in Razlog, indicating a high concentration in these sizes.
- A significant 29.5% of listings offer 3+ bedrooms, catering to larger groups and families seeking more space in Razlog.
Razlog Vacation Rental Guest Capacity Trends (2026)
Distribution of Listings by Guest Capacity
Guest Capacity Insights for Razlog
- The most common guest capacity trend in Razlog vacation rentals is listings accommodating 4 guests (33%). This suggests the primary traveler segment is likely small families or groups.
- Properties designed for 4 guests and 8+ guests dominate the Razlog STR market, accounting for 51.2% of listings.
- 38.6% of properties accommodate 6+ guests, serving the market segment for larger families or group travel in Razlog.
- On average, properties in Razlog are equipped to host 4.9 guests.
Razlog Airbnb Booking Patterns (2026): Available vs. Booked Days
Available Days Distribution
Booked Days Distribution
Booking Pattern Insights for Razlog
- The most common availability pattern in Razlog falls within the 271-366 days range, representing 80.7% of listings. This suggests many properties have significant open periods on their calendars.
- Approximately 96.6% of listings show high availability (181+ days open annually), indicating potential for increased bookings or specific owner usage patterns.
- For booked days, the 1-30 days range is most frequent in Razlog (43.2%), reflecting common guest stay durations or potential owner blocking patterns.
- A notable 3.4% of properties secure long booking periods (181+ days booked per year), highlighting successful long-term rental strategies or significant owner usage.
Razlog Airbnb Minimum Stay Requirements Analysis
Distribution of Listings by Minimum Night Requirement
1 Night
12 listings
13.6% of total
2 Nights
46 listings
52.3% of total
3 Nights
3 listings
3.4% of total
4-6 Nights
4 listings
4.5% of total
7-29 Nights
1 listings
1.1% of total
30+ Nights
22 listings
25% of total
Key Insights
- The most prevalent minimum stay requirement in Razlog is 2 Nights, adopted by 52.3% of listings. This highlights the market's preference for shorter, flexible bookings.
- A strong majority (65.9%) of the Razlog Airbnb data shows acceptance of very short stays (1-2 nights), indicating a dynamic, high-turnover market.
- A significant segment (25%) caters to monthly stays (30+ nights) in Razlog, pointing to opportunities in the extended-stay market.
Recommendations
- Align with the market by considering a 2 Nights minimum stay, as 52.3% of Razlog hosts use this setting.
- If feasible, allowing 1-night stays, especially midweek or during low season, could capture last-minute bookings, as only 13.6% currently do.
- A 2-night minimum appears standard (52.3%). Consider this for weekends or peak periods.
- Explore offering discounts for stays of 30+ nights to attract the 25% of the market seeking extended stays.
- Adjust minimum nights based on seasonality – potentially shorter during low season and longer during peak demand periods in Razlog.
Razlog Airbnb Cancellation Policy Trends Analysis (2026)
Limited
1 listings
1.1% of total
Flexible
21 listings
23.9% of total
Moderate
29 listings
33% of total
Firm
30 listings
34.1% of total
Strict
7 listings
8% of total
Cancellation Policy Insights for Razlog
- The prevailing Airbnb cancellation policy trend in Razlog is Firm, used by 34.1% of listings.
- There's a relatively balanced mix between guest-friendly (56.9%) and stricter (42.1%) policies, offering choices for different guest needs.
- Strict cancellation policies are quite rare (8%), potentially making listings with this policy less competitive unless justified by high demand or property type.
Recommendations for Hosts
- Consider adopting a Firm policy to align with the 34.1% market standard in Razlog.
- Using a Strict policy might deter some guests, as only 8% of listings use it. Evaluate if potential revenue protection outweighs possible lower booking rates.
- Regularly review your cancellation policy against competitors and market demand shifts in Razlog.
Razlog STR Booking Lead Time Analysis (2026)
Average Booking Lead Time by Month
Booking Lead Time Insights for Razlog
- The overall average booking lead time for vacation rentals in Razlog is 38 days.
- Guests book furthest in advance for stays during December (average 51 days), likely coinciding with peak travel demand or local events.
- The shortest booking windows occur for stays in November (average 19 days), indicating more last-minute travel plans during this time.
- Seasonally, Winter (43 days avg.) sees the longest lead times, while Fall (25 days avg.) has the shortest, reflecting typical travel planning cycles.
Recommendations for Hosts
- Use the overall average lead time (38 days) as a baseline for your pricing and availability strategy in Razlog.
- For December stays, consider implementing length-of-stay discounts or slightly higher rates for bookings made less than 51 days out to capitalize on advance planning.
- Target marketing efforts for the Winter season well in advance (at least 43 days) to capture early planners.
- Monitor your own booking lead times against these Razlog averages to identify opportunities for dynamic pricing adjustments.
Popular & Essential Airbnb Amenities in Razlog (2026)
Amenity Prevalence
Amenity Insights for Razlog
- Essential amenities in Razlog that guests expect include: TV, Kitchen, Free parking on premises. Lacking these (any) could significantly impact bookings.
- Popular amenities like Heating, Wifi, Hangers are common but not universal. Offering these can provide a competitive edge.
- Warning: Wifi is not universally provided but is considered essential globally. Ensure reliable Wifi is offered.
Recommendations for Hosts
- Ensure your listing includes all essential amenities for Razlog: TV, Kitchen, Free parking on premises.
- Prioritize adding missing essentials: TV, Kitchen, Free parking on premises.
- Consider adding popular differentiators like Heating or Wifi to increase appeal.
- Highlight unique or less common amenities you offer (e.g., hot tub, dedicated workspace, EV charger) in your listing description and photos.
- Regularly check competitor amenities in Razlog to stay competitive.
Razlog Airbnb Guest Demographics & Profile Analysis (2026)
Guest Profile Summary for Razlog
- The typical guest profile for Airbnb in Razlog consists of predominantly international visitors (70%), with top international origins including United Kingdom, typically belonging to the Post-2000s (Gen Z/Alpha) group (50%), primarily speaking English or German.
- Domestic travelers account for 30.5% of guests.
- Key international markets include Bulgaria (30.5%) and United Kingdom (8.5%).
- Top languages spoken are English (40.4%) followed by German (9%).
- A significant demographic segment is the Post-2000s (Gen Z/Alpha) group, representing 50% of guests.
Recommendations for Hosts
- Focus marketing internationally, particularly towards travelers from United Kingdom.
- Tailor amenities and listing descriptions to appeal to the dominant Post-2000s (Gen Z/Alpha) demographic (e.g., highlight fast WiFi, smart home features, local guides).
- Highlight unique local experiences or amenities relevant to the primary guest profile.
- Consider seasonal promotions aligned with peak travel times for key origin markets.
Nearby Short-Term Rental Market Comparison
How does the Razlog Airbnb market stack up against its neighbors? Compare key performance metrics like average monthly revenue, ADR, and occupancy rates in surrounding areas to understand the broader regional STR landscape.
| Market | Active Properties | Monthly Revenue | Daily Rate | Avg. Occupancy |
|---|---|---|---|---|
| Panorama Municipal Unit | 11 | $1,735 | $285.42 | 36% |
| Apriltsi | 13 | $1,698 | $296.05 | 31% |
| Thermaikos Municipality | 23 | $1,600 | $193.25 | 45% |
| Pancharevo | 10 | $1,582 | $242.67 | 17% |
| Νέα Μουδανιά | 18 | $1,572 | $193.08 | 46% |
| Polychrono | 16 | $1,537 | $250.15 | 47% |
| Chaniotis | 15 | $1,458 | $292.92 | 40% |
| Γεωπονικά | 12 | $1,267 | $154.02 | 46% |
| Municipality of Nea Propontida | 65 | $1,197 | $191.77 | 43% |
| Neos Marmaras | 25 | $1,197 | $230.50 | 41% |