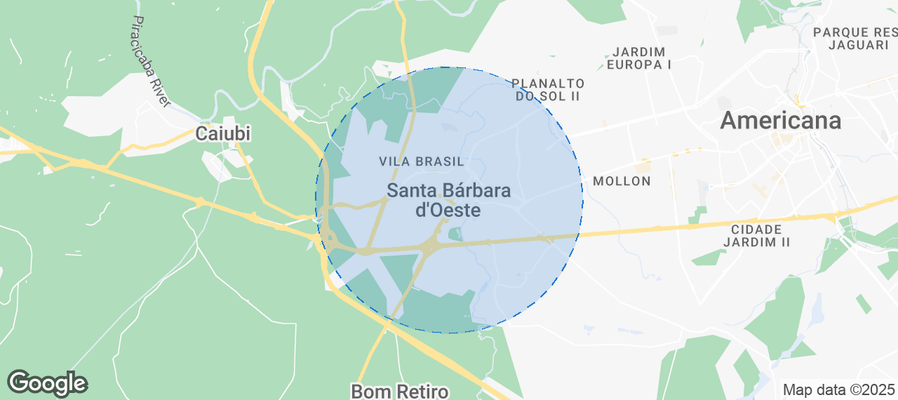
Santa Bárbara d'Oeste Airbnb Market Analysis 2026: Short Term Rental Data & Vacation Rental Statistics in São Paulo, Brazil
Is Airbnb profitable in Santa Bárbara d'Oeste in 2026? Explore comprehensive Airbnb analytics for Santa Bárbara d'Oeste, São Paulo, Brazil to uncover income potential. This 2026 STR market report for Santa Bárbara d'Oeste, based on AirROI data from February 2025 to January 2026, reveals key trends in the niche market of 29 active listings.
Whether you're considering an Airbnb investment in Santa Bárbara d'Oeste, optimizing your existing vacation rental, or exploring rental arbitrage opportunities, understanding the Santa Bárbara d'Oeste Airbnb data is crucial. Leveraging the low regulation environment is key to maximizing your short term rental income potential. Let's dive into the specifics.
Key Santa Bárbara d'Oeste Airbnb Performance Metrics Overview
Monthly Airbnb Revenue Variations & Income Potential in Santa Bárbara d'Oeste (2026)
Understanding the monthly revenue variations for Airbnb listings in Santa Bárbara d'Oeste is key to maximizing your short term rental income potential. Seasonality significantly impacts earnings. Our analysis, based on data from the past 12 months, shows that the peak revenue month for STRs in Santa Bárbara d'Oeste is typically December, while May often presents the lowest earnings, highlighting opportunities for strategic pricing adjustments during shoulder and low seasons. Explore the typical Airbnb income in Santa Bárbara d'Oeste across different performance tiers:
- Best-in-class properties (Top 10%) achieve $1,582+ monthly, often utilizing dynamic pricing and superior guest experiences.
- Strong performing properties (Top 25%) earn $863 or more, indicating effective management and desirable locations/amenities.
- Typical properties (Median) generate around $363 per month, representing the average market performance.
- Entry-level properties (Bottom 25%) see earnings around $176, often with potential for optimization.
Average Monthly Airbnb Earnings Trend in Santa Bárbara d'Oeste
Santa Bárbara d'Oeste Airbnb Occupancy Rate Trends (2026)
Maximize your bookings by understanding the Santa Bárbara d'Oeste STR occupancy trends. Seasonal demand shifts significantly influence how often properties are booked. Typically, Septembersees the highest demand (peak season occupancy), while May experiences the lowest (low season). Effective strategies, like adjusting minimum stays or offering promotions, can boost occupancy during slower periods. Here's how different property tiers perform in Santa Bárbara d'Oeste:
- Best-in-class properties (Top 10%) achieve 73%+ occupancy, indicating high desirability and potentially optimized availability.
- Strong performing properties (Top 25%) maintain 53% or higher occupancy, suggesting good market fit and guest satisfaction.
- Typical properties (Median) have an occupancy rate around 31%.
- Entry-level properties (Bottom 25%) average 17% occupancy, potentially facing higher vacancy.
Average Monthly Occupancy Rate Trend in Santa Bárbara d'Oeste
Average Daily Rate (ADR) Airbnb Trends in Santa Bárbara d'Oeste (2026)
Effective short term rental pricing strategy in Santa Bárbara d'Oeste involves understanding monthly ADR fluctuations. The Average Daily Rate (ADR) for Airbnb in Santa Bárbara d'Oeste typically peaks in December and dips lowest during March. Leveraging Airbnb dynamic pricing tools or strategies based on this seasonality can significantly boost revenue. Here's a look at the typical nightly rates achieved:
- Best-in-class properties (Top 10%) command rates of $157+ per night, often due to premium features or locations.
- Strong performing properties (Top 25%) achieve nightly rates of $111 or more.
- Typical properties (Median) charge around $44 per night.
- Entry-level properties (Bottom 25%) earn around $24 per night.
Average Daily Rate (ADR) Trend by Month in Santa Bárbara d'Oeste
Get Live Santa Bárbara d'Oeste Market Intelligence 👇
Explore Real-time Analytics
Airbnb Seasonality Analysis & Trends in Santa Bárbara d'Oeste (2026)
Peak Season (December, January, July)
- Revenue averages $896 per month
- Occupancy rates average 37.0%
- Daily rates average $79
Shoulder Season
- Revenue averages $633 per month
- Occupancy maintains around 38.5%
- Daily rates hold near $75
Low Season (March, April, May)
- Revenue drops to average $454 per month
- Occupancy decreases to average 34.1%
- Daily rates adjust to average $65
Seasonality Insights for Santa Bárbara d'Oeste
- The Airbnb seasonality in Santa Bárbara d'Oeste shows highly seasonal trends requiring careful strategy. While the sections above show seasonal averages, it's also insightful to look at the extremes:
- During the high season, the absolute peak month showcases Santa Bárbara d'Oeste's highest earning potential, with monthly revenues capable of climbing to $1,065, occupancy reaching a high of 44.0%, and ADRs peaking at $89.
- Conversely, the slowest single month of the year, typically falling within the low season, marks the market's lowest point. In this month, revenue might dip to $369, occupancy could drop to 26.6%, and ADRs may adjust down to $64.
- Understanding both the seasonal averages and these monthly peaks and troughs in revenue, occupancy, and ADR is crucial for maximizing your Airbnb profit potential in Santa Bárbara d'Oeste.
Seasonal Strategies for Maximizing Profit
- Peak Season: Maximize revenue through premium pricing and potentially longer minimum stays. Ensure high availability.
- Low Season: Offer competitive pricing, special promotions (e.g., extended stay discounts), and flexible cancellation policies. Target off-season travelers like remote workers or budget-conscious guests.
- Shoulder Seasons: Implement dynamic pricing that balances peak and low rates. Target weekend travelers or specific events. Offer slightly more flexible terms than peak season.
- Regularly analyze your own performance against these Santa Bárbara d'Oeste seasonality benchmarks and adjust your pricing and availability strategy accordingly.
Best Areas for Airbnb Investment in Santa Bárbara d'Oeste (2026)
Exploring the top neighborhoods for short-term rentals in Santa Bárbara d'Oeste? This section highlights key areas, outlining why they are attractive for hosts and guests, along with notable local attractions. Consider these locations based on your target guest profile and investment strategy.
| Neighborhood / Area | Why Host Here? (Target Guests & Appeal) | Key Attractions & Landmarks |
|---|---|---|
| Centro | The vibrant heart of Santa Bárbara d'Oeste with a mix of historical sites and modern amenities, making it attractive for both tourists and locals. | Igreja Matriz de Santa Bárbara, Museu da Imigração, Parque Jacques Guisard, Centro Cultural, Shoppingnieuw |
| Jardim São Paulo | A residential area that is growing in popularity, known for its parks and local services, ideal for families and long-term stays. | Parque dos Ipês, Shopping SB, supermarkets, local restaurants, family-friendly parks |
| Jardim do Lago | Known for its pleasant ambiance and proximity to the lake, this area offers beautiful views and leisure activities. | Lago de Santa Bárbara, walking trails, area parks, picnic spots, scenic viewpoints |
| Nova Santa Bárbara | A newer neighborhood with modern amenities and a focus on leisure, appealing to visitors looking for comfort and relaxation. | new shopping centers, restaurants and cafes, leisure parks, sports facilities, community events |
| Zona Sul | A fashionable neighborhood that attracts a younger crowd due to its nightlife and cultural offerings, perfect for short-term rentals. | nightclubs, bars and restaurants, art galleries, music venues, shopping areas |
| Parque Industrial | An up-and-coming area with a focus on business travelers, proximity to industry and commerce makes it a good spot for hosting. | business parks, industrial sites, transportation links, local services, restaurants |
| Santa Rita | A quiet and charming neighborhood, providing a peaceful stay while being close to local attractions and nature. | local parks, tree-lined streets, community markets, family-friendly spots, nature trails |
| Barão de Geraldo | An area known for its historical charm and community feel, making it attractive for those who appreciate culture and history. | historical buildings, local artisan shops, cultural events, festivals, community gatherings |
Understanding Airbnb License Requirements & STR Laws in Santa Bárbara d'Oeste (2026)
While Santa Bárbara d'Oeste, São Paulo, Brazil currently shows low STR regulations, specific Airbnb license requirements might still exist or change. Always verify the latest short term rental regulations and Airbnb license requirements directly with local government authorities for Santa Bárbara d'Oeste to ensure full compliance before hosting.
(Source: AirROI data, 2026, based on 7% licensed listings)
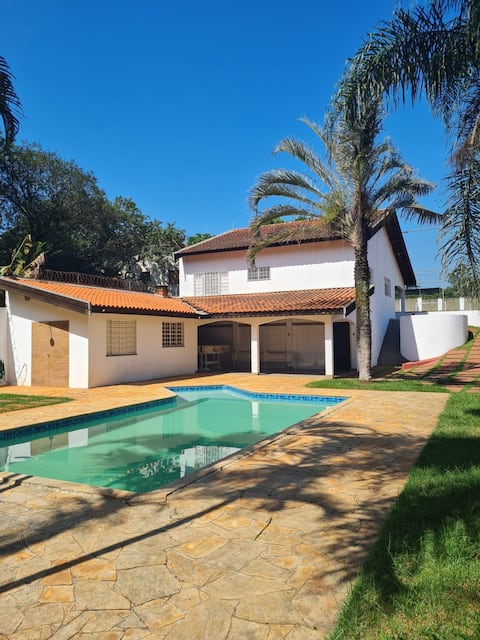
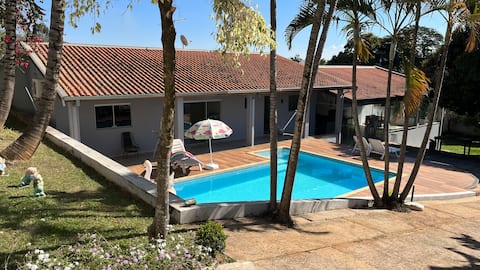
Top Performing Airbnb Properties in Santa Bárbara d'Oeste (2026)
Benchmark your potential! Explore examples of top-performing Airbnb properties in Santa Bárbara d'Oestebased on Trailing Twelve Month (TTM) revenue. Analyze their characteristics, revenue, occupancy rate, and ADR to understand what drives success in this market.

for executives Heated Pool Sauna Barbecue
Entire Place • 2 bedrooms
Chácara Fagus
Entire Place • 2 bedrooms

Peace and fun in Santa Bárbara d'Oeste/SP
Entire Place • 2 bedrooms

2 Bedroom House with Air Conditioning Swimming pool and barbecue 3 parking spaces
Entire Place • 2 bedrooms
Recreio Paraíso Farmhouse
Entire Place • 1 bedroom

Spacious and comfortable house, near Tivoli shopping
Entire Place • 3 bedrooms
Note: Performance varies based on location, size, amenities, seasonality, and management quality. Data reflects the past 12 months.
Top Performing Airbnb Hosts in Santa Bárbara d'Oeste (2026)
Learn from the best! This table showcases top-performing Airbnb hosts in Santa Bárbara d'Oeste based on the number of properties managed and estimated total revenue over the past year. Analyze their scale and performance metrics.
| Host Name | Properties | Grossing Revenue | Stay Reviews | Avg Rating |
|---|---|---|---|---|
| Temporare | 7 | $30,050 | 113 | 4.90/5.0 |
| Rafael | 2 | $26,545 | 48 | 4.97/5.0 |
| Luis Henrique | 1 | $18,932 | 10 | 5.00/5.0 |
| Vanessa | 1 | $15,812 | 27 | 4.85/5.0 |
| Samuel | 1 | $9,990 | 70 | 4.80/5.0 |
| Jose Afonso Luchiari Pisoni Du | 3 | $9,239 | 50 | 4.58/5.0 |
| Marizete Borges | 1 | $8,517 | 18 | 5.00/5.0 |
| Cleo | 1 | $5,170 | 40 | 4.93/5.0 |
| Mariana | 1 | $5,085 | 10 | 4.90/5.0 |
| Bruno | 1 | $3,606 | 31 | 4.77/5.0 |
Analyzing the strategies of top hosts, such as their property selection, pricing, and guest communication, can offer valuable lessons for optimizing your own Airbnb operations in Santa Bárbara d'Oeste.
Dive Deeper: Advanced Santa Bárbara d'Oeste STR Market Data (2026)
Ready to unlock more insights? AirROI provides access to advanced metrics and comprehensive Airbnb data for Santa Bárbara d'Oeste. Explore detailed analytics beyond this report to refine your investment strategy, optimize pricing, and maximize your vacation rental profits.
Explore Advanced MetricsSanta Bárbara d'Oeste Short-Term Rental Market Composition (2026): Property & Room Types
Room Type Distribution
Property Type Distribution
Market Composition Insights for Santa Bárbara d'Oeste
- The Santa Bárbara d'Oeste Airbnb market composition is heavily skewed towards Entire Home/Apt listings, which make up 75.9% of the 29 active rentals. This indicates strong guest preference for privacy and space.
- Looking at the property type distribution in Santa Bárbara d'Oeste, House properties are the most common (75.9%), reflecting the local real estate landscape.
- Houses represent a significant 75.9% portion, catering likely to families or larger groups.
- The presence of 13.8% Hotel/Boutique listings indicates integration with traditional hospitality.
Santa Bárbara d'Oeste Airbnb Room Capacity Analysis (2026): Bedroom Distribution
Distribution of Listings by Number of Bedrooms
Room Capacity Insights for Santa Bárbara d'Oeste
- The dominant room capacity in Santa Bárbara d'Oeste is 2 bedrooms listings, making up 44.8% of the market. This suggests a strong demand for properties suitable for couples or solo travelers.
- Together, 2 bedrooms and 1 bedroom properties represent 72.4% of the active Airbnb listings in Santa Bárbara d'Oeste, indicating a high concentration in these sizes.
- A significant 20.6% of listings offer 3+ bedrooms, catering to larger groups and families seeking more space in Santa Bárbara d'Oeste.
Santa Bárbara d'Oeste Vacation Rental Guest Capacity Trends (2026)
Distribution of Listings by Guest Capacity
Guest Capacity Insights for Santa Bárbara d'Oeste
- The most common guest capacity trend in Santa Bárbara d'Oeste vacation rentals is listings accommodating 8+ guests (34.5%). This suggests the primary traveler segment is likely larger groups.
- Properties designed for 8+ guests and 5 guests dominate the Santa Bárbara d'Oeste STR market, accounting for 48.3% of listings.
- 51.7% of properties accommodate 6+ guests, serving the market segment for larger families or group travel in Santa Bárbara d'Oeste.
- On average, properties in Santa Bárbara d'Oeste are equipped to host 5.2 guests.
Santa Bárbara d'Oeste Airbnb Booking Patterns (2026): Available vs. Booked Days
Available Days Distribution
Booked Days Distribution
Booking Pattern Insights for Santa Bárbara d'Oeste
- The most common availability pattern in Santa Bárbara d'Oeste falls within the 271-366 days range, representing 58.6% of listings. This suggests many properties have significant open periods on their calendars.
- Approximately 89.6% of listings show high availability (181+ days open annually), indicating potential for increased bookings or specific owner usage patterns.
- For booked days, the 31-90 days range is most frequent in Santa Bárbara d'Oeste (31%), reflecting common guest stay durations or potential owner blocking patterns.
- A notable 13.8% of properties secure long booking periods (181+ days booked per year), highlighting successful long-term rental strategies or significant owner usage.
Santa Bárbara d'Oeste Airbnb Minimum Stay Requirements Analysis
Distribution of Listings by Minimum Night Requirement
1 Night
12 listings
41.4% of total
2 Nights
9 listings
31% of total
7-29 Nights
1 listings
3.4% of total
30+ Nights
7 listings
24.1% of total
Key Insights
- The most prevalent minimum stay requirement in Santa Bárbara d'Oeste is 1 Night, adopted by 41.4% of listings. This highlights the market's preference for shorter, flexible bookings.
- A strong majority (72.4%) of the Santa Bárbara d'Oeste Airbnb data shows acceptance of very short stays (1-2 nights), indicating a dynamic, high-turnover market.
- A significant segment (24.1%) caters to monthly stays (30+ nights) in Santa Bárbara d'Oeste, pointing to opportunities in the extended-stay market.
Recommendations
- Align with the market by considering a 1 Night minimum stay, as 41.4% of Santa Bárbara d'Oeste hosts use this setting.
- Explore offering discounts for stays of 30+ nights to attract the 24.1% of the market seeking extended stays.
- Adjust minimum nights based on seasonality – potentially shorter during low season and longer during peak demand periods in Santa Bárbara d'Oeste.
Santa Bárbara d'Oeste Airbnb Cancellation Policy Trends Analysis (2026)
Flexible
7 listings
25% of total
Moderate
3 listings
10.7% of total
Firm
14 listings
50% of total
Strict
4 listings
14.3% of total
Cancellation Policy Insights for Santa Bárbara d'Oeste
- The prevailing Airbnb cancellation policy trend in Santa Bárbara d'Oeste is Firm, used by 50% of listings.
- A majority (64.3%) of hosts in Santa Bárbara d'Oeste utilize Firm or Strict policies, indicating a market where hosts prioritize booking security.
Recommendations for Hosts
- Consider adopting a Firm policy to align with the 50% market standard in Santa Bárbara d'Oeste.
- Using a Strict policy might deter some guests, as only 14.3% of listings use it. Evaluate if potential revenue protection outweighs possible lower booking rates.
- Regularly review your cancellation policy against competitors and market demand shifts in Santa Bárbara d'Oeste.
Santa Bárbara d'Oeste STR Booking Lead Time Analysis (2026)
Average Booking Lead Time by Month
Booking Lead Time Insights for Santa Bárbara d'Oeste
- The overall average booking lead time for vacation rentals in Santa Bárbara d'Oeste is 18 days.
- Guests book furthest in advance for stays during November (average 35 days), likely coinciding with peak travel demand or local events.
- The shortest booking windows occur for stays in May (average 6 days), indicating more last-minute travel plans during this time.
- Seasonally, Winter (25 days avg.) sees the longest lead times, while Spring (9 days avg.) has the shortest, reflecting typical travel planning cycles.
Recommendations for Hosts
- Use the overall average lead time (18 days) as a baseline for your pricing and availability strategy in Santa Bárbara d'Oeste.
- For November stays, consider implementing length-of-stay discounts or slightly higher rates for bookings made less than 35 days out to capitalize on advance planning.
- During May, focus on last-minute booking availability and promotions, as guests book with very short notice (6 days avg.).
- Target marketing efforts for the Winter season well in advance (at least 25 days) to capture early planners.
- Monitor your own booking lead times against these Santa Bárbara d'Oeste averages to identify opportunities for dynamic pricing adjustments.
Popular & Essential Airbnb Amenities in Santa Bárbara d'Oeste (2026)
Amenity Prevalence
Amenity Insights for Santa Bárbara d'Oeste
- Essential amenities in Santa Bárbara d'Oeste that guests expect include: Kitchen, Wifi, Free parking on premises. Lacking these (any) could significantly impact bookings.
- Popular amenities like TV, Dishes and silverware, Refrigerator are common but not universal. Offering these can provide a competitive edge.
Recommendations for Hosts
- Ensure your listing includes all essential amenities for Santa Bárbara d'Oeste: Kitchen, Wifi, Free parking on premises.
- Prioritize adding missing essentials: Kitchen, Wifi, Free parking on premises.
- Consider adding popular differentiators like TV or Dishes and silverware to increase appeal.
- Highlight unique or less common amenities you offer (e.g., hot tub, dedicated workspace, EV charger) in your listing description and photos.
- Regularly check competitor amenities in Santa Bárbara d'Oeste to stay competitive.
Santa Bárbara d'Oeste Airbnb Guest Demographics & Profile Analysis (2026)
Guest Profile Summary for Santa Bárbara d'Oeste
- The typical guest profile for Airbnb in Santa Bárbara d'Oeste consists of primarily domestic travelers (96%), often arriving from nearby São Paulo, typically belonging to the Post-2000s (Gen Z/Alpha) group (50%), primarily speaking Portuguese or English.
- Domestic travelers account for 96.0% of guests.
- Key international markets include Brazil (96%) and United States (2.7%).
- Top languages spoken are Portuguese (51.1%) followed by English (27.7%).
- A significant demographic segment is the Post-2000s (Gen Z/Alpha) group, representing 50% of guests.
Recommendations for Hosts
- Target domestic marketing efforts towards travelers from São Paulo and São Carlos.
- Tailor amenities and listing descriptions to appeal to the dominant Post-2000s (Gen Z/Alpha) demographic (e.g., highlight fast WiFi, smart home features, local guides).
- Highlight unique local experiences or amenities relevant to the primary guest profile.
- Consider seasonal promotions aligned with peak travel times for key origin markets.
Nearby Short-Term Rental Market Comparison
How does the Santa Bárbara d'Oeste Airbnb market stack up against its neighbors? Compare key performance metrics like average monthly revenue, ADR, and occupancy rates in surrounding areas to understand the broader regional STR landscape.
| Market | Active Properties | Monthly Revenue | Daily Rate | Avg. Occupancy |
|---|---|---|---|---|
| Riviera de São Lourenço | 10 | $2,868 | $213.78 | 46% |
| Tuiuti | 18 | $1,686 | $156.45 | 30% |
| Itupeva | 136 | $1,561 | $225.82 | 28% |
| Morungaba | 31 | $1,435 | $263.39 | 27% |
| Campo Limpo Paulista | 49 | $1,428 | $181.02 | 30% |
| Valinhos | 61 | $1,370 | $176.28 | 33% |
| Itatiba | 171 | $1,331 | $177.58 | 29% |
| Vargem | 48 | $1,319 | $190.42 | 28% |
| Elias Fausto | 13 | $1,296 | $143.78 | 30% |
| Porto Feliz | 69 | $1,279 | $260.86 | 27% |