Buritama Airbnb Market Analysis 2025: Short Term Rental Data & Vacation Rental Statistics in São Paulo, Brazil
Is Airbnb profitable in Buritama in 2025? Explore comprehensive Airbnb analytics for Buritama, São Paulo, Brazil to uncover income potential. This 2025 STR market report for Buritama, based on AirROI data from June 2024 to May 2025, reveals key trends in the niche market of 20 active listings.
Whether you're considering an Airbnb investment in Buritama, optimizing your existing vacation rental, or exploring rental arbitrage opportunities, understanding the Buritama Airbnb data is crucial. Leveraging the low regulation environment is key to maximizing your short term rental income potential. Let's dive into the specifics.
Key Buritama Airbnb Performance Metrics Overview
Monthly Airbnb Revenue Variations & Income Potential in Buritama (2025)
Understanding the monthly revenue variations for Airbnb listings in Buritama is key to maximizing your short term rental income potential. Seasonality significantly impacts earnings. Our analysis, based on data from the past 12 months, shows that the peak revenue month for STRs in Buritama is typically August, while June often presents the lowest earnings, highlighting opportunities for strategic pricing adjustments during shoulder and low seasons. Explore the typical Airbnb income in Buritama across different performance tiers:
- Best-in-class properties (Top 10%) achieve $2,295+ monthly, often utilizing dynamic pricing and superior guest experiences.
- Strong performing properties (Top 25%) earn $1,017 or more, indicating effective management and desirable locations/amenities.
- Typical properties (Median) generate around $652 per month, representing the average market performance.
- Entry-level properties (Bottom 25%) see earnings around $273, often with potential for optimization.
Average Monthly Airbnb Earnings Trend in Buritama
Buritama Airbnb Occupancy Rate Trends (2025)
Maximize your bookings by understanding the Buritama STR occupancy trends. Seasonal demand shifts significantly influence how often properties are booked. Typically, Novembersees the highest demand (peak season occupancy), while May experiences the lowest (low season). Effective strategies, like adjusting minimum stays or offering promotions, can boost occupancy during slower periods. Here's how different property tiers perform in Buritama:
- Best-in-class properties (Top 10%) achieve 39%+ occupancy, indicating high desirability and potentially optimized availability.
- Strong performing properties (Top 25%) maintain 27% or higher occupancy, suggesting good market fit and guest satisfaction.
- Typical properties (Median) have an occupancy rate around 16%.
- Entry-level properties (Bottom 25%) average 8% occupancy, potentially facing higher vacancy.
Average Monthly Occupancy Rate Trend in Buritama
Average Daily Rate (ADR) Airbnb Trends in Buritama (2025)
Effective short term rental pricing strategy in Buritama involves understanding monthly ADR fluctuations. The Average Daily Rate (ADR) for Airbnb in Buritama typically peaks in May and dips lowest during September. Leveraging Airbnb dynamic pricing tools or strategies based on this seasonality can significantly boost revenue. Here's a look at the typical nightly rates achieved:
- Best-in-class properties (Top 10%) command rates of $338+ per night, often due to premium features or locations.
- Strong performing properties (Top 25%) achieve nightly rates of $207 or more.
- Typical properties (Median) charge around $97 per night.
- Entry-level properties (Bottom 25%) earn around $72 per night.
Average Daily Rate (ADR) Trend by Month in Buritama
Get Live Buritama Market Intelligence 👇

Explore Real-time Analytics
Airbnb Seasonality Analysis & Trends in Buritama (2025)
Peak Season (August, December, April)
- Revenue averages $1,092 per month
- Occupancy rates average 21.9%
- Daily rates average $146
Shoulder Season
- Revenue averages $908 per month
- Occupancy maintains around 20.7%
- Daily rates hold near $156
Low Season (May, June, September)
- Revenue drops to average $549 per month
- Occupancy decreases to average 13.9%
- Daily rates adjust to average $148
Seasonality Insights for Buritama
- The Airbnb seasonality in Buritama shows highly seasonal trends requiring careful strategy. While the sections above show seasonal averages, it's also insightful to look at the extremes:
- During the high season, the absolute peak month showcases Buritama's highest earning potential, with monthly revenues capable of climbing to $1,103, occupancy reaching a high of 29.3%, and ADRs peaking at $183.
- Conversely, the slowest single month of the year, typically falling within the low season, marks the market's lowest point. In this month, revenue might dip to $470, occupancy could drop to 11.7%, and ADRs may adjust down to $128.
- Understanding both the seasonal averages and these monthly peaks and troughs in revenue, occupancy, and ADR is crucial for maximizing your Airbnb profit potential in Buritama.
Seasonal Strategies for Maximizing Profit
- Peak Season: Maximize revenue through premium pricing and potentially longer minimum stays. Ensure high availability.
- Low Season: Offer competitive pricing, special promotions (e.g., extended stay discounts), and flexible cancellation policies. Target off-season travelers like remote workers or budget-conscious guests.
- Shoulder Seasons: Implement dynamic pricing that balances peak and low rates. Target weekend travelers or specific events. Offer slightly more flexible terms than peak season.
- Regularly analyze your own performance against these Buritama seasonality benchmarks and adjust your pricing and availability strategy accordingly.
Best Areas for Airbnb Investment in Buritama (2025)
Exploring the top neighborhoods for short-term rentals in Buritama? This section highlights key areas, outlining why they are attractive for hosts and guests, along with notable local attractions. Consider these locations based on your target guest profile and investment strategy.
| Neighborhood / Area | Why Host Here? (Target Guests & Appeal) | Key Attractions & Landmarks |
|---|---|---|
| Centro | The bustling heart of Buritama, known for its historic sites and cultural attractions. Ideal for tourists looking to explore local Brazilian culture and cuisine. | Historic City Hall, Museum of Buritama, Local Markets, Church of Our Lady of Sorrows, Cultural Events |
| Jardins | A charming neighborhood with a relaxing atmosphere, known for its parks and gardens. Perfect for families and those seeking a quieter stay in nature. | Parque das Águas, Mini Zoo, Botanical Garden, Picnic Areas, Walking Trails |
| Vila São Paulo | A residential area with a strong community vibe, attracting visitors looking for a more authentic experience of local life in Buritama. | Local Cafés, Community Events, Traditional Food Stalls, Artisan Shops, Friendly Locals |
| Lageado | A scenic area near the river, offering beautiful nature views and outdoor activities. Popular with nature lovers and those seeking tranquility. | Riverfront Parks, Fishing Spots, Hiking Trails, Bird Watching, Cycling Paths |
| Parque São Jorge | Known for its family-friendly facilities and recreational activities, this area is great for guests with children or those looking for fun outdoor options. | Playgrounds, Sports Complex, Walking Trails, Outdoor Markets, Community Festivals |
| Estância | A suburban area that offers a quiet escape from the hustle and bustle of the city, appealing to those looking for relaxation and outdoor time. | Lakes, Nature Reserves, Picnic Areas, Community Gardens, Farmers Market |
| Centro Histórico | Rich in history and architecture, this area attracts history buffs and tourists interested in exploring Buritama's past. | Historical Buildings, Old Town Square, Cultural Festivals, Guided Tours, Heritage Sites |
| Praia do Buritama | Ideal for visitors seeking a spot by the water, this area offers beach-like experiences with plenty of opportunities for fun and relaxation. | Water Sports, Scenic Views, Picnic Areas, Camping Spots, Nature Trails |
Understanding Airbnb License Requirements & STR Laws in Buritama (2025)
While Buritama, São Paulo, Brazil currently shows low STR regulations, specific Airbnb license requirements might still exist or change. Always verify the latest short term rental regulations and Airbnb license requirements directly with local government authorities for Buritama to ensure full compliance before hosting.
(Source: AirROI data, 2025, based on 5% licensed listings)
Top Performing Airbnb Properties in Buritama (2025)
Benchmark your potential! Explore examples of top-performing Airbnb properties in Buritamabased on Trailing Twelve Month (TTM) revenue. Analyze their characteristics, revenue, occupancy rate, and ADR to understand what drives success in this market.
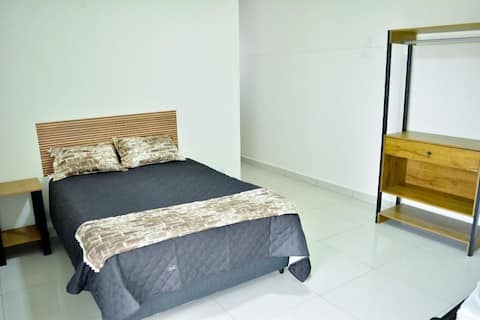
Casa Condomínio Fechado.
Entire Place • 5 bedrooms

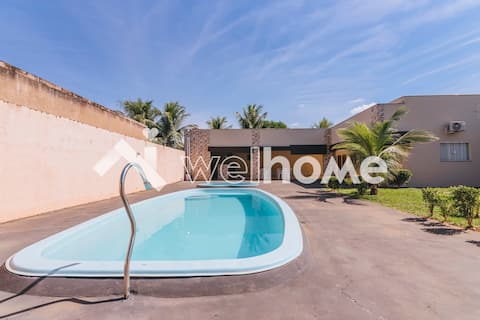
Cottage ranch with pool and wonderful river
Entire Place • 4 bedrooms
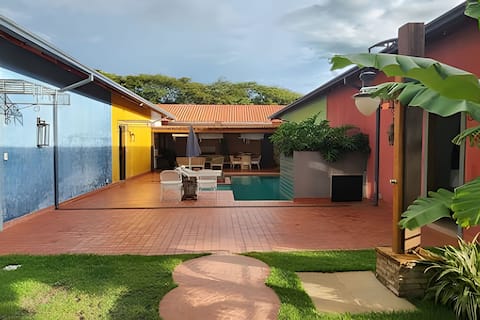
Casa com excelente espaco e piscina em Buritama
Entire Place • 2 bedrooms
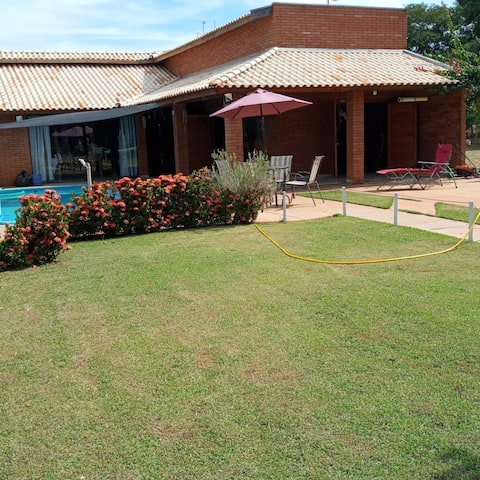
Rancho ideal para confraternizações e dias de descanso!
Entire Place • 1 bedroom

Casa Buritama Arca da Nana
Entire Place • 4 bedrooms
Rancho Fish Maria - Condomínio San Diego
Entire Place • 2 bedrooms
Note: Performance varies based on location, size, amenities, seasonality, and management quality. Data reflects the past 12 months.
Top Performing Airbnb Hosts in Buritama (2025)
Learn from the best! This table showcases top-performing Airbnb hosts in Buritama based on the number of properties managed and estimated total revenue over the past year. Analyze their scale and performance metrics.
| Host Name | Properties | Grossing Revenue | Stay Reviews | Avg Rating |
|---|---|---|---|---|
| Host #281083136 | 1 | $15,632 | 1 | N/A/5.0 |
| Host #383481138 | 2 | $11,971 | 0 | N/A/5.0 |
| Marcelo Kenzi | 1 | $11,556 | 5 | 5.00/5.0 |
| Host #266940657 | 1 | $8,023 | 0 | N/A/5.0 |
| Gabriel Henrique | 1 | $7,795 | 3 | 5.00/5.0 |
| Mirela | 1 | $6,251 | 34 | 4.91/5.0 |
| Karen | 1 | $5,554 | 18 | 4.94/5.0 |
| Flávia | 1 | $4,989 | 3 | 5.00/5.0 |
| Host #430247570 | 1 | $4,109 | 0 | N/A/5.0 |
| Host #543124429 | 1 | $3,091 | 0 | N/A/5.0 |
Analyzing the strategies of top hosts, such as their property selection, pricing, and guest communication, can offer valuable lessons for optimizing your own Airbnb operations in Buritama.
Dive Deeper: Advanced Buritama STR Market Data (2025)
Ready to unlock more insights? AirROI provides access to advanced metrics and comprehensive Airbnb data for Buritama. Explore detailed analytics beyond this report to refine your investment strategy, optimize pricing, and maximize your vacation rental profits.
Explore Advanced MetricsBuritama Short-Term Rental Market Composition (2025): Property & Room Types
Room Type Distribution
Property Type Distribution
Market Composition Insights for Buritama
- The Buritama Airbnb market composition is heavily skewed towards Entire Home/Apt listings, which make up 100% of the 20 active rentals. This indicates strong guest preference for privacy and space.
- Looking at the property type distribution in Buritama, House properties are the most common (75%), reflecting the local real estate landscape.
- Houses represent a significant 75% portion, catering likely to families or larger groups.
- The presence of 10% Hotel/Boutique listings indicates integration with traditional hospitality.
Buritama Airbnb Room Capacity Analysis (2025): Bedroom Distribution
Distribution of Listings by Number of Bedrooms
Room Capacity Insights for Buritama
- The dominant room capacity in Buritama is 3 bedrooms listings, making up 35% of the market. This suggests a strong demand for properties suitable for families or small groups.
- Together, 3 bedrooms and 2 bedrooms properties represent 65.0% of the active Airbnb listings in Buritama, indicating a high concentration in these sizes.
- A significant 65.0% of listings offer 3+ bedrooms, catering to larger groups and families seeking more space in Buritama.
Buritama Vacation Rental Guest Capacity Trends (2025)
Distribution of Listings by Guest Capacity
Guest Capacity Insights for Buritama
- The most common guest capacity trend in Buritama vacation rentals is listings accommodating 8+ guests (90%). This suggests the primary traveler segment is likely larger groups.
- Properties designed for 8+ guests and 5 guests dominate the Buritama STR market, accounting for 95.0% of listings.
- 95.0% of properties accommodate 6+ guests, serving the market segment for larger families or group travel in Buritama.
- On average, properties in Buritama are equipped to host 7.8 guests.
Buritama Airbnb Booking Patterns (2025): Available vs. Booked Days
Available Days Distribution
Booked Days Distribution
Booking Pattern Insights for Buritama
- The most common availability pattern in Buritama falls within the 271-366 days range, representing 100% of listings. This suggests many properties have significant open periods on their calendars.
- Approximately 100.0% of listings show high availability (181+ days open annually), indicating potential for increased bookings or specific owner usage patterns.
- For booked days, the 1-30 days range is most frequent in Buritama (70%), reflecting common guest stay durations or potential owner blocking patterns.
Buritama Airbnb Minimum Stay Requirements Analysis
Distribution of Listings by Minimum Night Requirement
1 Night
6 listings
37.5% of total
2 Nights
5 listings
31.3% of total
3 Nights
1 listings
6.3% of total
4-6 Nights
2 listings
12.5% of total
30+ Nights
2 listings
12.5% of total
Key Insights
- The most prevalent minimum stay requirement in Buritama is 1 Night, adopted by 37.5% of listings. This highlights the market's preference for shorter, flexible bookings.
- A strong majority (68.8%) of the Buritama Airbnb data shows acceptance of very short stays (1-2 nights), indicating a dynamic, high-turnover market.
- A significant segment (12.5%) caters to monthly stays (30+ nights) in Buritama, pointing to opportunities in the extended-stay market.
Recommendations
- Align with the market by considering a 1 Night minimum stay, as 37.5% of Buritama hosts use this setting.
- Explore offering discounts for stays of 30+ nights to attract the 12.5% of the market seeking extended stays.
- Adjust minimum nights based on seasonality – potentially shorter during low season and longer during peak demand periods in Buritama.
Buritama Airbnb Cancellation Policy Trends Analysis (2025)
Flexible
3 listings
30% of total
Moderate
3 listings
30% of total
Firm
1 listings
10% of total
Strict
3 listings
30% of total
Cancellation Policy Insights for Buritama
- The prevailing Airbnb cancellation policy trend in Buritama is Flexible, used by 30% of listings.
- There's a relatively balanced mix between guest-friendly (60.0%) and stricter (40.0%) policies, offering choices for different guest needs.
Recommendations for Hosts
- Consider adopting a Flexible policy to align with the 30% market standard in Buritama.
- Regularly review your cancellation policy against competitors and market demand shifts in Buritama.
Buritama STR Booking Lead Time Analysis (2025)
Average Booking Lead Time by Month
Booking Lead Time Insights for Buritama
- The overall average booking lead time for vacation rentals in Buritama is 36 days.
- Guests book furthest in advance for stays during December (average 79 days), likely coinciding with peak travel demand or local events.
- The shortest booking windows occur for stays in July (average 2 days), indicating more last-minute travel plans during this time.
- Seasonally, Winter (62 days avg.) sees the longest lead times, while Summer (6 days avg.) has the shortest, reflecting typical travel planning cycles.
Recommendations for Hosts
- Use the overall average lead time (36 days) as a baseline for your pricing and availability strategy in Buritama.
- For December stays, consider implementing length-of-stay discounts or slightly higher rates for bookings made less than 79 days out to capitalize on advance planning.
- During July, focus on last-minute booking availability and promotions, as guests book with very short notice (2 days avg.).
- Target marketing efforts for the Winter season well in advance (at least 62 days) to capture early planners.
- Monitor your own booking lead times against these Buritama averages to identify opportunities for dynamic pricing adjustments.
Popular & Essential Airbnb Amenities in Buritama (2025)
Amenity Prevalence
Amenity Insights for Buritama
- Essential amenities in Buritama that guests expect include: Kitchen, TV, Free parking on premises, Wifi. Lacking these (any) could significantly impact bookings.
- Popular amenities like Hot water, Air conditioning, Pool are common but not universal. Offering these can provide a competitive edge.
- A pool is a highly desired but not standard amenity, making it a key feature for attracting guests seeking leisure in Buritama.
Recommendations for Hosts
- Ensure your listing includes all essential amenities for Buritama: Kitchen, TV, Free parking on premises, Wifi.
- Prioritize adding missing essentials: Free parking on premises, Wifi.
- Consider adding popular differentiators like Hot water or Air conditioning to increase appeal.
- Highlight unique or less common amenities you offer (e.g., hot tub, dedicated workspace, EV charger) in your listing description and photos.
- Regularly check competitor amenities in Buritama to stay competitive.
Buritama Airbnb Guest Demographics & Profile Analysis (2025)
Guest Profile Summary for Buritama
- The typical guest profile for Airbnb in Buritama consists of primarily domestic travelers (100%), often arriving from nearby São José do Rio Preto, typically belonging to the Post-2000s (Gen Z/Alpha) group (50%), primarily speaking Portuguese or English.
- Domestic travelers account for 100.0% of guests.
- Top languages spoken are Portuguese (50%) followed by English (35.7%).
- A significant demographic segment is the Post-2000s (Gen Z/Alpha) group, representing 50% of guests.
Recommendations for Hosts
- Target domestic marketing efforts towards travelers from São José do Rio Preto and Lins.
- Tailor amenities and listing descriptions to appeal to the dominant Post-2000s (Gen Z/Alpha) demographic (e.g., highlight fast WiFi, smart home features, local guides).
- Highlight unique local experiences or amenities relevant to the primary guest profile.
- Consider seasonal promotions aligned with peak travel times for key origin markets.
Nearby Short-Term Rental Market Comparison
How does the Buritama Airbnb market stack up against its neighbors? Compare key performance metrics like average monthly revenue, ADR, and occupancy rates in surrounding areas to understand the broader regional STR landscape.
| Market | Active Properties | Monthly Revenue | Daily Rate | Avg. Occupancy |
|---|---|---|---|---|
| Águas de Santa Bárbara | 112 | $674 | $123.73 | 28% |
| Santa Fé do Sul | 13 | $508 | $94.15 | 34% |
| Fronteira | 10 | $490 | $103.02 | 30% |
| Rubinéia | 10 | $460 | $120.94 | 21% |
| Araçatuba | 123 | $448 | $61.49 | 39% |
| Álvares Machado | 13 | $420 | $104.12 | 25% |
| Penápolis | 17 | $379 | $74.58 | 28% |
| Marília | 105 | $378 | $39.70 | 38% |
| São José do Rio Preto | 450 | $366 | $43.19 | 41% |
| Santa Clara d'Oeste | 12 | $317 | $78.25 | 34% |