Boa Vista Airbnb Market Analysis 2026: Short Term Rental Data & Vacation Rental Statistics in Roraima, Brazil
Is Airbnb profitable in Boa Vista in 2026? Explore comprehensive Airbnb analytics for Boa Vista, Roraima, Brazil to uncover income potential. This 2026 STR market report for Boa Vista, based on AirROI data from February 2025 to January 2026, reveals key trends in the market of 311 active listings.
Whether you're considering an Airbnb investment in Boa Vista, optimizing your existing vacation rental, or exploring rental arbitrage opportunities, understanding the Boa Vista Airbnb data is crucial. Leveraging the low regulation environment is key to maximizing your short term rental income potential. Let's dive into the specifics.
Key Boa Vista Airbnb Performance Metrics Overview
Monthly Airbnb Revenue Variations & Income Potential in Boa Vista (2026)
Understanding the monthly revenue variations for Airbnb listings in Boa Vista is key to maximizing your short term rental income potential. Seasonality significantly impacts earnings. Our analysis, based on data from the past 12 months, shows that the peak revenue month for STRs in Boa Vista is typically December, while May often presents the lowest earnings, highlighting opportunities for strategic pricing adjustments during shoulder and low seasons. Explore the typical Airbnb income in Boa Vista across different performance tiers:
- Best-in-class properties (Top 10%) achieve $730+ monthly, often utilizing dynamic pricing and superior guest experiences.
- Strong performing properties (Top 25%) earn $468 or more, indicating effective management and desirable locations/amenities.
- Typical properties (Median) generate around $260 per month, representing the average market performance.
- Entry-level properties (Bottom 25%) see earnings around $121, often with potential for optimization.
Average Monthly Airbnb Earnings Trend in Boa Vista
Boa Vista Airbnb Occupancy Rate Trends (2026)
Maximize your bookings by understanding the Boa Vista STR occupancy trends. Seasonal demand shifts significantly influence how often properties are booked. Typically, Decembersees the highest demand (peak season occupancy), while May experiences the lowest (low season). Effective strategies, like adjusting minimum stays or offering promotions, can boost occupancy during slower periods. Here's how different property tiers perform in Boa Vista:
- Best-in-class properties (Top 10%) achieve 71%+ occupancy, indicating high desirability and potentially optimized availability.
- Strong performing properties (Top 25%) maintain 53% or higher occupancy, suggesting good market fit and guest satisfaction.
- Typical properties (Median) have an occupancy rate around 29%.
- Entry-level properties (Bottom 25%) average 14% occupancy, potentially facing higher vacancy.
Average Monthly Occupancy Rate Trend in Boa Vista
Average Daily Rate (ADR) Airbnb Trends in Boa Vista (2026)
Effective short term rental pricing strategy in Boa Vista involves understanding monthly ADR fluctuations. The Average Daily Rate (ADR) for Airbnb in Boa Vista typically peaks in January and dips lowest during February. Leveraging Airbnb dynamic pricing tools or strategies based on this seasonality can significantly boost revenue. Here's a look at the typical nightly rates achieved:
- Best-in-class properties (Top 10%) command rates of $61+ per night, often due to premium features or locations.
- Strong performing properties (Top 25%) achieve nightly rates of $38 or more.
- Typical properties (Median) charge around $28 per night.
- Entry-level properties (Bottom 25%) earn around $22 per night.
Average Daily Rate (ADR) Trend by Month in Boa Vista
Get Live Boa Vista Market Intelligence 👇

Explore Real-time Analytics
Airbnb Seasonality Analysis & Trends in Boa Vista (2026)
Peak Season (December, October, August)
- Revenue averages $411 per month
- Occupancy rates average 37.5%
- Daily rates average $37
Shoulder Season
- Revenue averages $351 per month
- Occupancy maintains around 35.3%
- Daily rates hold near $36
Low Season (April, May, June)
- Revenue drops to average $306 per month
- Occupancy decreases to average 31.7%
- Daily rates adjust to average $34
Seasonality Insights for Boa Vista
- The Airbnb seasonality in Boa Vista shows moderate seasonality with distinct peak and low periods. While the sections above show seasonal averages, it's also insightful to look at the extremes:
- During the high season, the absolute peak month showcases Boa Vista's highest earning potential, with monthly revenues capable of climbing to $430, occupancy reaching a high of 38.2%, and ADRs peaking at $39.
- Conversely, the slowest single month of the year, typically falling within the low season, marks the market's lowest point. In this month, revenue might dip to $281, occupancy could drop to 28.1%, and ADRs may adjust down to $33.
- Understanding both the seasonal averages and these monthly peaks and troughs in revenue, occupancy, and ADR is crucial for maximizing your Airbnb profit potential in Boa Vista.
Seasonal Strategies for Maximizing Profit
- Peak Season: Maximize revenue through premium pricing and potentially longer minimum stays. Ensure high availability.
- Low Season: Offer competitive pricing, special promotions (e.g., extended stay discounts), and flexible cancellation policies. Target off-season travelers like remote workers or budget-conscious guests.
- Shoulder Seasons: Implement dynamic pricing that balances peak and low rates. Target weekend travelers or specific events. Offer slightly more flexible terms than peak season.
- Regularly analyze your own performance against these Boa Vista seasonality benchmarks and adjust your pricing and availability strategy accordingly.
Best Areas for Airbnb Investment in Boa Vista (2026)
Exploring the top neighborhoods for short-term rentals in Boa Vista? This section highlights key areas, outlining why they are attractive for hosts and guests, along with notable local attractions. Consider these locations based on your target guest profile and investment strategy.
| Neighborhood / Area | Why Host Here? (Target Guests & Appeal) | Key Attractions & Landmarks |
|---|---|---|
| Centro | The heart of Boa Vista, ideal for those who want to be close to shops, restaurants, and cultural attractions. This area is bustling with activity and is a great choice for both tourists and business travelers. | Praça do Centro Cívico, Teatro Estadual de Roraima, Museu Integrado de Roraima, Shopping de Roraima, Catedral Cristo Redentor |
| Caçari | A popular area known for its natural beauty and proximity to local attractions. It's a great area for those looking to experience the nature and wildlife of Roraima. | Parque Nacional Monte Roraima, Lago Caracaraí, Parque Anauá, Café do Lago, Cachoeira do Mucajaí |
| Jardim Floresta | A well-planned residential neighborhood with parks and green spaces. This area attracts families and is ideal for longer stays, offering a more relaxed atmosphere. | Parque do Rio Branco, Praça da Juventude, Cultural Center, Feira do Produtor |
| São Pedro | This is an up-and-coming neighborhood that is becoming increasingly popular with young people and tourists. It has a variety of dining and entertainment options. | Mercado Municipal de Boa Vista, Cine Boa Vista, Academia de Música, Vila Viana |
| Expansão do São Pedro | A rapidly developing area with modern amenities and close access to major highways. Perfect for business stays or families looking for spacious accommodations. | Supermercados, Escolas, Parques |
| Buritis | Known for its quiet ambiance and residential charm, making it great for visitors wanting a peaceful retreat while still being near the city. | Praça do Buritis, Feira da Rua do Comércio, Cafés e Confeitarias locais |
| Parque das Flores | A green residential area with family-oriented facilities and close to schools and parks, ideal for longer family stays. | Parque das Flores, Lojas de conveniência, Quilombola community |
| Roraima Shopping | A commercial hub of Boa Vista, perfect for short visits as it has numerous shopping options, eateries, and entertainment for tourists. | Roraima Shopping Center, Restaurantes e Cafés, Cinema, Parque de Lazer |
Understanding Airbnb License Requirements & STR Laws in Boa Vista (2026)
While Boa Vista, Roraima, Brazil currently shows low STR regulations, specific Airbnb license requirements might still exist or change. Always verify the latest short term rental regulations and Airbnb license requirements directly with local government authorities for Boa Vista to ensure full compliance before hosting.
(Source: AirROI data, 2026, finding no licensed listings among those analyzed)
Top Performing Airbnb Properties in Boa Vista (2026)
Benchmark your potential! Explore examples of top-performing Airbnb properties in Boa Vistabased on Trailing Twelve Month (TTM) revenue. Analyze their characteristics, revenue, occupancy rate, and ADR to understand what drives success in this market.
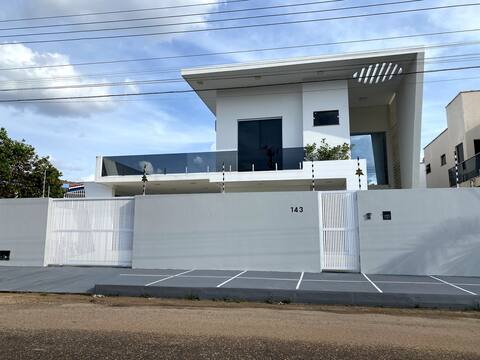
New house with excellent location
Entire Place • 3 bedrooms
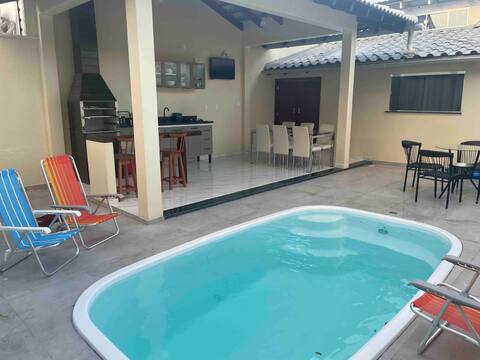
3-bedroom villa with pool
Entire Place • 3 bedrooms
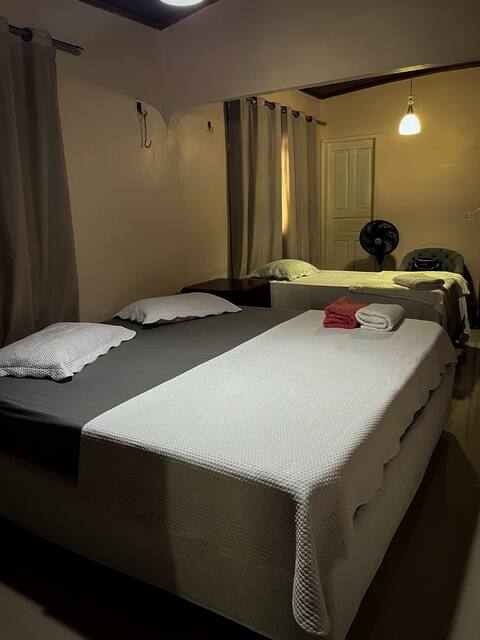
Celedone Residential
Entire Place • 3 bedrooms

House 4 bedrooms 3 bathrooms
Entire Place • 4 bedrooms

New house 3 bedrooms and barbecue grill
Entire Place • 3 bedrooms

House in Boa Vista with swimming pool, air-conditioning
Entire Place • 5 bedrooms
Note: Performance varies based on location, size, amenities, seasonality, and management quality. Data reflects the past 12 months.
Top Performing Airbnb Hosts in Boa Vista (2026)
Learn from the best! This table showcases top-performing Airbnb hosts in Boa Vista based on the number of properties managed and estimated total revenue over the past year. Analyze their scale and performance metrics.
| Host Name | Properties | Grossing Revenue | Stay Reviews | Avg Rating |
|---|---|---|---|---|
| Glaucia Domenico | 10 | $71,194 | 199 | 4.95/5.0 |
| Angela | 2 | $27,676 | 23 | 4.86/5.0 |
| Elton Bruno | 7 | $26,063 | 90 | 4.94/5.0 |
| Josa | 2 | $22,078 | 75 | 4.93/5.0 |
| Paulo | 8 | $20,099 | 172 | 4.86/5.0 |
| Célia Amorim | 7 | $17,225 | 217 | 4.94/5.0 |
| Tallitta | 7 | $17,217 | 169 | 4.94/5.0 |
| Prime Hospedagens Ltda | 2 | $16,973 | 9 | 4.92/5.0 |
| Marcos | 2 | $16,786 | 102 | 4.94/5.0 |
| Lucas | 12 | $16,359 | 130 | 4.87/5.0 |
Analyzing the strategies of top hosts, such as their property selection, pricing, and guest communication, can offer valuable lessons for optimizing your own Airbnb operations in Boa Vista.
Dive Deeper: Advanced Boa Vista STR Market Data (2026)
Ready to unlock more insights? AirROI provides access to advanced metrics and comprehensive Airbnb data for Boa Vista. Explore detailed analytics beyond this report to refine your investment strategy, optimize pricing, and maximize your vacation rental profits.
Explore Advanced MetricsBoa Vista Short-Term Rental Market Composition (2026): Property & Room Types
Room Type Distribution
Property Type Distribution
Market Composition Insights for Boa Vista
- The Boa Vista Airbnb market composition is heavily skewed towards Entire Home/Apt listings, which make up 75.6% of the 311 active rentals. This indicates strong guest preference for privacy and space.
- Looking at the property type distribution in Boa Vista, Apartment/Condo properties are the most common (56.6%), reflecting the local real estate landscape.
- Houses represent a significant 31.5% portion, catering likely to families or larger groups.
- The presence of 6.1% Hotel/Boutique listings indicates integration with traditional hospitality.
- Smaller segments like others, unique stays (combined 5.8%) offer potential for unique stay experiences.
Boa Vista Airbnb Room Capacity Analysis (2026): Bedroom Distribution
Distribution of Listings by Number of Bedrooms
Room Capacity Insights for Boa Vista
- The dominant room capacity in Boa Vista is 1 bedroom listings, making up 45.7% of the market. This suggests a strong demand for properties suitable for couples or solo travelers.
- Together, 1 bedroom and 2 bedrooms properties represent 71.4% of the active Airbnb listings in Boa Vista, indicating a high concentration in these sizes.
- Listings with 3+ bedrooms (8.4%) represent a smaller niche, potentially indicating an underserved market for larger group accommodations in Boa Vista.
Boa Vista Vacation Rental Guest Capacity Trends (2026)
Distribution of Listings by Guest Capacity
Guest Capacity Insights for Boa Vista
- The most common guest capacity trend in Boa Vista vacation rentals is listings accommodating 2 guests (22.5%). This suggests the primary traveler segment is likely couples or solo travelers.
- Properties designed for 2 guests and 4 guests dominate the Boa Vista STR market, accounting for 40.2% of listings.
- 14.2% of properties accommodate 6+ guests, serving the market segment for larger families or group travel in Boa Vista.
- On average, properties in Boa Vista are equipped to host 3.1 guests.
Boa Vista Airbnb Booking Patterns (2026): Available vs. Booked Days
Available Days Distribution
Booked Days Distribution
Booking Pattern Insights for Boa Vista
- The most common availability pattern in Boa Vista falls within the 271-366 days range, representing 67.8% of listings. This suggests many properties have significant open periods on their calendars.
- Approximately 92.2% of listings show high availability (181+ days open annually), indicating potential for increased bookings or specific owner usage patterns.
- For booked days, the 31-90 days range is most frequent in Boa Vista (37.6%), reflecting common guest stay durations or potential owner blocking patterns.
- A notable 8.0% of properties secure long booking periods (181+ days booked per year), highlighting successful long-term rental strategies or significant owner usage.
Boa Vista Airbnb Minimum Stay Requirements Analysis
Distribution of Listings by Minimum Night Requirement
1 Night
99 listings
31.8% of total
2 Nights
93 listings
29.9% of total
3 Nights
42 listings
13.5% of total
4-6 Nights
2 listings
0.6% of total
7-29 Nights
7 listings
2.3% of total
30+ Nights
68 listings
21.9% of total
Key Insights
- The most prevalent minimum stay requirement in Boa Vista is 1 Night, adopted by 31.8% of listings. This highlights the market's preference for shorter, flexible bookings.
- A strong majority (61.7%) of the Boa Vista Airbnb data shows acceptance of very short stays (1-2 nights), indicating a dynamic, high-turnover market.
- A significant segment (21.9%) caters to monthly stays (30+ nights) in Boa Vista, pointing to opportunities in the extended-stay market.
Recommendations
- Align with the market by considering a 1 Night minimum stay, as 31.8% of Boa Vista hosts use this setting.
- Explore offering discounts for stays of 30+ nights to attract the 21.9% of the market seeking extended stays.
- Adjust minimum nights based on seasonality – potentially shorter during low season and longer during peak demand periods in Boa Vista.
Boa Vista Airbnb Cancellation Policy Trends Analysis (2026)
Super Strict 30 Days
2 listings
0.6% of total
Limited
5 listings
1.6% of total
Flexible
144 listings
46.5% of total
Moderate
87 listings
28.1% of total
Firm
64 listings
20.6% of total
Strict
8 listings
2.6% of total
Cancellation Policy Insights for Boa Vista
- The prevailing Airbnb cancellation policy trend in Boa Vista is Flexible, used by 46.5% of listings.
- The market strongly favors guest-friendly terms, with 74.6% of listings offering Flexible or Moderate policies. This suggests guests in Boa Vista may expect booking flexibility.
- Strict cancellation policies are quite rare (2.6%), potentially making listings with this policy less competitive unless justified by high demand or property type.
Recommendations for Hosts
- Consider adopting a Flexible policy to align with the 46.5% market standard in Boa Vista.
- Using a Strict policy might deter some guests, as only 2.6% of listings use it. Evaluate if potential revenue protection outweighs possible lower booking rates.
- Regularly review your cancellation policy against competitors and market demand shifts in Boa Vista.
Boa Vista STR Booking Lead Time Analysis (2026)
Average Booking Lead Time by Month
Booking Lead Time Insights for Boa Vista
- The overall average booking lead time for vacation rentals in Boa Vista is 14 days.
- Guests book furthest in advance for stays during December (average 19 days), likely coinciding with peak travel demand or local events.
- The shortest booking windows occur for stays in June (average 11 days), indicating more last-minute travel plans during this time.
- Seasonally, Winter (15 days avg.) sees the longest lead times, while Summer (12 days avg.) has the shortest, reflecting typical travel planning cycles.
Recommendations for Hosts
- Use the overall average lead time (14 days) as a baseline for your pricing and availability strategy in Boa Vista.
- Target marketing efforts for the Winter season well in advance (at least 15 days) to capture early planners.
- Monitor your own booking lead times against these Boa Vista averages to identify opportunities for dynamic pricing adjustments.
Popular & Essential Airbnb Amenities in Boa Vista (2026)
Amenity Prevalence
Amenity Insights for Boa Vista
- Essential amenities in Boa Vista that guests expect include: Air conditioning, Wifi, TV. Lacking these (any) could significantly impact bookings.
- Popular amenities like Kitchen, Free parking on premises, Dishes and silverware are common but not universal. Offering these can provide a competitive edge.
Recommendations for Hosts
- Ensure your listing includes all essential amenities for Boa Vista: Air conditioning, Wifi, TV.
- Prioritize adding missing essentials: Air conditioning, Wifi, TV.
- Consider adding popular differentiators like Kitchen or Free parking on premises to increase appeal.
- Highlight unique or less common amenities you offer (e.g., hot tub, dedicated workspace, EV charger) in your listing description and photos.
- Regularly check competitor amenities in Boa Vista to stay competitive.
Boa Vista Airbnb Guest Demographics & Profile Analysis (2026)
Guest Profile Summary for Boa Vista
- The typical guest profile for Airbnb in Boa Vista consists of primarily domestic travelers (90%), often arriving from nearby Manaus, typically belonging to the Post-2000s (Gen Z/Alpha) group (50%), primarily speaking Portuguese or English.
- Domestic travelers account for 89.8% of guests.
- Key international markets include Brazil (89.8%) and United States (2%).
- Top languages spoken are Portuguese (46.1%) followed by English (27.7%).
- A significant demographic segment is the Post-2000s (Gen Z/Alpha) group, representing 50% of guests.
Recommendations for Hosts
- Target domestic marketing efforts towards travelers from Manaus and São Paulo.
- Tailor amenities and listing descriptions to appeal to the dominant Post-2000s (Gen Z/Alpha) demographic (e.g., highlight fast WiFi, smart home features, local guides).
- Highlight unique local experiences or amenities relevant to the primary guest profile.
- Consider seasonal promotions aligned with peak travel times for key origin markets.