São Gabriel Airbnb Market Analysis 2026: Short Term Rental Data & Vacation Rental Statistics in Rio Grande do Sul, Brazil
Is Airbnb profitable in São Gabriel in 2026? Explore comprehensive Airbnb analytics for São Gabriel, Rio Grande do Sul, Brazil to uncover income potential. This 2026 STR market report for São Gabriel, based on AirROI data from February 2025 to January 2026, reveals key trends in the niche market of 61 active listings.
Whether you're considering an Airbnb investment in São Gabriel, optimizing your existing vacation rental, or exploring rental arbitrage opportunities, understanding the São Gabriel Airbnb data is crucial. Leveraging the low regulation environment is key to maximizing your short term rental income potential. Let's dive into the specifics.
Key São Gabriel Airbnb Performance Metrics Overview
Monthly Airbnb Revenue Variations & Income Potential in São Gabriel (2026)
Understanding the monthly revenue variations for Airbnb listings in São Gabriel is key to maximizing your short term rental income potential. Seasonality significantly impacts earnings. Our analysis, based on data from the past 12 months, shows that the peak revenue month for STRs in São Gabriel is typically February, while October often presents the lowest earnings, highlighting opportunities for strategic pricing adjustments during shoulder and low seasons. Explore the typical Airbnb income in São Gabriel across different performance tiers:
- Best-in-class properties (Top 10%) achieve $1,134+ monthly, often utilizing dynamic pricing and superior guest experiences.
- Strong performing properties (Top 25%) earn $575 or more, indicating effective management and desirable locations/amenities.
- Typical properties (Median) generate around $212 per month, representing the average market performance.
- Entry-level properties (Bottom 25%) see earnings around $97, often with potential for optimization.
Average Monthly Airbnb Earnings Trend in São Gabriel
São Gabriel Airbnb Occupancy Rate Trends (2026)
Maximize your bookings by understanding the São Gabriel STR occupancy trends. Seasonal demand shifts significantly influence how often properties are booked. Typically, Februarysees the highest demand (peak season occupancy), while June experiences the lowest (low season). Effective strategies, like adjusting minimum stays or offering promotions, can boost occupancy during slower periods. Here's how different property tiers perform in São Gabriel:
- Best-in-class properties (Top 10%) achieve 58%+ occupancy, indicating high desirability and potentially optimized availability.
- Strong performing properties (Top 25%) maintain 35% or higher occupancy, suggesting good market fit and guest satisfaction.
- Typical properties (Median) have an occupancy rate around 16%.
- Entry-level properties (Bottom 25%) average 8% occupancy, potentially facing higher vacancy.
Average Monthly Occupancy Rate Trend in São Gabriel
Average Daily Rate (ADR) Airbnb Trends in São Gabriel (2026)
Effective short term rental pricing strategy in São Gabriel involves understanding monthly ADR fluctuations. The Average Daily Rate (ADR) for Airbnb in São Gabriel typically peaks in January and dips lowest during June. Leveraging Airbnb dynamic pricing tools or strategies based on this seasonality can significantly boost revenue. Here's a look at the typical nightly rates achieved:
- Best-in-class properties (Top 10%) command rates of $96+ per night, often due to premium features or locations.
- Strong performing properties (Top 25%) achieve nightly rates of $72 or more.
- Typical properties (Median) charge around $48 per night.
- Entry-level properties (Bottom 25%) earn around $25 per night.
Average Daily Rate (ADR) Trend by Month in São Gabriel
Get Live São Gabriel Market Intelligence 👇

Explore Real-time Analytics
Airbnb Seasonality Analysis & Trends in São Gabriel (2026)
Peak Season (February, December, August)
- Revenue averages $566 per month
- Occupancy rates average 28.5%
- Daily rates average $54
Shoulder Season
- Revenue averages $404 per month
- Occupancy maintains around 24.3%
- Daily rates hold near $54
Low Season (June, July, October)
- Revenue drops to average $271 per month
- Occupancy decreases to average 21.7%
- Daily rates adjust to average $52
Seasonality Insights for São Gabriel
- The Airbnb seasonality in São Gabriel shows highly seasonal trends requiring careful strategy. While the sections above show seasonal averages, it's also insightful to look at the extremes:
- During the high season, the absolute peak month showcases São Gabriel's highest earning potential, with monthly revenues capable of climbing to $669, occupancy reaching a high of 39.5%, and ADRs peaking at $64.
- Conversely, the slowest single month of the year, typically falling within the low season, marks the market's lowest point. In this month, revenue might dip to $245, occupancy could drop to 20.8%, and ADRs may adjust down to $50.
- Understanding both the seasonal averages and these monthly peaks and troughs in revenue, occupancy, and ADR is crucial for maximizing your Airbnb profit potential in São Gabriel.
Seasonal Strategies for Maximizing Profit
- Peak Season: Maximize revenue through premium pricing and potentially longer minimum stays. Ensure high availability.
- Low Season: Offer competitive pricing, special promotions (e.g., extended stay discounts), and flexible cancellation policies. Target off-season travelers like remote workers or budget-conscious guests.
- Shoulder Seasons: Implement dynamic pricing that balances peak and low rates. Target weekend travelers or specific events. Offer slightly more flexible terms than peak season.
- Regularly analyze your own performance against these São Gabriel seasonality benchmarks and adjust your pricing and availability strategy accordingly.
Best Areas for Airbnb Investment in São Gabriel (2026)
Exploring the top neighborhoods for short-term rentals in São Gabriel? This section highlights key areas, outlining why they are attractive for hosts and guests, along with notable local attractions. Consider these locations based on your target guest profile and investment strategy.
| Neighborhood / Area | Why Host Here? (Target Guests & Appeal) | Key Attractions & Landmarks |
|---|---|---|
| Centro | The central area of São Gabriel is vibrant and bustling, making it ideal for tourists looking to explore local culture, restaurants, and shops. | São Gabriel Cathedral, Municipal Market, Historical Museum of São Gabriel, City Square, Cultural Center |
| Praça do Bairro | A popular neighborhood for its friendly atmosphere and accessibility to parks and local events. Great for families and travelers looking to immerse in the local life. | Praça do Bairro, Local Festivals, Playgrounds, Community Events |
| Rio Pardo | Known for its beautiful river views and outdoor activities, this area attracts nature lovers and those looking for relaxation and recreation. | Rio Pardo, Fishing Spots, Nature Trails, Camping Areas |
| Bairro São José | A residential neighborhood with a mix of local shops and cafes, appealing to those who want a quieter, more authentic experience. | Local Cafes, Boutique Shops, Community Parks |
| Bairro Nova Brasília | A developing area close to shopping centers and amenities, making it attractive for budget-conscious travelers. | Shopping Centers, Local Dining, Convenience Stores |
| Bairro Vila Nova | This area offers a mix of homes and parks, popular among those wanting a suburban feel while still being close to the city. | Community Parks, Vila Nova Market, Local Sports Events |
| Bairro Três Marcos | Known for its lush greenery and tranquility, perfect for those who enjoy outdoor activities and a peaceful environment. | Trails for Hiking, Picnic Areas, Community Sports Fields |
| Novo Centro | An up-and-coming area with modern developments, attracting young professionals and businesses, provides a lively urban experience. | New Cafes, Local Art Galleries, Workspaces |
Understanding Airbnb License Requirements & STR Laws in São Gabriel (2026)
While São Gabriel, Rio Grande do Sul, Brazil currently shows low STR regulations, specific Airbnb license requirements might still exist or change. Always verify the latest short term rental regulations and Airbnb license requirements directly with local government authorities for São Gabriel to ensure full compliance before hosting.
(Source: AirROI data, 2026, finding no licensed listings among those analyzed)
Top Performing Airbnb Properties in São Gabriel (2026)
Benchmark your potential! Explore examples of top-performing Airbnb properties in São Gabrielbased on Trailing Twelve Month (TTM) revenue. Analyze their characteristics, revenue, occupancy rate, and ADR to understand what drives success in this market.

Righi House | Complete house with 4 bedrooms and swimming pool
Entire Place • 4 bedrooms
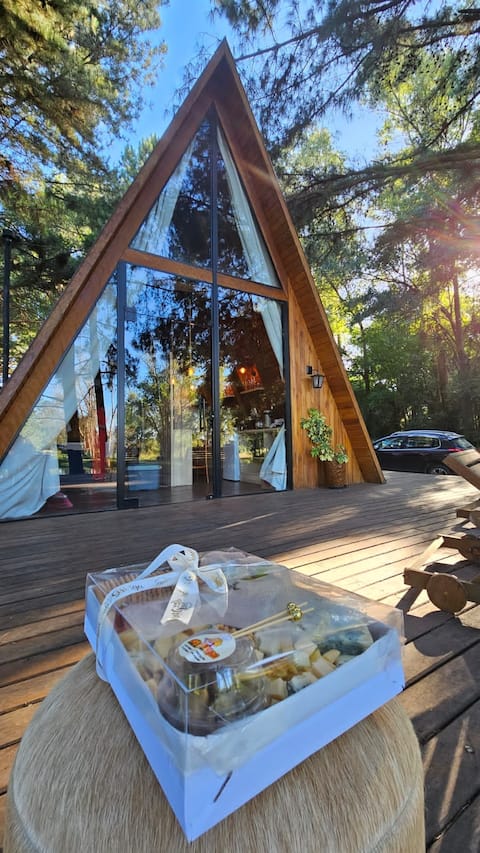
Recanto La Guilhermina - Beautiful Cabin
Entire Place • 1 bedroom
Cozy home: ideal for families
Entire Place • 2 bedrooms

Cozy 1-bedroom home
Entire Place • 1 bedroom

Hotel Chácara das Flores
Private Room • N/A

Large and modern house in the center with swimming pool
Entire Place • 2 bedrooms
Note: Performance varies based on location, size, amenities, seasonality, and management quality. Data reflects the past 12 months.
Top Performing Airbnb Hosts in São Gabriel (2026)
Learn from the best! This table showcases top-performing Airbnb hosts in São Gabriel based on the number of properties managed and estimated total revenue over the past year. Analyze their scale and performance metrics.
| Host Name | Properties | Grossing Revenue | Stay Reviews | Avg Rating |
|---|---|---|---|---|
| Anna Karoline | 3 | $22,534 | 258 | 4.74/5.0 |
| Aroldo | 2 | $14,928 | 39 | 4.82/5.0 |
| Daiane | 1 | $10,905 | 13 | 5.00/5.0 |
| José Nunes | 4 | $10,305 | 75 | 4.67/5.0 |
| Pousada Chácara Das Flores | 2 | $10,299 | 3 | 4.00/5.0 |
| Magda Lima | 3 | $5,904 | 4 | Not Rated |
| Candida Telles | 1 | $5,062 | 46 | 4.91/5.0 |
| Rose | 2 | $4,984 | 112 | 4.97/5.0 |
| Sandro | 1 | $4,391 | 95 | 4.83/5.0 |
| Leticia Boll | 1 | $4,008 | 3 | 4.67/5.0 |
Analyzing the strategies of top hosts, such as their property selection, pricing, and guest communication, can offer valuable lessons for optimizing your own Airbnb operations in São Gabriel.
Dive Deeper: Advanced São Gabriel STR Market Data (2026)
Ready to unlock more insights? AirROI provides access to advanced metrics and comprehensive Airbnb data for São Gabriel. Explore detailed analytics beyond this report to refine your investment strategy, optimize pricing, and maximize your vacation rental profits.
Explore Advanced MetricsSão Gabriel Short-Term Rental Market Composition (2026): Property & Room Types
Room Type Distribution
Property Type Distribution
Market Composition Insights for São Gabriel
- The São Gabriel Airbnb market composition is heavily skewed towards Private Room listings, which make up 59% of the 61 active rentals. This indicates strong guest preference for privacy and space.
- Looking at the property type distribution in São Gabriel, House properties are the most common (47.5%), reflecting the local real estate landscape.
- Houses represent a significant 47.5% portion, catering likely to families or larger groups.
- The presence of 31.1% Hotel/Boutique listings indicates integration with traditional hospitality.
- Smaller segments like outdoor/unique, others (combined 8.2%) offer potential for unique stay experiences.
São Gabriel Airbnb Room Capacity Analysis (2026): Bedroom Distribution
Distribution of Listings by Number of Bedrooms
Room Capacity Insights for São Gabriel
- The dominant room capacity in São Gabriel is 1 bedroom listings, making up 29.5% of the market. This suggests a strong demand for properties suitable for couples or solo travelers.
- Together, 1 bedroom and 2 bedrooms properties represent 47.5% of the active Airbnb listings in São Gabriel, indicating a high concentration in these sizes.
São Gabriel Vacation Rental Guest Capacity Trends (2026)
Distribution of Listings by Guest Capacity
Guest Capacity Insights for São Gabriel
- The most common guest capacity trend in São Gabriel vacation rentals is listings accommodating 8+ guests (19.7%). This suggests the primary traveler segment is likely larger groups.
- Properties designed for 8+ guests and 5 guests dominate the São Gabriel STR market, accounting for 31.2% of listings.
- 27.9% of properties accommodate 6+ guests, serving the market segment for larger families or group travel in São Gabriel.
- On average, properties in São Gabriel are equipped to host 3.1 guests.
São Gabriel Airbnb Booking Patterns (2026): Available vs. Booked Days
Available Days Distribution
Booked Days Distribution
Booking Pattern Insights for São Gabriel
- The most common availability pattern in São Gabriel falls within the 271-366 days range, representing 90.2% of listings. This suggests many properties have significant open periods on their calendars.
- Approximately 98.4% of listings show high availability (181+ days open annually), indicating potential for increased bookings or specific owner usage patterns.
- For booked days, the 1-30 days range is most frequent in São Gabriel (57.4%), reflecting common guest stay durations or potential owner blocking patterns.
- A notable 1.6% of properties secure long booking periods (181+ days booked per year), highlighting successful long-term rental strategies or significant owner usage.
São Gabriel Airbnb Minimum Stay Requirements Analysis
Distribution of Listings by Minimum Night Requirement
1 Night
61 listings
100% of total
Key Insights
- The most prevalent minimum stay requirement in São Gabriel is 1 Night, adopted by 100% of listings. This highlights the market's preference for shorter, flexible bookings.
- A strong majority (100.0%) of the São Gabriel Airbnb data shows acceptance of very short stays (1-2 nights), indicating a dynamic, high-turnover market.
Recommendations
- Align with the market by considering a 1 Night minimum stay, as 100% of São Gabriel hosts use this setting.
- Adjust minimum nights based on seasonality – potentially shorter during low season and longer during peak demand periods in São Gabriel.
São Gabriel Airbnb Cancellation Policy Trends Analysis (2026)
Limited
2 listings
3.3% of total
Flexible
44 listings
73.3% of total
Moderate
6 listings
10% of total
Firm
8 listings
13.3% of total
Cancellation Policy Insights for São Gabriel
- The prevailing Airbnb cancellation policy trend in São Gabriel is Flexible, used by 73.3% of listings.
- The market strongly favors guest-friendly terms, with 83.3% of listings offering Flexible or Moderate policies. This suggests guests in São Gabriel may expect booking flexibility.
Recommendations for Hosts
- Consider adopting a Flexible policy to align with the 73.3% market standard in São Gabriel.
- Given the high prevalence of Flexible policies (73.3%), offering this can enhance booking appeal, especially during shoulder seasons.
- Regularly review your cancellation policy against competitors and market demand shifts in São Gabriel.
São Gabriel STR Booking Lead Time Analysis (2026)
Average Booking Lead Time by Month
Booking Lead Time Insights for São Gabriel
- The overall average booking lead time for vacation rentals in São Gabriel is 30 days.
- Guests book furthest in advance for stays during September (average 60 days), likely coinciding with peak travel demand or local events.
- The shortest booking windows occur for stays in May (average 8 days), indicating more last-minute travel plans during this time.
- Seasonally, Winter (37 days avg.) sees the longest lead times, while Spring (18 days avg.) has the shortest, reflecting typical travel planning cycles.
Recommendations for Hosts
- Use the overall average lead time (30 days) as a baseline for your pricing and availability strategy in São Gabriel.
- For September stays, consider implementing length-of-stay discounts or slightly higher rates for bookings made less than 60 days out to capitalize on advance planning.
- During May, focus on last-minute booking availability and promotions, as guests book with very short notice (8 days avg.).
- Target marketing efforts for the Winter season well in advance (at least 37 days) to capture early planners.
- Monitor your own booking lead times against these São Gabriel averages to identify opportunities for dynamic pricing adjustments.
Popular & Essential Airbnb Amenities in São Gabriel (2026)
Amenity Prevalence
Amenity Insights for São Gabriel
- Essential amenities in São Gabriel that guests expect include: Air conditioning, Wifi. Lacking these (any) could significantly impact bookings.
- Popular amenities like TV, Free parking on premises, Kitchen are common but not universal. Offering these can provide a competitive edge.
- A pool is a highly desired but not standard amenity, making it a key feature for attracting guests seeking leisure in São Gabriel.
Recommendations for Hosts
- Ensure your listing includes all essential amenities for São Gabriel: Air conditioning, Wifi.
- Prioritize adding missing essentials: Wifi.
- Consider adding popular differentiators like TV or Free parking on premises to increase appeal.
- Highlight unique or less common amenities you offer (e.g., hot tub, dedicated workspace, EV charger) in your listing description and photos.
- Regularly check competitor amenities in São Gabriel to stay competitive.
São Gabriel Airbnb Guest Demographics & Profile Analysis (2026)
Guest Profile Summary for São Gabriel
- The typical guest profile for Airbnb in São Gabriel consists of predominantly international visitors (80%), with top international origins including Brazil, typically belonging to the Post-2000s (Gen Z/Alpha) group (50%), primarily speaking Spanish or English.
- Domestic travelers account for 20.3% of guests.
- Key international markets include Argentina (76.8%) and Brazil (20.3%).
- Top languages spoken are Spanish (48.2%) followed by English (27.2%).
- A significant demographic segment is the Post-2000s (Gen Z/Alpha) group, representing 50% of guests.
Recommendations for Hosts
- Focus marketing internationally, particularly towards travelers from Brazil.
- Offer listing details and communication support in Spanish.
- Tailor amenities and listing descriptions to appeal to the dominant Post-2000s (Gen Z/Alpha) demographic (e.g., highlight fast WiFi, smart home features, local guides).
- Highlight unique local experiences or amenities relevant to the primary guest profile.
- Consider seasonal promotions aligned with peak travel times for key origin markets.
Nearby Short-Term Rental Market Comparison
How does the São Gabriel Airbnb market stack up against its neighbors? Compare key performance metrics like average monthly revenue, ADR, and occupancy rates in surrounding areas to understand the broader regional STR landscape.
| Market | Active Properties | Monthly Revenue | Daily Rate | Avg. Occupancy |
|---|---|---|---|---|
| Itaara | 38 | $607 | $98.91 | 28% |
| Restinga Sêca | 10 | $498 | $75.11 | 27% |
| Tacuarembó | 44 | $448 | $77.54 | 30% |
| Rivera | 33 | $331 | $62.34 | 28% |
| Sant'Ana do Livramento | 68 | $312 | $39.67 | 32% |
| Alegrete | 14 | $248 | $30.37 | 40% |
| Santa Maria | 328 | $235 | $32.46 | 34% |
| Bagé | 73 | $187 | $26.26 | 36% |
| Rosário do Sul | 15 | $121 | $43.47 | 18% |
| Vila Nova do Sul | 12 | $51 | $47.79 | 14% |