Santo Ângelo Airbnb Market Analysis 2026: Short Term Rental Data & Vacation Rental Statistics in Rio Grande do Sul, Brazil
Is Airbnb profitable in Santo Ângelo in 2026? Explore comprehensive Airbnb analytics for Santo Ângelo, Rio Grande do Sul, Brazil to uncover income potential. This 2026 STR market report for Santo Ângelo, based on AirROI data from February 2025 to January 2026, reveals key trends in the niche market of 44 active listings.
Whether you're considering an Airbnb investment in Santo Ângelo, optimizing your existing vacation rental, or exploring rental arbitrage opportunities, understanding the Santo Ângelo Airbnb data is crucial. Leveraging the low regulation environment is key to maximizing your short term rental income potential. Let's dive into the specifics.
Key Santo Ângelo Airbnb Performance Metrics Overview
Monthly Airbnb Revenue Variations & Income Potential in Santo Ângelo (2026)
Understanding the monthly revenue variations for Airbnb listings in Santo Ângelo is key to maximizing your short term rental income potential. Seasonality significantly impacts earnings. Our analysis, based on data from the past 12 months, shows that the peak revenue month for STRs in Santo Ângelo is typically December, while August often presents the lowest earnings, highlighting opportunities for strategic pricing adjustments during shoulder and low seasons. Explore the typical Airbnb income in Santo Ângelo across different performance tiers:
- Best-in-class properties (Top 10%) achieve $528+ monthly, often utilizing dynamic pricing and superior guest experiences.
- Strong performing properties (Top 25%) earn $371 or more, indicating effective management and desirable locations/amenities.
- Typical properties (Median) generate around $222 per month, representing the average market performance.
- Entry-level properties (Bottom 25%) see earnings around $127, often with potential for optimization.
Average Monthly Airbnb Earnings Trend in Santo Ângelo
Santo Ângelo Airbnb Occupancy Rate Trends (2026)
Maximize your bookings by understanding the Santo Ângelo STR occupancy trends. Seasonal demand shifts significantly influence how often properties are booked. Typically, Aprilsees the highest demand (peak season occupancy), while August experiences the lowest (low season). Effective strategies, like adjusting minimum stays or offering promotions, can boost occupancy during slower periods. Here's how different property tiers perform in Santo Ângelo:
- Best-in-class properties (Top 10%) achieve 65%+ occupancy, indicating high desirability and potentially optimized availability.
- Strong performing properties (Top 25%) maintain 50% or higher occupancy, suggesting good market fit and guest satisfaction.
- Typical properties (Median) have an occupancy rate around 30%.
- Entry-level properties (Bottom 25%) average 17% occupancy, potentially facing higher vacancy.
Average Monthly Occupancy Rate Trend in Santo Ângelo
Average Daily Rate (ADR) Airbnb Trends in Santo Ângelo (2026)
Effective short term rental pricing strategy in Santo Ângelo involves understanding monthly ADR fluctuations. The Average Daily Rate (ADR) for Airbnb in Santo Ângelo typically peaks in October and dips lowest during February. Leveraging Airbnb dynamic pricing tools or strategies based on this seasonality can significantly boost revenue. Here's a look at the typical nightly rates achieved:
- Best-in-class properties (Top 10%) command rates of $52+ per night, often due to premium features or locations.
- Strong performing properties (Top 25%) achieve nightly rates of $31 or more.
- Typical properties (Median) charge around $23 per night.
- Entry-level properties (Bottom 25%) earn around $19 per night.
Average Daily Rate (ADR) Trend by Month in Santo Ângelo
Get Live Santo Ângelo Market Intelligence 👇

Explore Real-time Analytics
Airbnb Seasonality Analysis & Trends in Santo Ângelo (2026)
Peak Season (December, October, April)
- Revenue averages $363 per month
- Occupancy rates average 40.8%
- Daily rates average $32
Shoulder Season
- Revenue averages $274 per month
- Occupancy maintains around 33.3%
- Daily rates hold near $30
Low Season (May, August, November)
- Revenue drops to average $213 per month
- Occupancy decreases to average 29.0%
- Daily rates adjust to average $31
Seasonality Insights for Santo Ângelo
- The Airbnb seasonality in Santo Ângelo shows highly seasonal trends requiring careful strategy. While the sections above show seasonal averages, it's also insightful to look at the extremes:
- During the high season, the absolute peak month showcases Santo Ângelo's highest earning potential, with monthly revenues capable of climbing to $420, occupancy reaching a high of 42.8%, and ADRs peaking at $34.
- Conversely, the slowest single month of the year, typically falling within the low season, marks the market's lowest point. In this month, revenue might dip to $193, occupancy could drop to 26.0%, and ADRs may adjust down to $27.
- Understanding both the seasonal averages and these monthly peaks and troughs in revenue, occupancy, and ADR is crucial for maximizing your Airbnb profit potential in Santo Ângelo.
Seasonal Strategies for Maximizing Profit
- Peak Season: Maximize revenue through premium pricing and potentially longer minimum stays. Ensure high availability.
- Low Season: Offer competitive pricing, special promotions (e.g., extended stay discounts), and flexible cancellation policies. Target off-season travelers like remote workers or budget-conscious guests.
- Shoulder Seasons: Implement dynamic pricing that balances peak and low rates. Target weekend travelers or specific events. Offer slightly more flexible terms than peak season.
- Regularly analyze your own performance against these Santo Ângelo seasonality benchmarks and adjust your pricing and availability strategy accordingly.
Best Areas for Airbnb Investment in Santo Ângelo (2026)
Exploring the top neighborhoods for short-term rentals in Santo Ângelo? This section highlights key areas, outlining why they are attractive for hosts and guests, along with notable local attractions. Consider these locations based on your target guest profile and investment strategy.
| Neighborhood / Area | Why Host Here? (Target Guests & Appeal) | Key Attractions & Landmarks |
|---|---|---|
| Centro | The central area of Santo Ângelo, bustling with businesses, shops, and restaurants. It's a prime location for visitors looking to experience the city's culture and convenience. | Igreja Matriz de Santo Ângelo, Museu da Memória e dos Direitos Humanos, Parque da Fenamilho, Teatro Municipal de Santo Ângelo, Ponto de Cultura Casa das Artes |
| Santana | A well-established neighborhood known for its residential vibe and proximity to schools and hospitals. Attractive for families and those seeking long-term stays. | Colégio Marista Santo Ângelo, Hospital de Caridade, Praça dos Semáforos, CASC - Centro de Atividades Sociais e Culturais |
| Santo Ângelo Oeste | A rapidly developing area with newer homes and a quieter atmosphere. Suitable for an Airbnb aimed at families and longer visits. | Parque do Povo, Igreja de São Pedro, Lagoa do São Miguel, Supermercados e comércio local |
| Vila Nova | A neighborhood known for its calm environment, ideal for those who want a peaceful retreat while still being close to the city center. | Praça Maringá, Supermercados, Praça da Família, CIC - Centro de Instrução e Capacitação |
| São Carlos | This area features more affordable housing and is attractive for budget travelers and those looking for longer-term stays. | Igreja de São Carlos Borromeu, Praça do Bairro, Mercados e comércio local |
| Nova Inglaterra | An up-and-coming neighborhood with plenty of green spaces, attracting visitors interested in outdoor activities and a relaxed atmosphere. | Parque Nova Inglaterra, Centro de Eventos, Ruas arborizadas |
| Harmonia | A small, cozy neighborhood that provides a unique local experience, perfect for those wanting to immerse themselves in the culture of Santo Ângelo. | Praça Harmonia, Bares e restaurantes locais, Atividades culturais |
| Jardim Planalto | This suburban area is popular among families and offers safe and quiet environments, ideal for a family-friendly Airbnb. | Escolas locais, Parque Jardim Planalto, Comércio e serviços disponíveis |
Understanding Airbnb License Requirements & STR Laws in Santo Ângelo (2026)
While Santo Ângelo, Rio Grande do Sul, Brazil currently shows low STR regulations, specific Airbnb license requirements might still exist or change. Always verify the latest short term rental regulations and Airbnb license requirements directly with local government authorities for Santo Ângelo to ensure full compliance before hosting.
(Source: AirROI data, 2026, finding no licensed listings among those analyzed)
Top Performing Airbnb Properties in Santo Ângelo (2026)
Benchmark your potential! Explore examples of top-performing Airbnb properties in Santo Ângelobased on Trailing Twelve Month (TTM) revenue. Analyze their characteristics, revenue, occupancy rate, and ADR to understand what drives success in this market.
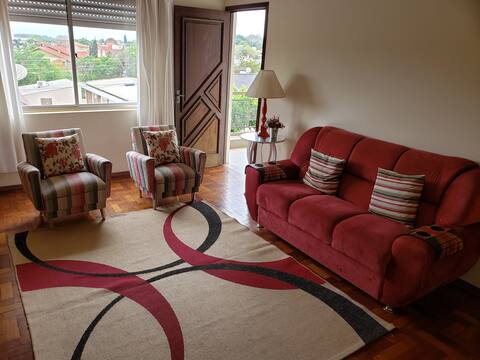
Spacious 3-bedroom apartment in Santo Ângelo
Entire Place • 3 bedrooms

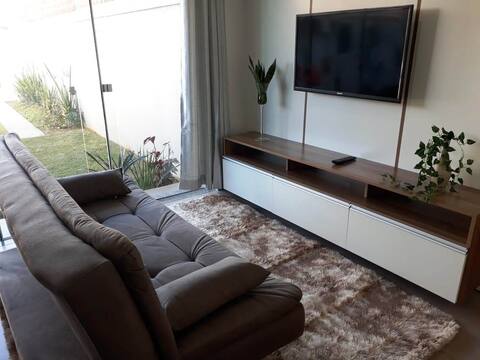
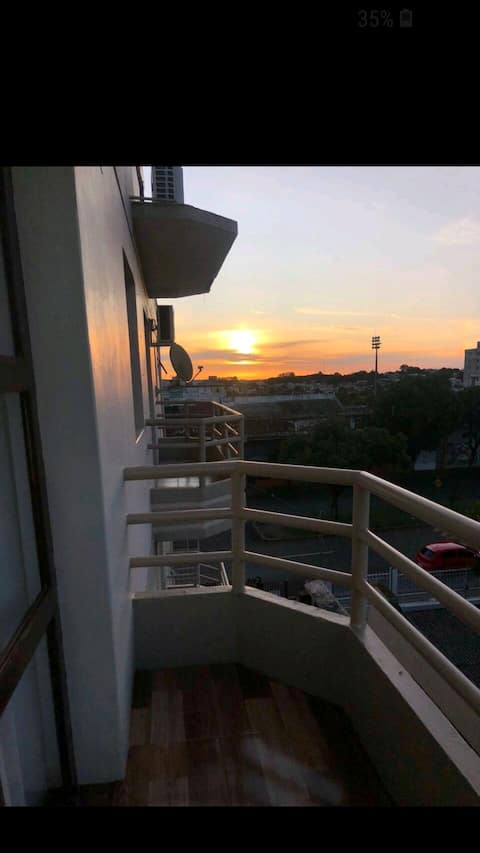
Penthouse with View and Comfort in RS
Entire Place • 3 bedrooms
Elegant Refuge, Luxury Townhouse.
Entire Place • 2 bedrooms

In the heart of the City of Angels, warmth and mate.
Entire Place • 3 bedrooms

Cozy apartment and central
Entire Place • 1 bedroom
cozy apartment
Entire Place • 3 bedrooms
Note: Performance varies based on location, size, amenities, seasonality, and management quality. Data reflects the past 12 months.
Top Performing Airbnb Hosts in Santo Ângelo (2026)
Learn from the best! This table showcases top-performing Airbnb hosts in Santo Ângelo based on the number of properties managed and estimated total revenue over the past year. Analyze their scale and performance metrics.
| Host Name | Properties | Grossing Revenue | Stay Reviews | Avg Rating |
|---|---|---|---|---|
| Marcus | 5 | $14,761 | 201 | 4.86/5.0 |
| Angela Soares | 3 | $11,631 | 327 | 4.95/5.0 |
| Renilda | 1 | $7,167 | 73 | 4.96/5.0 |
| Welhome Brasil | 1 | $7,080 | 10 | 4.90/5.0 |
| Jacinta | 2 | $5,402 | 195 | 4.86/5.0 |
| Greyce | 2 | $4,937 | 124 | 4.96/5.0 |
| Sirlene | 1 | $4,397 | 16 | 5.00/5.0 |
| Irma Antoninha | 1 | $4,362 | 62 | 4.98/5.0 |
| Velci | 1 | $4,011 | 76 | 4.95/5.0 |
| Vitoria | 1 | $3,608 | 23 | 4.83/5.0 |
Analyzing the strategies of top hosts, such as their property selection, pricing, and guest communication, can offer valuable lessons for optimizing your own Airbnb operations in Santo Ângelo.
Dive Deeper: Advanced Santo Ângelo STR Market Data (2026)
Ready to unlock more insights? AirROI provides access to advanced metrics and comprehensive Airbnb data for Santo Ângelo. Explore detailed analytics beyond this report to refine your investment strategy, optimize pricing, and maximize your vacation rental profits.
Explore Advanced MetricsSanto Ângelo Short-Term Rental Market Composition (2026): Property & Room Types
Room Type Distribution
Property Type Distribution
Market Composition Insights for Santo Ângelo
- The Santo Ângelo Airbnb market composition is heavily skewed towards Entire Home/Apt listings, which make up 95.5% of the 44 active rentals. This indicates strong guest preference for privacy and space.
- Looking at the property type distribution in Santo Ângelo, Apartment/Condo properties are the most common (68.2%), reflecting the local real estate landscape.
- Houses represent a significant 22.7% portion, catering likely to families or larger groups.
- Smaller segments like hotel/boutique, outdoor/unique (combined 9.0%) offer potential for unique stay experiences.
Santo Ângelo Airbnb Room Capacity Analysis (2026): Bedroom Distribution
Distribution of Listings by Number of Bedrooms
Room Capacity Insights for Santo Ângelo
- The dominant room capacity in Santo Ângelo is 2 bedrooms listings, making up 47.7% of the market. This suggests a strong demand for properties suitable for couples or solo travelers.
- Together, 2 bedrooms and 1 bedroom properties represent 81.8% of the active Airbnb listings in Santo Ângelo, indicating a high concentration in these sizes.
Santo Ângelo Vacation Rental Guest Capacity Trends (2026)
Distribution of Listings by Guest Capacity
Guest Capacity Insights for Santo Ângelo
- The most common guest capacity trend in Santo Ângelo vacation rentals is listings accommodating 4 guests (25%). This suggests the primary traveler segment is likely small families or groups.
- Properties designed for 4 guests and 6 guests dominate the Santo Ângelo STR market, accounting for 45.5% of listings.
- 25.1% of properties accommodate 6+ guests, serving the market segment for larger families or group travel in Santo Ângelo.
- On average, properties in Santo Ângelo are equipped to host 4.2 guests.
Santo Ângelo Airbnb Booking Patterns (2026): Available vs. Booked Days
Available Days Distribution
Booked Days Distribution
Booking Pattern Insights for Santo Ângelo
- The most common availability pattern in Santo Ângelo falls within the 271-366 days range, representing 52.3% of listings. This suggests many properties have significant open periods on their calendars.
- Approximately 90.9% of listings show high availability (181+ days open annually), indicating potential for increased bookings or specific owner usage patterns.
- For booked days, the 91-180 days range is most frequent in Santo Ângelo (38.6%), reflecting common guest stay durations or potential owner blocking patterns.
- A notable 9.1% of properties secure long booking periods (181+ days booked per year), highlighting successful long-term rental strategies or significant owner usage.
Santo Ângelo Airbnb Minimum Stay Requirements Analysis
Distribution of Listings by Minimum Night Requirement
1 Night
25 listings
56.8% of total
2 Nights
9 listings
20.5% of total
30+ Nights
10 listings
22.7% of total
Key Insights
- The most prevalent minimum stay requirement in Santo Ângelo is 1 Night, adopted by 56.8% of listings. This highlights the market's preference for shorter, flexible bookings.
- A strong majority (77.3%) of the Santo Ângelo Airbnb data shows acceptance of very short stays (1-2 nights), indicating a dynamic, high-turnover market.
- A significant segment (22.7%) caters to monthly stays (30+ nights) in Santo Ângelo, pointing to opportunities in the extended-stay market.
Recommendations
- Align with the market by considering a 1 Night minimum stay, as 56.8% of Santo Ângelo hosts use this setting.
- Explore offering discounts for stays of 30+ nights to attract the 22.7% of the market seeking extended stays.
- Adjust minimum nights based on seasonality – potentially shorter during low season and longer during peak demand periods in Santo Ângelo.
Santo Ângelo Airbnb Cancellation Policy Trends Analysis (2026)
Flexible
25 listings
56.8% of total
Moderate
13 listings
29.5% of total
Firm
3 listings
6.8% of total
Strict
3 listings
6.8% of total
Cancellation Policy Insights for Santo Ângelo
- The prevailing Airbnb cancellation policy trend in Santo Ângelo is Flexible, used by 56.8% of listings.
- The market strongly favors guest-friendly terms, with 86.3% of listings offering Flexible or Moderate policies. This suggests guests in Santo Ângelo may expect booking flexibility.
- Strict cancellation policies are quite rare (6.8%), potentially making listings with this policy less competitive unless justified by high demand or property type.
Recommendations for Hosts
- Consider adopting a Flexible policy to align with the 56.8% market standard in Santo Ângelo.
- Given the high prevalence of Flexible policies (56.8%), offering this can enhance booking appeal, especially during shoulder seasons.
- Using a Strict policy might deter some guests, as only 6.8% of listings use it. Evaluate if potential revenue protection outweighs possible lower booking rates.
- Regularly review your cancellation policy against competitors and market demand shifts in Santo Ângelo.
Santo Ângelo STR Booking Lead Time Analysis (2026)
Average Booking Lead Time by Month
Booking Lead Time Insights for Santo Ângelo
- The overall average booking lead time for vacation rentals in Santo Ângelo is 14 days.
- Guests book furthest in advance for stays during April (average 20 days), likely coinciding with peak travel demand or local events.
- The shortest booking windows occur for stays in July (average 8 days), indicating more last-minute travel plans during this time.
- Seasonally, Winter (16 days avg.) sees the longest lead times, while Summer (13 days avg.) has the shortest, reflecting typical travel planning cycles.
Recommendations for Hosts
- Use the overall average lead time (14 days) as a baseline for your pricing and availability strategy in Santo Ângelo.
- Target marketing efforts for the Winter season well in advance (at least 16 days) to capture early planners.
- Monitor your own booking lead times against these Santo Ângelo averages to identify opportunities for dynamic pricing adjustments.
Popular & Essential Airbnb Amenities in Santo Ângelo (2026)
Amenity Prevalence
Amenity Insights for Santo Ângelo
- Essential amenities in Santo Ângelo that guests expect include: Wifi. Lacking these (this) could significantly impact bookings.
- Popular amenities like Air conditioning, Kitchen, TV are common but not universal. Offering these can provide a competitive edge.
Recommendations for Hosts
- Ensure your listing includes all essential amenities for Santo Ângelo: Wifi.
- Consider adding popular differentiators like Air conditioning or Kitchen to increase appeal.
- Highlight unique or less common amenities you offer (e.g., hot tub, dedicated workspace, EV charger) in your listing description and photos.
- Regularly check competitor amenities in Santo Ângelo to stay competitive.
Santo Ângelo Airbnb Guest Demographics & Profile Analysis (2026)
Guest Profile Summary for Santo Ângelo
- The typical guest profile for Airbnb in Santo Ângelo consists of primarily domestic travelers (93%), often arriving from nearby Rio Grande do Sul, typically belonging to the Post-2000s (Gen Z/Alpha) group (50%), primarily speaking Portuguese or English.
- Domestic travelers account for 93.0% of guests.
- Key international markets include Brazil (93%) and Argentina (2.5%).
- Top languages spoken are Portuguese (45.1%) followed by English (26.4%).
- A significant demographic segment is the Post-2000s (Gen Z/Alpha) group, representing 50% of guests.
Recommendations for Hosts
- Target domestic marketing efforts towards travelers from Rio Grande do Sul and Porto Alegre.
- Tailor amenities and listing descriptions to appeal to the dominant Post-2000s (Gen Z/Alpha) demographic (e.g., highlight fast WiFi, smart home features, local guides).
- Highlight unique local experiences or amenities relevant to the primary guest profile.
- Consider seasonal promotions aligned with peak travel times for key origin markets.
Nearby Short-Term Rental Market Comparison
How does the Santo Ângelo Airbnb market stack up against its neighbors? Compare key performance metrics like average monthly revenue, ADR, and occupancy rates in surrounding areas to understand the broader regional STR landscape.
| Market | Active Properties | Monthly Revenue | Daily Rate | Avg. Occupancy |
|---|---|---|---|---|
| Itaara | 38 | $607 | $98.91 | 28% |
| Restinga Sêca | 10 | $498 | $75.11 | 27% |
| Frederico Westphalen | 15 | $405 | $37.43 | 40% |
| Ametista do Sul | 34 | $351 | $68.33 | 25% |
| Encarnación | 24 | $327 | $137.83 | 26% |
| Encarnacion | 220 | $321 | $71.77 | 24% |
| Posadas | 314 | $310 | $50.00 | 31% |
| Hohenau | 14 | $298 | $45.77 | 31% |
| Três Passos | 12 | $291 | $55.98 | 17% |
| Alegrete | 14 | $248 | $30.37 | 40% |