São Borja Airbnb Market Analysis 2026: Short Term Rental Data & Vacation Rental Statistics in Rio Grande do Sul, Brazil
Is Airbnb profitable in São Borja in 2026? Explore comprehensive Airbnb analytics for São Borja, Rio Grande do Sul, Brazil to uncover income potential. This 2026 STR market report for São Borja, based on AirROI data from February 2025 to January 2026, reveals key trends in the niche market of 19 active listings.
Whether you're considering an Airbnb investment in São Borja, optimizing your existing vacation rental, or exploring rental arbitrage opportunities, understanding the São Borja Airbnb data is crucial. Leveraging the low regulation environment is key to maximizing your short term rental income potential. Let's dive into the specifics.
Key São Borja Airbnb Performance Metrics Overview
Monthly Airbnb Revenue Variations & Income Potential in São Borja (2026)
Understanding the monthly revenue variations for Airbnb listings in São Borja is key to maximizing your short term rental income potential. Seasonality significantly impacts earnings. Our analysis, based on data from the past 12 months, shows that the peak revenue month for STRs in São Borja is typically December, while May often presents the lowest earnings, highlighting opportunities for strategic pricing adjustments during shoulder and low seasons. Explore the typical Airbnb income in São Borja across different performance tiers:
- Best-in-class properties (Top 10%) achieve $746+ monthly, often utilizing dynamic pricing and superior guest experiences.
- Strong performing properties (Top 25%) earn $493 or more, indicating effective management and desirable locations/amenities.
- Typical properties (Median) generate around $264 per month, representing the average market performance.
- Entry-level properties (Bottom 25%) see earnings around $155, often with potential for optimization.
Average Monthly Airbnb Earnings Trend in São Borja
São Borja Airbnb Occupancy Rate Trends (2026)
Maximize your bookings by understanding the São Borja STR occupancy trends. Seasonal demand shifts significantly influence how often properties are booked. Typically, Februarysees the highest demand (peak season occupancy), while May experiences the lowest (low season). Effective strategies, like adjusting minimum stays or offering promotions, can boost occupancy during slower periods. Here's how different property tiers perform in São Borja:
- Best-in-class properties (Top 10%) achieve 56%+ occupancy, indicating high desirability and potentially optimized availability.
- Strong performing properties (Top 25%) maintain 46% or higher occupancy, suggesting good market fit and guest satisfaction.
- Typical properties (Median) have an occupancy rate around 28%.
- Entry-level properties (Bottom 25%) average 14% occupancy, potentially facing higher vacancy.
Average Monthly Occupancy Rate Trend in São Borja
Average Daily Rate (ADR) Airbnb Trends in São Borja (2026)
Effective short term rental pricing strategy in São Borja involves understanding monthly ADR fluctuations. The Average Daily Rate (ADR) for Airbnb in São Borja typically peaks in December and dips lowest during February. Leveraging Airbnb dynamic pricing tools or strategies based on this seasonality can significantly boost revenue. Here's a look at the typical nightly rates achieved:
- Best-in-class properties (Top 10%) command rates of $56+ per night, often due to premium features or locations.
- Strong performing properties (Top 25%) achieve nightly rates of $43 or more.
- Typical properties (Median) charge around $35 per night.
- Entry-level properties (Bottom 25%) earn around $29 per night.
Average Daily Rate (ADR) Trend by Month in São Borja
Get Live São Borja Market Intelligence 👇
Explore Real-time Analytics
Airbnb Seasonality Analysis & Trends in São Borja (2026)
Peak Season (December, October, February)
- Revenue averages $535 per month
- Occupancy rates average 44.1%
- Daily rates average $39
Shoulder Season
- Revenue averages $396 per month
- Occupancy maintains around 28.3%
- Daily rates hold near $39
Low Season (April, May, June)
- Revenue drops to average $269 per month
- Occupancy decreases to average 26.5%
- Daily rates adjust to average $37
Seasonality Insights for São Borja
- The Airbnb seasonality in São Borja shows highly seasonal trends requiring careful strategy. While the sections above show seasonal averages, it's also insightful to look at the extremes:
- During the high season, the absolute peak month showcases São Borja's highest earning potential, with monthly revenues capable of climbing to $550, occupancy reaching a high of 55.0%, and ADRs peaking at $41.
- Conversely, the slowest single month of the year, typically falling within the low season, marks the market's lowest point. In this month, revenue might dip to $209, occupancy could drop to 19.9%, and ADRs may adjust down to $35.
- Understanding both the seasonal averages and these monthly peaks and troughs in revenue, occupancy, and ADR is crucial for maximizing your Airbnb profit potential in São Borja.
Seasonal Strategies for Maximizing Profit
- Peak Season: Maximize revenue through premium pricing and potentially longer minimum stays. Ensure high availability.
- Low Season: Offer competitive pricing, special promotions (e.g., extended stay discounts), and flexible cancellation policies. Target off-season travelers like remote workers or budget-conscious guests.
- Shoulder Seasons: Implement dynamic pricing that balances peak and low rates. Target weekend travelers or specific events. Offer slightly more flexible terms than peak season.
- Regularly analyze your own performance against these São Borja seasonality benchmarks and adjust your pricing and availability strategy accordingly.
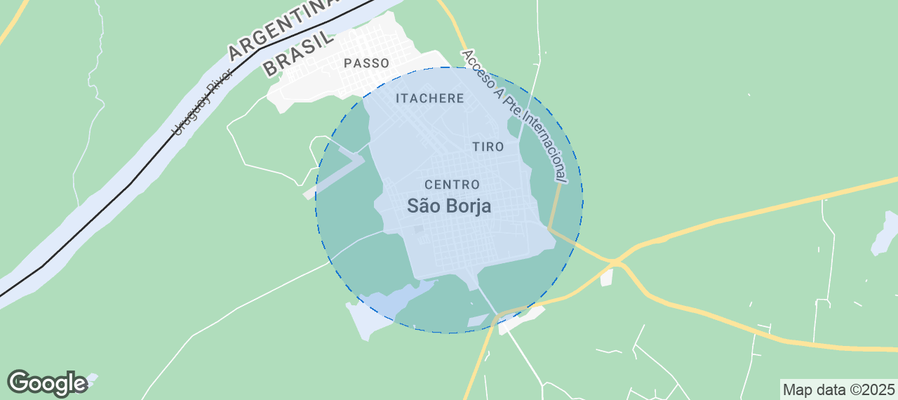
Best Areas for Airbnb Investment in São Borja (2026)
Exploring the top neighborhoods for short-term rentals in São Borja? This section highlights key areas, outlining why they are attractive for hosts and guests, along with notable local attractions. Consider these locations based on your target guest profile and investment strategy.
| Neighborhood / Area | Why Host Here? (Target Guests & Appeal) | Key Attractions & Landmarks |
|---|---|---|
| Centro | The central area of São Borja offers easy access to key attractions, shopping centers, and local culture. Its bustling streets are perfect for tourists seeking a lively atmosphere. | São Borja Historical Museum, Igreja Matriz de São Borja, Praça da Bandeira, Memorial of the Republic, Casa de Cultura, Mercado Público |
| São Francisco | A neighborhood with a tranquil environment and close proximity to the São Francisco River, ideal for visitors seeking nature and a relaxing atmosphere. | Parque da Cidade, Caminho dos Pomares, Praça Marcolino Gomes, Feira do Livro, Café da Praça |
| Vila Tiaraju | This residential area is becoming popular among travelers looking for local experiences, offering a glimpse into the daily life of São Borja's residents. | Feira Livre, Vila Tiaraju Ecological Park, Ciclofaixa, Cultura Caúca, Parque de Exposições |
| São João | A quiet neighborhood known for its parks and green spaces, attracting families and nature lovers. Great for those who wish to escape the urban hustle. | Praça São João, Parque do Amor, Bosque da Criança, Igreja São João Batista |
| Vila Popular | An up-and-coming area with a community vibe. Offers a unique charm and is gaining attention for its local shops and restaurants. | Casa da Cultura Popular, Café e Bistrô, Praça do Povo, Eventos comunitários |
| Quinta dos Açorianos | A picturesque neighborhood perfect for families and groups, known for its spacious homes and proximity to parks and leisure areas. | Parque das Águas, Clube de Campo, Eventos ao ar livre |
| Bairro dos Materiais | An emerging area with affordable options for accommodations, attracting budget travelers and local visitors alike. | Feiras de Artesanato, Comércio Local, Praça do Comércio |
| Vila Rodrigues | Family-friendly neighborhood with schools and parks, ideal for longer stays and those looking to enjoy a quieter side of São Borja. | Parque das Crianças, Cidadela São Borja, Centro Educacional São Borja |
Understanding Airbnb License Requirements & STR Laws in São Borja (2026)
While São Borja, Rio Grande do Sul, Brazil currently shows low STR regulations, specific Airbnb license requirements might still exist or change. Always verify the latest short term rental regulations and Airbnb license requirements directly with local government authorities for São Borja to ensure full compliance before hosting.
(Source: AirROI data, 2026, finding no licensed listings among those analyzed)
Top Performing Airbnb Properties in São Borja (2026)
Benchmark your potential! Explore examples of top-performing Airbnb properties in São Borjabased on Trailing Twelve Month (TTM) revenue. Analyze their characteristics, revenue, occupancy rate, and ADR to understand what drives success in this market.

House with en-suites, ample space and pool.
Entire Place • 4 bedrooms

Cozy house next to the Exhibition Park
Entire Place • 2 bedrooms

Large central 2-bedroom apartment
Entire Place • 2 bedrooms

Studio 2. Smells good. New. I issue invoice. Self Check-in
Entire Place • 1 bedroom

661 Accommodation (Hotel)
Private Room • 1 bedroom

Central, spacious apartment with garage
Entire Place • 3 bedrooms
Note: Performance varies based on location, size, amenities, seasonality, and management quality. Data reflects the past 12 months.
Top Performing Airbnb Hosts in São Borja (2026)
Learn from the best! This table showcases top-performing Airbnb hosts in São Borja based on the number of properties managed and estimated total revenue over the past year. Analyze their scale and performance metrics.
| Host Name | Properties | Grossing Revenue | Stay Reviews | Avg Rating |
|---|---|---|---|---|
| Luci | 2 | $13,978 | 63 | 4.97/5.0 |
| Vi | 1 | $8,487 | 44 | 4.98/5.0 |
| Mari | 1 | $7,538 | 124 | 4.94/5.0 |
| Renata | 2 | $5,332 | 114 | 4.89/5.0 |
| Geison | 1 | $5,104 | 80 | 5.00/5.0 |
| Márcia | 1 | $4,835 | 66 | 4.94/5.0 |
| Tiago | 1 | $4,507 | 56 | 4.98/5.0 |
| Rosane | 1 | $4,359 | 70 | 4.99/5.0 |
| Marcio | 2 | $3,064 | 124 | 4.64/5.0 |
| Paula | 1 | $2,732 | 70 | 4.97/5.0 |
Analyzing the strategies of top hosts, such as their property selection, pricing, and guest communication, can offer valuable lessons for optimizing your own Airbnb operations in São Borja.
Dive Deeper: Advanced São Borja STR Market Data (2026)
Ready to unlock more insights? AirROI provides access to advanced metrics and comprehensive Airbnb data for São Borja. Explore detailed analytics beyond this report to refine your investment strategy, optimize pricing, and maximize your vacation rental profits.
Explore Advanced MetricsSão Borja Short-Term Rental Market Composition (2026): Property & Room Types
Room Type Distribution
Property Type Distribution
Market Composition Insights for São Borja
- The São Borja Airbnb market composition is heavily skewed towards Entire Home/Apt listings, which make up 84.2% of the 19 active rentals. This indicates strong guest preference for privacy and space.
- Looking at the property type distribution in São Borja, Apartment/Condo properties are the most common (47.4%), reflecting the local real estate landscape.
- Houses represent a significant 42.1% portion, catering likely to families or larger groups.
- The presence of 5.3% Hotel/Boutique listings indicates integration with traditional hospitality.
São Borja Airbnb Room Capacity Analysis (2026): Bedroom Distribution
Distribution of Listings by Number of Bedrooms
Room Capacity Insights for São Borja
- The dominant room capacity in São Borja is 1 bedroom listings, making up 57.9% of the market. This suggests a strong demand for properties suitable for couples or solo travelers.
- Together, 1 bedroom and 2 bedrooms properties represent 84.2% of the active Airbnb listings in São Borja, indicating a high concentration in these sizes.
- With over half the market (57.9%) consisting of studios or 1-bedroom units, São Borja is particularly well-suited for individuals or couples.
São Borja Vacation Rental Guest Capacity Trends (2026)
Distribution of Listings by Guest Capacity
Guest Capacity Insights for São Borja
- The most common guest capacity trend in São Borja vacation rentals is listings accommodating 3 guests (26.3%). This suggests the primary traveler segment is likely small families or groups.
- Properties designed for 3 guests and 5 guests dominate the São Borja STR market, accounting for 42.1% of listings.
- 21.1% of properties accommodate 6+ guests, serving the market segment for larger families or group travel in São Borja.
- On average, properties in São Borja are equipped to host 3.9 guests.
São Borja Airbnb Booking Patterns (2026): Available vs. Booked Days
Available Days Distribution
Booked Days Distribution
Booking Pattern Insights for São Borja
- The most common availability pattern in São Borja falls within the 271-366 days range, representing 57.9% of listings. This suggests many properties have significant open periods on their calendars.
- Approximately 94.7% of listings show high availability (181+ days open annually), indicating potential for increased bookings or specific owner usage patterns.
- For booked days, the 91-180 days range is most frequent in São Borja (36.8%), reflecting common guest stay durations or potential owner blocking patterns.
- A notable 5.3% of properties secure long booking periods (181+ days booked per year), highlighting successful long-term rental strategies or significant owner usage.
São Borja Airbnb Minimum Stay Requirements Analysis
Distribution of Listings by Minimum Night Requirement
1 Night
15 listings
78.9% of total
30+ Nights
4 listings
21.1% of total
Key Insights
- The most prevalent minimum stay requirement in São Borja is 1 Night, adopted by 78.9% of listings. This highlights the market's preference for shorter, flexible bookings.
- A strong majority (78.9%) of the São Borja Airbnb data shows acceptance of very short stays (1-2 nights), indicating a dynamic, high-turnover market.
- A significant segment (21.1%) caters to monthly stays (30+ nights) in São Borja, pointing to opportunities in the extended-stay market.
Recommendations
- Align with the market by considering a 1 Night minimum stay, as 78.9% of São Borja hosts use this setting.
- Explore offering discounts for stays of 30+ nights to attract the 21.1% of the market seeking extended stays.
- Adjust minimum nights based on seasonality – potentially shorter during low season and longer during peak demand periods in São Borja.
São Borja Airbnb Cancellation Policy Trends Analysis (2026)
Flexible
11 listings
57.9% of total
Moderate
5 listings
26.3% of total
Firm
2 listings
10.5% of total
Strict
1 listings
5.3% of total
Cancellation Policy Insights for São Borja
- The prevailing Airbnb cancellation policy trend in São Borja is Flexible, used by 57.9% of listings.
- The market strongly favors guest-friendly terms, with 84.2% of listings offering Flexible or Moderate policies. This suggests guests in São Borja may expect booking flexibility.
- Strict cancellation policies are quite rare (5.3%), potentially making listings with this policy less competitive unless justified by high demand or property type.
Recommendations for Hosts
- Consider adopting a Flexible policy to align with the 57.9% market standard in São Borja.
- Given the high prevalence of Flexible policies (57.9%), offering this can enhance booking appeal, especially during shoulder seasons.
- Using a Strict policy might deter some guests, as only 5.3% of listings use it. Evaluate if potential revenue protection outweighs possible lower booking rates.
- Regularly review your cancellation policy against competitors and market demand shifts in São Borja.
São Borja STR Booking Lead Time Analysis (2026)
Average Booking Lead Time by Month
Booking Lead Time Insights for São Borja
- The overall average booking lead time for vacation rentals in São Borja is 17 days.
- Guests book furthest in advance for stays during July (average 45 days), likely coinciding with peak travel demand or local events.
- The shortest booking windows occur for stays in October (average 6 days), indicating more last-minute travel plans during this time.
- Seasonally, Summer (24 days avg.) sees the longest lead times, while Fall (10 days avg.) has the shortest, reflecting typical travel planning cycles.
Recommendations for Hosts
- Use the overall average lead time (17 days) as a baseline for your pricing and availability strategy in São Borja.
- For July stays, consider implementing length-of-stay discounts or slightly higher rates for bookings made less than 45 days out to capitalize on advance planning.
- During October, focus on last-minute booking availability and promotions, as guests book with very short notice (6 days avg.).
- Target marketing efforts for the Summer season well in advance (at least 24 days) to capture early planners.
- Monitor your own booking lead times against these São Borja averages to identify opportunities for dynamic pricing adjustments.
Popular & Essential Airbnb Amenities in São Borja (2026)
Amenity Prevalence
Amenity Insights for São Borja
- Essential amenities in São Borja that guests expect include: Wifi, Air conditioning. Lacking these (any) could significantly impact bookings.
- Popular amenities like Free parking on premises, TV, Kitchen are common but not universal. Offering these can provide a competitive edge.
Recommendations for Hosts
- Ensure your listing includes all essential amenities for São Borja: Wifi, Air conditioning.
- Consider adding popular differentiators like Free parking on premises or TV to increase appeal.
- Highlight unique or less common amenities you offer (e.g., hot tub, dedicated workspace, EV charger) in your listing description and photos.
- Regularly check competitor amenities in São Borja to stay competitive.
São Borja Airbnb Guest Demographics & Profile Analysis (2026)
Guest Profile Summary for São Borja
- The typical guest profile for Airbnb in São Borja consists of primarily domestic travelers (83%), often arriving from nearby Rio Grande do Sul, typically belonging to the Post-2000s (Gen Z/Alpha) group (50%), primarily speaking Portuguese or Spanish.
- Domestic travelers account for 83.1% of guests.
- Key international markets include Brazil (83.1%) and Argentina (9.5%).
- Top languages spoken are Portuguese (39.8%) followed by Spanish (33%).
- A significant demographic segment is the Post-2000s (Gen Z/Alpha) group, representing 50% of guests.
Recommendations for Hosts
- Target domestic marketing efforts towards travelers from Rio Grande do Sul and Porto Alegre.
- Tailor amenities and listing descriptions to appeal to the dominant Post-2000s (Gen Z/Alpha) demographic (e.g., highlight fast WiFi, smart home features, local guides).
- Highlight unique local experiences or amenities relevant to the primary guest profile.
- Consider seasonal promotions aligned with peak travel times for key origin markets.
Nearby Short-Term Rental Market Comparison
How does the São Borja Airbnb market stack up against its neighbors? Compare key performance metrics like average monthly revenue, ADR, and occupancy rates in surrounding areas to understand the broader regional STR landscape.
| Market | Active Properties | Monthly Revenue | Daily Rate | Avg. Occupancy |
|---|---|---|---|---|
| Municipio de Mercedes | 18 | $365 | $150.19 | 21% |
| Encarnación | 24 | $327 | $137.83 | 26% |
| Encarnacion | 220 | $321 | $71.77 | 24% |
| Posadas | 314 | $310 | $50.00 | 31% |
| Hohenau | 14 | $298 | $45.77 | 31% |
| Municipio de Ituzaingó | 22 | $279 | $82.31 | 19% |
| Uruguaiana | 75 | $278 | $38.49 | 35% |
| Municipio de Paso de los Libres | 11 | $254 | $55.14 | 26% |
| Alegrete | 14 | $248 | $30.37 | 40% |
| Municipio de Oberá | 32 | $137 | $36.48 | 23% |