Rolante Airbnb Market Analysis 2026: Short Term Rental Data & Vacation Rental Statistics in Rio Grande do Sul, Brazil
Is Airbnb profitable in Rolante in 2026? Explore comprehensive Airbnb analytics for Rolante, Rio Grande do Sul, Brazil to uncover income potential. This 2026 STR market report for Rolante, based on AirROI data from February 2025 to January 2026, reveals key trends in the niche market of 64 active listings.
Whether you're considering an Airbnb investment in Rolante, optimizing your existing vacation rental, or exploring rental arbitrage opportunities, understanding the Rolante Airbnb data is crucial. Leveraging the low regulation environment is key to maximizing your short term rental income potential. Let's dive into the specifics.
Key Rolante Airbnb Performance Metrics Overview
Monthly Airbnb Revenue Variations & Income Potential in Rolante (2026)
Understanding the monthly revenue variations for Airbnb listings in Rolante is key to maximizing your short term rental income potential. Seasonality significantly impacts earnings. Our analysis, based on data from the past 12 months, shows that the peak revenue month for STRs in Rolante is typically January, while September often presents the lowest earnings, highlighting opportunities for strategic pricing adjustments during shoulder and low seasons. Explore the typical Airbnb income in Rolante across different performance tiers:
- Best-in-class properties (Top 10%) achieve $1,148+ monthly, often utilizing dynamic pricing and superior guest experiences.
- Strong performing properties (Top 25%) earn $617 or more, indicating effective management and desirable locations/amenities.
- Typical properties (Median) generate around $294 per month, representing the average market performance.
- Entry-level properties (Bottom 25%) see earnings around $139, often with potential for optimization.
Average Monthly Airbnb Earnings Trend in Rolante
Rolante Airbnb Occupancy Rate Trends (2026)
Maximize your bookings by understanding the Rolante STR occupancy trends. Seasonal demand shifts significantly influence how often properties are booked. Typically, Marchsees the highest demand (peak season occupancy), while September experiences the lowest (low season). Effective strategies, like adjusting minimum stays or offering promotions, can boost occupancy during slower periods. Here's how different property tiers perform in Rolante:
- Best-in-class properties (Top 10%) achieve 55%+ occupancy, indicating high desirability and potentially optimized availability.
- Strong performing properties (Top 25%) maintain 37% or higher occupancy, suggesting good market fit and guest satisfaction.
- Typical properties (Median) have an occupancy rate around 19%.
- Entry-level properties (Bottom 25%) average 11% occupancy, potentially facing higher vacancy.
Average Monthly Occupancy Rate Trend in Rolante
Average Daily Rate (ADR) Airbnb Trends in Rolante (2026)
Effective short term rental pricing strategy in Rolante involves understanding monthly ADR fluctuations. The Average Daily Rate (ADR) for Airbnb in Rolante typically peaks in December and dips lowest during February. Leveraging Airbnb dynamic pricing tools or strategies based on this seasonality can significantly boost revenue. Here's a look at the typical nightly rates achieved:
- Best-in-class properties (Top 10%) command rates of $88+ per night, often due to premium features or locations.
- Strong performing properties (Top 25%) achieve nightly rates of $63 or more.
- Typical properties (Median) charge around $51 per night.
- Entry-level properties (Bottom 25%) earn around $37 per night.
Average Daily Rate (ADR) Trend by Month in Rolante
Get Live Rolante Market Intelligence 👇

Explore Real-time Analytics
Airbnb Seasonality Analysis & Trends in Rolante (2026)
Peak Season (January, December, March)
- Revenue averages $578 per month
- Occupancy rates average 30.2%
- Daily rates average $58
Shoulder Season
- Revenue averages $477 per month
- Occupancy maintains around 25.1%
- Daily rates hold near $56
Low Season (April, May, September)
- Revenue drops to average $394 per month
- Occupancy decreases to average 22.4%
- Daily rates adjust to average $54
Seasonality Insights for Rolante
- The Airbnb seasonality in Rolante shows moderate seasonality with distinct peak and low periods. While the sections above show seasonal averages, it's also insightful to look at the extremes:
- During the high season, the absolute peak month showcases Rolante's highest earning potential, with monthly revenues capable of climbing to $610, occupancy reaching a high of 31.9%, and ADRs peaking at $61.
- Conversely, the slowest single month of the year, typically falling within the low season, marks the market's lowest point. In this month, revenue might dip to $378, occupancy could drop to 19.9%, and ADRs may adjust down to $50.
- Understanding both the seasonal averages and these monthly peaks and troughs in revenue, occupancy, and ADR is crucial for maximizing your Airbnb profit potential in Rolante.
Seasonal Strategies for Maximizing Profit
- Peak Season: Maximize revenue through premium pricing and potentially longer minimum stays. Ensure high availability.
- Low Season: Offer competitive pricing, special promotions (e.g., extended stay discounts), and flexible cancellation policies. Target off-season travelers like remote workers or budget-conscious guests.
- Shoulder Seasons: Implement dynamic pricing that balances peak and low rates. Target weekend travelers or specific events. Offer slightly more flexible terms than peak season.
- Regularly analyze your own performance against these Rolante seasonality benchmarks and adjust your pricing and availability strategy accordingly.
Best Areas for Airbnb Investment in Rolante (2026)
Exploring the top neighborhoods for short-term rentals in Rolante? This section highlights key areas, outlining why they are attractive for hosts and guests, along with notable local attractions. Consider these locations based on your target guest profile and investment strategy.
| Neighborhood / Area | Why Host Here? (Target Guests & Appeal) | Key Attractions & Landmarks |
|---|---|---|
| Centro de Rolante | The heart of Rolante, offering easy access to local shops, services, and restaurants. A prime spot for those looking to explore the town and engage with local culture. | Rolante Municipal Museum, Catedral São João Batista, Parque Natural Municipal da Cascata, local artisan shops, café culture |
| Cascata do Figueira | A natural attraction featuring beautiful waterfalls and hiking trails. Ideal for nature lovers and those seeking outdoor activities, perfect for relaxation and adventure. | Cascata do Figueira, hiking trails, picnic areas, wildlife observation, natural swimming spots |
| Parque Natural de Rolante | This park offers picturesque landscapes and walking paths, making it a great place for families and nature enthusiasts. A peaceful getaway close to urban amenities. | walking trails, birdwatching, family picnic spots, community events, scenic views |
| Vale Verde | A tranquil area known for its scenic views and greenery, attracting visitors who enjoy rural settings and outdoor activities. Great for a quiet, nature-filled stay. | nature trails, local farms, stargazing spots, community festivals, artisanal markets |
| Serra do Rolante | A mountainous area providing breathtaking views and opportunities for outdoor adventures. Popular with those who love hiking and exploring nature. | hiking routes, scenic lookout points, camping areas, ecological tours, local flora and fauna |
| Caminho dos Antigos | A historical route with cultural significance, attracting those interested in the history and heritage of the region. Offers a unique cultural experience. | historic landmarks, traditional architecture, cultural festivals, art exhibitions, local cuisine |
| Linha São Paulo | A rural area near Rolante that offers a serene environment and beautiful landscapes, appealing to visitors seeking peace and tranquility away from urban life. | agricultural tours, nature exploration, local cuisine tastings, artisan crafts, festivals |
| Lagoa Grande | A larger community area with a lake that provides opportunities for fishing, boating, and relaxing by the water. Perfect for families looking for leisure activities. | boating activities, fishing spots, lakefront parks, community events, family-friendly facilities |
Understanding Airbnb License Requirements & STR Laws in Rolante (2026)
While Rolante, Rio Grande do Sul, Brazil currently shows low STR regulations, specific Airbnb license requirements might still exist or change. Always verify the latest short term rental regulations and Airbnb license requirements directly with local government authorities for Rolante to ensure full compliance before hosting.
(Source: AirROI data, 2026, finding no licensed listings among those analyzed)
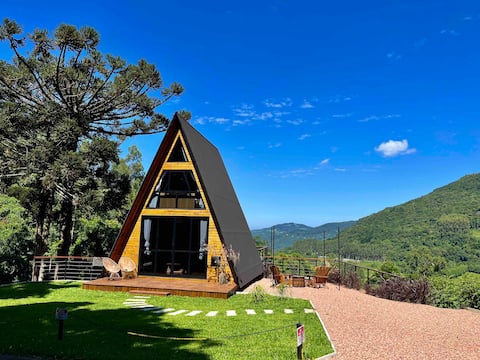
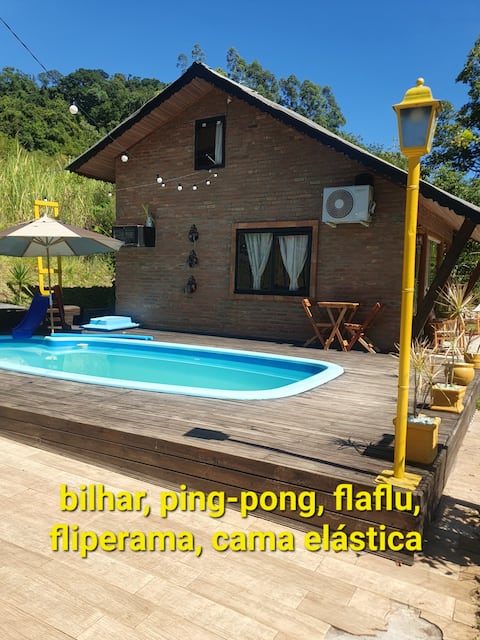
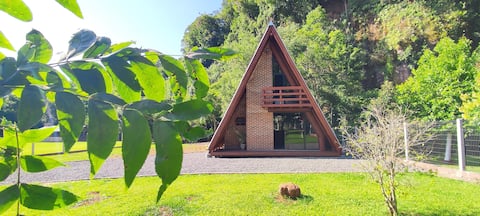
Top Performing Airbnb Properties in Rolante (2026)
Benchmark your potential! Explore examples of top-performing Airbnb properties in Rolantebased on Trailing Twelve Month (TTM) revenue. Analyze their characteristics, revenue, occupancy rate, and ADR to understand what drives success in this market.

Lot 11 | SUMMER HERE with two bathtubs and a view!
Entire Place • 1 bedroom
Charming, modern and cozy
Entire Place • 1 bedroom
Hummingbird's Song * Rolante/RS
Entire Place • 4 bedrooms
Água Branca Cabin
Entire Place • 2 bedrooms

Just you, a cabin, and a waterfall
Entire Place • 1 bedroom

Caminho das Pipas Cottage
Entire Place • 2 bedrooms
Note: Performance varies based on location, size, amenities, seasonality, and management quality. Data reflects the past 12 months.
Top Performing Airbnb Hosts in Rolante (2026)
Learn from the best! This table showcases top-performing Airbnb hosts in Rolante based on the number of properties managed and estimated total revenue over the past year. Analyze their scale and performance metrics.
| Host Name | Properties | Grossing Revenue | Stay Reviews | Avg Rating |
|---|---|---|---|---|
| Lizi | 1 | $27,915 | 20 | 4.95/5.0 |
| Leandro | 1 | $22,849 | 38 | 5.00/5.0 |
| Guta | 4 | $22,351 | 65 | 4.97/5.0 |
| Clademir & Barbara | 5 | $21,592 | 393 | 4.97/5.0 |
| Jessica Tais | 1 | $15,399 | 50 | 4.96/5.0 |
| Alceu João Lazzari | 2 | $12,136 | 109 | 4.97/5.0 |
| Lucas | 1 | $10,915 | 134 | 4.99/5.0 |
| Gabriel | 1 | $10,623 | 3 | 5.00/5.0 |
| Sirlei Maria | 1 | $9,862 | 117 | 5.00/5.0 |
| Pedro | 6 | $9,732 | 48 | 4.89/5.0 |
Analyzing the strategies of top hosts, such as their property selection, pricing, and guest communication, can offer valuable lessons for optimizing your own Airbnb operations in Rolante.
Dive Deeper: Advanced Rolante STR Market Data (2026)
Ready to unlock more insights? AirROI provides access to advanced metrics and comprehensive Airbnb data for Rolante. Explore detailed analytics beyond this report to refine your investment strategy, optimize pricing, and maximize your vacation rental profits.
Explore Advanced MetricsRolante Short-Term Rental Market Composition (2026): Property & Room Types
Room Type Distribution
Property Type Distribution
Market Composition Insights for Rolante
- The Rolante Airbnb market composition is heavily skewed towards Entire Home/Apt listings, which make up 93.8% of the 64 active rentals. This indicates strong guest preference for privacy and space.
- Looking at the property type distribution in Rolante, Outdoor/Unique properties are the most common (40.6%), reflecting the local real estate landscape.
- Houses represent a significant 39.1% portion, catering likely to families or larger groups.
- The presence of 9.4% Hotel/Boutique listings indicates integration with traditional hospitality.
- Smaller segments like others, apartment/condo, unique stays (combined 11.0%) offer potential for unique stay experiences.
Rolante Airbnb Room Capacity Analysis (2026): Bedroom Distribution
Distribution of Listings by Number of Bedrooms
Room Capacity Insights for Rolante
- The dominant room capacity in Rolante is 1 bedroom listings, making up 54.7% of the market. This suggests a strong demand for properties suitable for couples or solo travelers.
- Together, 1 bedroom and 2 bedrooms properties represent 79.7% of the active Airbnb listings in Rolante, indicating a high concentration in these sizes.
- With over half the market (54.7%) consisting of studios or 1-bedroom units, Rolante is particularly well-suited for individuals or couples.
- Listings with 3+ bedrooms (9.4%) represent a smaller niche, potentially indicating an underserved market for larger group accommodations in Rolante.
Rolante Vacation Rental Guest Capacity Trends (2026)
Distribution of Listings by Guest Capacity
Guest Capacity Insights for Rolante
- The most common guest capacity trend in Rolante vacation rentals is listings accommodating 2 guests (23.4%). This suggests the primary traveler segment is likely couples or solo travelers.
- Properties designed for 2 guests and 4 guests dominate the Rolante STR market, accounting for 43.7% of listings.
- 28.1% of properties accommodate 6+ guests, serving the market segment for larger families or group travel in Rolante.
- On average, properties in Rolante are equipped to host 3.9 guests.
Rolante Airbnb Booking Patterns (2026): Available vs. Booked Days
Available Days Distribution
Booked Days Distribution
Booking Pattern Insights for Rolante
- The most common availability pattern in Rolante falls within the 271-366 days range, representing 76.6% of listings. This suggests many properties have significant open periods on their calendars.
- Approximately 95.4% of listings show high availability (181+ days open annually), indicating potential for increased bookings or specific owner usage patterns.
- For booked days, the 1-30 days range is most frequent in Rolante (39.1%), reflecting common guest stay durations or potential owner blocking patterns.
- A notable 4.7% of properties secure long booking periods (181+ days booked per year), highlighting successful long-term rental strategies or significant owner usage.
Rolante Airbnb Minimum Stay Requirements Analysis
Distribution of Listings by Minimum Night Requirement
1 Night
33 listings
51.6% of total
2 Nights
21 listings
32.8% of total
30+ Nights
10 listings
15.6% of total
Key Insights
- The most prevalent minimum stay requirement in Rolante is 1 Night, adopted by 51.6% of listings. This highlights the market's preference for shorter, flexible bookings.
- A strong majority (84.4%) of the Rolante Airbnb data shows acceptance of very short stays (1-2 nights), indicating a dynamic, high-turnover market.
- A significant segment (15.6%) caters to monthly stays (30+ nights) in Rolante, pointing to opportunities in the extended-stay market.
Recommendations
- Align with the market by considering a 1 Night minimum stay, as 51.6% of Rolante hosts use this setting.
- Explore offering discounts for stays of 30+ nights to attract the 15.6% of the market seeking extended stays.
- Adjust minimum nights based on seasonality – potentially shorter during low season and longer during peak demand periods in Rolante.
Rolante Airbnb Cancellation Policy Trends Analysis (2026)
Limited
2 listings
3.1% of total
Flexible
17 listings
26.6% of total
Moderate
22 listings
34.4% of total
Firm
20 listings
31.3% of total
Strict
3 listings
4.7% of total
Cancellation Policy Insights for Rolante
- The prevailing Airbnb cancellation policy trend in Rolante is Moderate, used by 34.4% of listings.
- There's a relatively balanced mix between guest-friendly (61.0%) and stricter (36.0%) policies, offering choices for different guest needs.
- Strict cancellation policies are quite rare (4.7%), potentially making listings with this policy less competitive unless justified by high demand or property type.
Recommendations for Hosts
- Consider adopting a Moderate policy to align with the 34.4% market standard in Rolante.
- Using a Strict policy might deter some guests, as only 4.7% of listings use it. Evaluate if potential revenue protection outweighs possible lower booking rates.
- Regularly review your cancellation policy against competitors and market demand shifts in Rolante.
Rolante STR Booking Lead Time Analysis (2026)
Average Booking Lead Time by Month
Booking Lead Time Insights for Rolante
- The overall average booking lead time for vacation rentals in Rolante is 28 days.
- Guests book furthest in advance for stays during December (average 35 days), likely coinciding with peak travel demand or local events.
- The shortest booking windows occur for stays in July (average 17 days), indicating more last-minute travel plans during this time.
- Seasonally, Spring (32 days avg.) sees the longest lead times, while Fall (21 days avg.) has the shortest, reflecting typical travel planning cycles.
Recommendations for Hosts
- Use the overall average lead time (28 days) as a baseline for your pricing and availability strategy in Rolante.
- Target marketing efforts for the Spring season well in advance (at least 32 days) to capture early planners.
- Monitor your own booking lead times against these Rolante averages to identify opportunities for dynamic pricing adjustments.
Popular & Essential Airbnb Amenities in Rolante (2026)
Amenity Prevalence
Amenity Insights for Rolante
- Essential amenities in Rolante that guests expect include: Wifi. Lacking these (this) could significantly impact bookings.
- Popular amenities like Free parking on premises, Kitchen, TV are common but not universal. Offering these can provide a competitive edge.
Recommendations for Hosts
- Ensure your listing includes all essential amenities for Rolante: Wifi.
- Consider adding popular differentiators like Free parking on premises or Kitchen to increase appeal.
- Highlight unique or less common amenities you offer (e.g., hot tub, dedicated workspace, EV charger) in your listing description and photos.
- Regularly check competitor amenities in Rolante to stay competitive.
Rolante Airbnb Guest Demographics & Profile Analysis (2026)
Guest Profile Summary for Rolante
- The typical guest profile for Airbnb in Rolante consists of primarily domestic travelers (96%), often arriving from nearby Porto Alegre, typically belonging to the Post-2000s (Gen Z/Alpha) group (50%), primarily speaking Portuguese or English.
- Domestic travelers account for 96.4% of guests.
- Key international markets include Brazil (96.4%) and United States (0.9%).
- Top languages spoken are Portuguese (53.2%) followed by English (27%).
- A significant demographic segment is the Post-2000s (Gen Z/Alpha) group, representing 50% of guests.
Recommendations for Hosts
- Target domestic marketing efforts towards travelers from Porto Alegre and Rio Grande do Sul.
- Tailor amenities and listing descriptions to appeal to the dominant Post-2000s (Gen Z/Alpha) demographic (e.g., highlight fast WiFi, smart home features, local guides).
- Highlight unique local experiences or amenities relevant to the primary guest profile.
- Consider seasonal promotions aligned with peak travel times for key origin markets.
Nearby Short-Term Rental Market Comparison
How does the Rolante Airbnb market stack up against its neighbors? Compare key performance metrics like average monthly revenue, ADR, and occupancy rates in surrounding areas to understand the broader regional STR landscape.
| Market | Active Properties | Monthly Revenue | Daily Rate | Avg. Occupancy |
|---|---|---|---|---|
| Pinto Bandeira | 20 | $1,439 | $161.98 | 31% |
| Flores da Cunha | 16 | $891 | $71.27 | 44% |
| Linha Nova | 10 | $890 | $86.73 | 37% |
| Gramado | 3,177 | $778 | $93.36 | 36% |
| Monte Belo do Sul | 14 | $768 | $96.62 | 32% |
| Picada Café | 24 | $766 | $97.19 | 32% |
| Região Geográfica Imediata de Criciúma | 11 | $678 | $98.34 | 30% |
| Garibaldi | 66 | $672 | $90.05 | 30% |
| Santa Maria do Herval | 39 | $638 | $67.87 | 33% |
| Carlos Barbosa | 31 | $631 | $78.33 | 32% |