Pelotas Airbnb Market Analysis 2026: Short Term Rental Data & Vacation Rental Statistics in Rio Grande do Sul, Brazil
Is Airbnb profitable in Pelotas in 2026? Explore comprehensive Airbnb analytics for Pelotas, Rio Grande do Sul, Brazil to uncover income potential. This 2026 STR market report for Pelotas, based on AirROI data from February 2025 to January 2026, reveals key trends in the market of 561 active listings.
Whether you're considering an Airbnb investment in Pelotas, optimizing your existing vacation rental, or exploring rental arbitrage opportunities, understanding the Pelotas Airbnb data is crucial. Leveraging the low regulation environment is key to maximizing your short term rental income potential. Let's dive into the specifics.
Key Pelotas Airbnb Performance Metrics Overview
Monthly Airbnb Revenue Variations & Income Potential in Pelotas (2026)
Understanding the monthly revenue variations for Airbnb listings in Pelotas is key to maximizing your short term rental income potential. Seasonality significantly impacts earnings. Our analysis, based on data from the past 12 months, shows that the peak revenue month for STRs in Pelotas is typically December, while June often presents the lowest earnings, highlighting opportunities for strategic pricing adjustments during shoulder and low seasons. Explore the typical Airbnb income in Pelotas across different performance tiers:
- Best-in-class properties (Top 10%) achieve $757+ monthly, often utilizing dynamic pricing and superior guest experiences.
- Strong performing properties (Top 25%) earn $505 or more, indicating effective management and desirable locations/amenities.
- Typical properties (Median) generate around $286 per month, representing the average market performance.
- Entry-level properties (Bottom 25%) see earnings around $135, often with potential for optimization.
Average Monthly Airbnb Earnings Trend in Pelotas
Pelotas Airbnb Occupancy Rate Trends (2026)
Maximize your bookings by understanding the Pelotas STR occupancy trends. Seasonal demand shifts significantly influence how often properties are booked. Typically, Februarysees the highest demand (peak season occupancy), while September experiences the lowest (low season). Effective strategies, like adjusting minimum stays or offering promotions, can boost occupancy during slower periods. Here's how different property tiers perform in Pelotas:
- Best-in-class properties (Top 10%) achieve 72%+ occupancy, indicating high desirability and potentially optimized availability.
- Strong performing properties (Top 25%) maintain 52% or higher occupancy, suggesting good market fit and guest satisfaction.
- Typical properties (Median) have an occupancy rate around 30%.
- Entry-level properties (Bottom 25%) average 15% occupancy, potentially facing higher vacancy.
Average Monthly Occupancy Rate Trend in Pelotas
Average Daily Rate (ADR) Airbnb Trends in Pelotas (2026)
Effective short term rental pricing strategy in Pelotas involves understanding monthly ADR fluctuations. The Average Daily Rate (ADR) for Airbnb in Pelotas typically peaks in January and dips lowest during April. Leveraging Airbnb dynamic pricing tools or strategies based on this seasonality can significantly boost revenue. Here's a look at the typical nightly rates achieved:
- Best-in-class properties (Top 10%) command rates of $56+ per night, often due to premium features or locations.
- Strong performing properties (Top 25%) achieve nightly rates of $39 or more.
- Typical properties (Median) charge around $29 per night.
- Entry-level properties (Bottom 25%) earn around $21 per night.
Average Daily Rate (ADR) Trend by Month in Pelotas
Get Live Pelotas Market Intelligence 👇

Explore Real-time Analytics
Airbnb Seasonality Analysis & Trends in Pelotas (2026)
Peak Season (December, January, February)
- Revenue averages $490 per month
- Occupancy rates average 39.9%
- Daily rates average $37
Shoulder Season
- Revenue averages $371 per month
- Occupancy maintains around 34.3%
- Daily rates hold near $35
Low Season (April, May, June)
- Revenue drops to average $316 per month
- Occupancy decreases to average 32.5%
- Daily rates adjust to average $33
Seasonality Insights for Pelotas
- The Airbnb seasonality in Pelotas shows moderate seasonality with distinct peak and low periods. While the sections above show seasonal averages, it's also insightful to look at the extremes:
- During the high season, the absolute peak month showcases Pelotas's highest earning potential, with monthly revenues capable of climbing to $531, occupancy reaching a high of 45.4%, and ADRs peaking at $39.
- Conversely, the slowest single month of the year, typically falling within the low season, marks the market's lowest point. In this month, revenue might dip to $312, occupancy could drop to 29.4%, and ADRs may adjust down to $32.
- Understanding both the seasonal averages and these monthly peaks and troughs in revenue, occupancy, and ADR is crucial for maximizing your Airbnb profit potential in Pelotas.
Seasonal Strategies for Maximizing Profit
- Peak Season: Maximize revenue through premium pricing and potentially longer minimum stays. Ensure high availability.
- Low Season: Offer competitive pricing, special promotions (e.g., extended stay discounts), and flexible cancellation policies. Target off-season travelers like remote workers or budget-conscious guests.
- Shoulder Seasons: Implement dynamic pricing that balances peak and low rates. Target weekend travelers or specific events. Offer slightly more flexible terms than peak season.
- Regularly analyze your own performance against these Pelotas seasonality benchmarks and adjust your pricing and availability strategy accordingly.
Best Areas for Airbnb Investment in Pelotas (2026)
Exploring the top neighborhoods for short-term rentals in Pelotas? This section highlights key areas, outlining why they are attractive for hosts and guests, along with notable local attractions. Consider these locations based on your target guest profile and investment strategy.
| Neighborhood / Area | Why Host Here? (Target Guests & Appeal) | Key Attractions & Landmarks |
|---|---|---|
| Centro | The heart of Pelotas, offering historic architecture and a vibrant market scene. Ideal for guests wanting to experience local culture and accessibility to various amenities. | Pelotas Historic Centre, Pelotas Market, Marechal Floriano Peixoto Square, Navegantes Beach |
| Redenção | A charming neighborhood known for its parks and green spaces. Popular with families and travelers seeking a quieter atmosphere while still being close to the city center. | Redenção Park, Museu do Doce, Catedral São Francisco de Paula, Teatro Sete de Abril |
| São Gonçalo | Proximity to the coast and popular beach areas, ideal for those looking to swim and relax. Attracts tourists during summer months seeking seaside relaxation. | Praia do Laranjal, Parque Natural Morro de São Bento, Caminho do Mar, Igreja São Gonçalo do Amarante |
| Navegantes | A coastal area that appeals to beachgoers and water sports enthusiasts. Offers a laid-back vibe ideal for those wanting sun and sand. | Navegantes Beach, Caminho do Sol, Café do Mercado, Ilha das Pedras Brancas |
| Pontal | Features beautiful scenic views and is popular among tourists interested in nature and outdoor activities such as hiking and birdwatching. | Pontal da Barra, Parque da Lagoa, Praia do Pontal, Mirante do Pontal |
| Três Vendas | A local residential area with a friendly atmosphere. Suitable for visitors looking for a more authentic Brazilian neighborhood experience. | Candeia Square, Local Markets, Cultural Centers, Nearby Parks |
| Laranjal | Known for its beach life and recreational areas. Popular for summer vacations due to its family-friendly vibe and leisure opportunities. | Laranjal Beach, Promenade Along the Coast, Beachside Restaurants, Water Sports Rentals |
| São João | A burgeoning area with new developments attracting visitors interested in modern amenities and urban living experiences in Pelotas. | Shopping Pelotas, Cultural Events, Future Park Developments, Local Dining |
Understanding Airbnb License Requirements & STR Laws in Pelotas (2026)
While Pelotas, Rio Grande do Sul, Brazil currently shows low STR regulations, specific Airbnb license requirements might still exist or change. Always verify the latest short term rental regulations and Airbnb license requirements directly with local government authorities for Pelotas to ensure full compliance before hosting.
(Source: AirROI data, 2026, finding no licensed listings among those analyzed)
Top Performing Airbnb Properties in Pelotas (2026)
Benchmark your potential! Explore examples of top-performing Airbnb properties in Pelotasbased on Trailing Twelve Month (TTM) revenue. Analyze their characteristics, revenue, occupancy rate, and ADR to understand what drives success in this market.

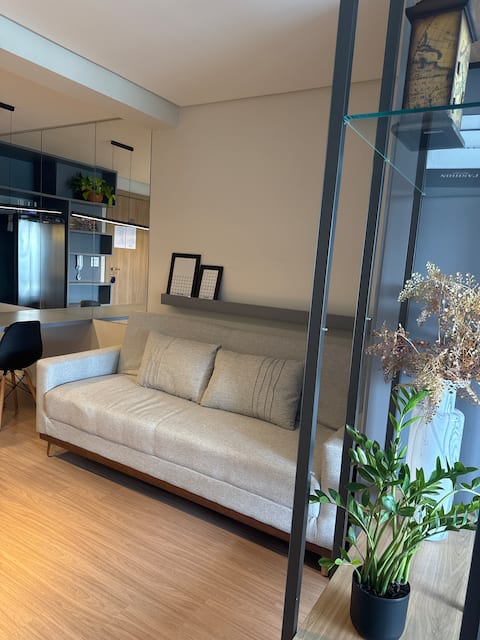
Modern House with Jacuzzi & Pool Near the Lagoon
Entire Place • 3 bedrooms
Flow Live Loft, Parque Una. With fireplace and garage
Entire Place • 1 bedroom
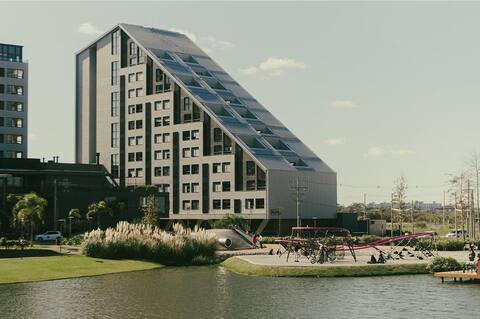
Flow Loft Parque Una with garage.
Entire Place • 1 bedroom
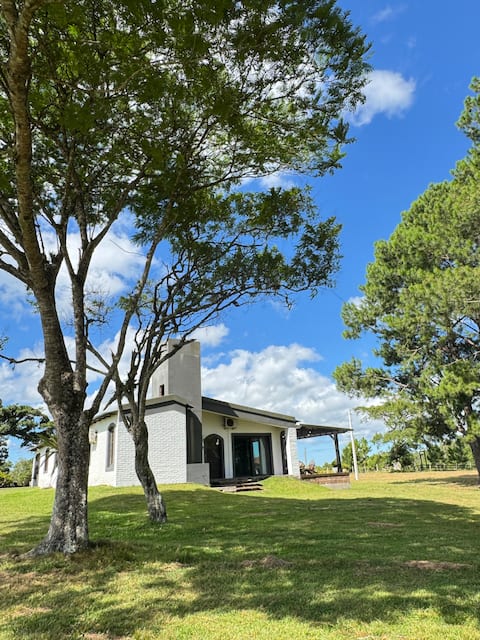
Landhaus Refuge, your country house.
Entire Place • 4 bedrooms
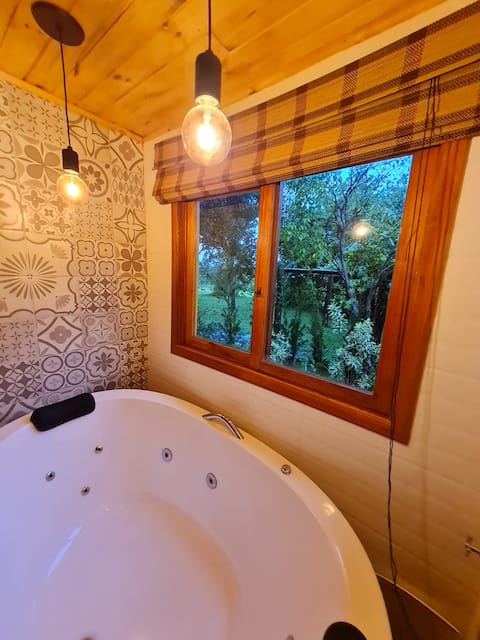
Sítio Mariluz - Pumpkin House
Entire Place • 2 bedrooms

New, Central, with Garage and Swimming Pool!
Entire Place • 2 bedrooms
Note: Performance varies based on location, size, amenities, seasonality, and management quality. Data reflects the past 12 months.
Top Performing Airbnb Hosts in Pelotas (2026)
Learn from the best! This table showcases top-performing Airbnb hosts in Pelotas based on the number of properties managed and estimated total revenue over the past year. Analyze their scale and performance metrics.
| Host Name | Properties | Grossing Revenue | Stay Reviews | Avg Rating |
|---|---|---|---|---|
| Carolina | 54 | $113,252 | 1376 | 4.91/5.0 |
| Waleska | 2 | $74,293 | 262 | 4.93/5.0 |
| Arturo Carrasco | 11 | $72,965 | 2082 | 4.92/5.0 |
| Gustavo | 1 | $42,737 | 57 | 4.93/5.0 |
| Gabriel | 4 | $33,331 | 436 | 4.95/5.0 |
| Fernanda | 10 | $31,978 | 594 | 4.90/5.0 |
| André | 1 | $26,660 | 45 | 5.00/5.0 |
| Zeno | 7 | $25,804 | 282 | 4.91/5.0 |
| Antonio | 2 | $24,687 | 186 | 4.93/5.0 |
| Lipe | 4 | $22,917 | 901 | 4.97/5.0 |
Analyzing the strategies of top hosts, such as their property selection, pricing, and guest communication, can offer valuable lessons for optimizing your own Airbnb operations in Pelotas.
Dive Deeper: Advanced Pelotas STR Market Data (2026)
Ready to unlock more insights? AirROI provides access to advanced metrics and comprehensive Airbnb data for Pelotas. Explore detailed analytics beyond this report to refine your investment strategy, optimize pricing, and maximize your vacation rental profits.
Explore Advanced MetricsPelotas Short-Term Rental Market Composition (2026): Property & Room Types
Room Type Distribution
Property Type Distribution
Market Composition Insights for Pelotas
- The Pelotas Airbnb market composition is heavily skewed towards Entire Home/Apt listings, which make up 93.4% of the 561 active rentals. This indicates strong guest preference for privacy and space.
- Looking at the property type distribution in Pelotas, Apartment/Condo properties are the most common (75.6%), reflecting the local real estate landscape.
- Houses represent a significant 20.3% portion, catering likely to families or larger groups.
- Smaller segments like hotel/boutique, outdoor/unique, unique stays, others (combined 4.1%) offer potential for unique stay experiences.
Pelotas Airbnb Room Capacity Analysis (2026): Bedroom Distribution
Distribution of Listings by Number of Bedrooms
Room Capacity Insights for Pelotas
- The dominant room capacity in Pelotas is 1 bedroom listings, making up 48.8% of the market. This suggests a strong demand for properties suitable for couples or solo travelers.
- Together, 1 bedroom and 2 bedrooms properties represent 83.7% of the active Airbnb listings in Pelotas, indicating a high concentration in these sizes.
- Listings with 3+ bedrooms (7.7%) represent a smaller niche, potentially indicating an underserved market for larger group accommodations in Pelotas.
Pelotas Vacation Rental Guest Capacity Trends (2026)
Distribution of Listings by Guest Capacity
Guest Capacity Insights for Pelotas
- The most common guest capacity trend in Pelotas vacation rentals is listings accommodating 4 guests (32.1%). This suggests the primary traveler segment is likely small families or groups.
- Properties designed for 4 guests and 2 guests dominate the Pelotas STR market, accounting for 57.6% of listings.
- 14.7% of properties accommodate 6+ guests, serving the market segment for larger families or group travel in Pelotas.
- On average, properties in Pelotas are equipped to host 3.6 guests.
Pelotas Airbnb Booking Patterns (2026): Available vs. Booked Days
Available Days Distribution
Booked Days Distribution
Booking Pattern Insights for Pelotas
- The most common availability pattern in Pelotas falls within the 271-366 days range, representing 62% of listings. This suggests many properties have significant open periods on their calendars.
- Approximately 89.5% of listings show high availability (181+ days open annually), indicating potential for increased bookings or specific owner usage patterns.
- For booked days, the 31-90 days range is most frequent in Pelotas (36%), reflecting common guest stay durations or potential owner blocking patterns.
- A notable 11.4% of properties secure long booking periods (181+ days booked per year), highlighting successful long-term rental strategies or significant owner usage.
Pelotas Airbnb Minimum Stay Requirements Analysis
Distribution of Listings by Minimum Night Requirement
1 Night
286 listings
51% of total
2 Nights
125 listings
22.3% of total
3 Nights
34 listings
6.1% of total
4-6 Nights
10 listings
1.8% of total
7-29 Nights
2 listings
0.4% of total
30+ Nights
104 listings
18.5% of total
Key Insights
- The most prevalent minimum stay requirement in Pelotas is 1 Night, adopted by 51% of listings. This highlights the market's preference for shorter, flexible bookings.
- A strong majority (73.3%) of the Pelotas Airbnb data shows acceptance of very short stays (1-2 nights), indicating a dynamic, high-turnover market.
- A significant segment (18.5%) caters to monthly stays (30+ nights) in Pelotas, pointing to opportunities in the extended-stay market.
Recommendations
- Align with the market by considering a 1 Night minimum stay, as 51% of Pelotas hosts use this setting.
- Explore offering discounts for stays of 30+ nights to attract the 18.5% of the market seeking extended stays.
- Adjust minimum nights based on seasonality – potentially shorter during low season and longer during peak demand periods in Pelotas.
Pelotas Airbnb Cancellation Policy Trends Analysis (2026)
Limited
3 listings
0.5% of total
Non-refundable
2 listings
0.4% of total
Super Strict 60 Days
4 listings
0.7% of total
Flexible
200 listings
35.7% of total
Moderate
237 listings
42.3% of total
Firm
96 listings
17.1% of total
Strict
18 listings
3.2% of total
Cancellation Policy Insights for Pelotas
- The prevailing Airbnb cancellation policy trend in Pelotas is Moderate, used by 42.3% of listings.
- The market strongly favors guest-friendly terms, with 78.0% of listings offering Flexible or Moderate policies. This suggests guests in Pelotas may expect booking flexibility.
- Strict cancellation policies are quite rare (3.2%), potentially making listings with this policy less competitive unless justified by high demand or property type.
Recommendations for Hosts
- Consider adopting a Moderate policy to align with the 42.3% market standard in Pelotas.
- Using a Strict policy might deter some guests, as only 3.2% of listings use it. Evaluate if potential revenue protection outweighs possible lower booking rates.
- Regularly review your cancellation policy against competitors and market demand shifts in Pelotas.
Pelotas STR Booking Lead Time Analysis (2026)
Average Booking Lead Time by Month
Booking Lead Time Insights for Pelotas
- The overall average booking lead time for vacation rentals in Pelotas is 17 days.
- Guests book furthest in advance for stays during December (average 28 days), likely coinciding with peak travel demand or local events.
- The shortest booking windows occur for stays in June (average 11 days), indicating more last-minute travel plans during this time.
- Seasonally, Winter (21 days avg.) sees the longest lead times, while Spring (13 days avg.) has the shortest, reflecting typical travel planning cycles.
Recommendations for Hosts
- Use the overall average lead time (17 days) as a baseline for your pricing and availability strategy in Pelotas.
- For December stays, consider implementing length-of-stay discounts or slightly higher rates for bookings made less than 28 days out to capitalize on advance planning.
- Target marketing efforts for the Winter season well in advance (at least 21 days) to capture early planners.
- Monitor your own booking lead times against these Pelotas averages to identify opportunities for dynamic pricing adjustments.
Popular & Essential Airbnb Amenities in Pelotas (2026)
Amenity Prevalence
Amenity Insights for Pelotas
- Essential amenities in Pelotas that guests expect include: Kitchen, Wifi, TV. Lacking these (any) could significantly impact bookings.
- Popular amenities like Air conditioning, Dishes and silverware, Refrigerator are common but not universal. Offering these can provide a competitive edge.
Recommendations for Hosts
- Ensure your listing includes all essential amenities for Pelotas: Kitchen, Wifi, TV.
- Prioritize adding missing essentials: Kitchen, Wifi, TV.
- Consider adding popular differentiators like Air conditioning or Dishes and silverware to increase appeal.
- Highlight unique or less common amenities you offer (e.g., hot tub, dedicated workspace, EV charger) in your listing description and photos.
- Regularly check competitor amenities in Pelotas to stay competitive.
Pelotas Airbnb Guest Demographics & Profile Analysis (2026)
Guest Profile Summary for Pelotas
- The typical guest profile for Airbnb in Pelotas consists of primarily domestic travelers (87%), often arriving from nearby Rio Grande do Sul, typically belonging to the Post-2000s (Gen Z/Alpha) group (50%), primarily speaking Portuguese or English.
- Domestic travelers account for 86.7% of guests.
- Key international markets include Brazil (86.7%) and Uruguay (9.2%).
- Top languages spoken are Portuguese (44%) followed by English (25.6%).
- A significant demographic segment is the Post-2000s (Gen Z/Alpha) group, representing 50% of guests.
Recommendations for Hosts
- Target domestic marketing efforts towards travelers from Rio Grande do Sul and Porto Alegre.
- Tailor amenities and listing descriptions to appeal to the dominant Post-2000s (Gen Z/Alpha) demographic (e.g., highlight fast WiFi, smart home features, local guides).
- Highlight unique local experiences or amenities relevant to the primary guest profile.
- Consider seasonal promotions aligned with peak travel times for key origin markets.
Nearby Short-Term Rental Market Comparison
How does the Pelotas Airbnb market stack up against its neighbors? Compare key performance metrics like average monthly revenue, ADR, and occupancy rates in surrounding areas to understand the broader regional STR landscape.
| Market | Active Properties | Monthly Revenue | Daily Rate | Avg. Occupancy |
|---|---|---|---|---|
| Lago Merín | 11 | $538 | $84.18 | 31% |
| Eldorado do Sul | 14 | $515 | $97.88 | 23% |
| Porto Alegre | 3,054 | $384 | $44.48 | 40% |
| Morro Redondo | 21 | $327 | $65.96 | 21% |
| Camaquã | 11 | $265 | $42.00 | 34% |
| Rio Grande | 412 | $239 | $59.59 | 27% |
| Tapes | 17 | $224 | $65.14 | 21% |
| Cachoeira do Sul | 56 | $222 | $28.46 | 31% |
| Arambaré | 43 | $221 | $56.87 | 27% |
| Pantano Grande | 18 | $197 | $70.81 | 28% |