Osório Airbnb Market Analysis 2026: Short Term Rental Data & Vacation Rental Statistics in Rio Grande do Sul, Brazil
Is Airbnb profitable in Osório in 2026? Explore comprehensive Airbnb analytics for Osório, Rio Grande do Sul, Brazil to uncover income potential. This 2026 STR market report for Osório, based on AirROI data from February 2025 to January 2026, reveals key trends in the niche market of 181 active listings.
Whether you're considering an Airbnb investment in Osório, optimizing your existing vacation rental, or exploring rental arbitrage opportunities, understanding the Osório Airbnb data is crucial. Leveraging the low regulation environment is key to maximizing your short term rental income potential. Let's dive into the specifics.
Key Osório Airbnb Performance Metrics Overview
Monthly Airbnb Revenue Variations & Income Potential in Osório (2026)
Understanding the monthly revenue variations for Airbnb listings in Osório is key to maximizing your short term rental income potential. Seasonality significantly impacts earnings. Our analysis, based on data from the past 12 months, shows that the peak revenue month for STRs in Osório is typically January, while September often presents the lowest earnings, highlighting opportunities for strategic pricing adjustments during shoulder and low seasons. Explore the typical Airbnb income in Osório across different performance tiers:
- Best-in-class properties (Top 10%) achieve $1,857+ monthly, often utilizing dynamic pricing and superior guest experiences.
- Strong performing properties (Top 25%) earn $998 or more, indicating effective management and desirable locations/amenities.
- Typical properties (Median) generate around $423 per month, representing the average market performance.
- Entry-level properties (Bottom 25%) see earnings around $188, often with potential for optimization.
Average Monthly Airbnb Earnings Trend in Osório
Osório Airbnb Occupancy Rate Trends (2026)
Maximize your bookings by understanding the Osório STR occupancy trends. Seasonal demand shifts significantly influence how often properties are booked. Typically, Februarysees the highest demand (peak season occupancy), while September experiences the lowest (low season). Effective strategies, like adjusting minimum stays or offering promotions, can boost occupancy during slower periods. Here's how different property tiers perform in Osório:
- Best-in-class properties (Top 10%) achieve 67%+ occupancy, indicating high desirability and potentially optimized availability.
- Strong performing properties (Top 25%) maintain 39% or higher occupancy, suggesting good market fit and guest satisfaction.
- Typical properties (Median) have an occupancy rate around 19%.
- Entry-level properties (Bottom 25%) average 9% occupancy, potentially facing higher vacancy.
Average Monthly Occupancy Rate Trend in Osório
Average Daily Rate (ADR) Airbnb Trends in Osório (2026)
Effective short term rental pricing strategy in Osório involves understanding monthly ADR fluctuations. The Average Daily Rate (ADR) for Airbnb in Osório typically peaks in January and dips lowest during April. Leveraging Airbnb dynamic pricing tools or strategies based on this seasonality can significantly boost revenue. Here's a look at the typical nightly rates achieved:
- Best-in-class properties (Top 10%) command rates of $172+ per night, often due to premium features or locations.
- Strong performing properties (Top 25%) achieve nightly rates of $111 or more.
- Typical properties (Median) charge around $73 per night.
- Entry-level properties (Bottom 25%) earn around $49 per night.
Average Daily Rate (ADR) Trend by Month in Osório
Get Live Osório Market Intelligence 👇

Explore Real-time Analytics
Airbnb Seasonality Analysis & Trends in Osório (2026)
Peak Season (January, February, December)
- Revenue averages $1,000 per month
- Occupancy rates average 34.0%
- Daily rates average $100
Shoulder Season
- Revenue averages $704 per month
- Occupancy maintains around 26.8%
- Daily rates hold near $92
Low Season (June, September, October)
- Revenue drops to average $583 per month
- Occupancy decreases to average 22.1%
- Daily rates adjust to average $94
Seasonality Insights for Osório
- The Airbnb seasonality in Osório shows highly seasonal trends requiring careful strategy. While the sections above show seasonal averages, it's also insightful to look at the extremes:
- During the high season, the absolute peak month showcases Osório's highest earning potential, with monthly revenues capable of climbing to $1,079, occupancy reaching a high of 40.3%, and ADRs peaking at $106.
- Conversely, the slowest single month of the year, typically falling within the low season, marks the market's lowest point. In this month, revenue might dip to $540, occupancy could drop to 21.4%, and ADRs may adjust down to $88.
- Understanding both the seasonal averages and these monthly peaks and troughs in revenue, occupancy, and ADR is crucial for maximizing your Airbnb profit potential in Osório.
Seasonal Strategies for Maximizing Profit
- Peak Season: Maximize revenue through premium pricing and potentially longer minimum stays. Ensure high availability.
- Low Season: Offer competitive pricing, special promotions (e.g., extended stay discounts), and flexible cancellation policies. Target off-season travelers like remote workers or budget-conscious guests.
- Shoulder Seasons: Implement dynamic pricing that balances peak and low rates. Target weekend travelers or specific events. Offer slightly more flexible terms than peak season.
- Regularly analyze your own performance against these Osório seasonality benchmarks and adjust your pricing and availability strategy accordingly.
Best Areas for Airbnb Investment in Osório (2026)
Exploring the top neighborhoods for short-term rentals in Osório? This section highlights key areas, outlining why they are attractive for hosts and guests, along with notable local attractions. Consider these locations based on your target guest profile and investment strategy.
| Neighborhood / Area | Why Host Here? (Target Guests & Appeal) | Key Attractions & Landmarks |
|---|---|---|
| Praia do Aventureiro | A beautiful beach known for its stunning landscapes and warm waters. It's popular among tourists seeking relaxation and adventure activities like surfing and hiking. | Cascata de Aventura, Praia do Leste, Trilha dos Moinhos |
| Centro de Osório | The city center offers a variety of shops, restaurants, and cultural activities, making it a convenient place for visitors. It's also home to local events and festivals. | Igreja Matriz de Nossa Senhora da Conceição, Parque da Estação, Museu de Osório |
| Praia de Capão da Canoa | A neighboring beach destination that attracts many summer tourists, offering vibrant nightlife, beachfront dining, and numerous beach activities. | Praia de Capão da Canoa, Vila de Capão, Praça do Farol |
| Praia de Torres | Known for its beautiful cliffs, surfing spots, and charming town atmosphere. It's ideal for those looking for scenic beauty and outdoor activities. | Parque do Morro do Farol, Praia do Meio, Praia do Cal Beach |
| Praia de Mostardas | A quieter beach destination that is perfect for those seeking tranquility, with beautiful natural scenery and opportunities for wildlife observation. | Reserva Natural do Fundo da Lagoa, Praia do Tainhas, Dunas da Lagoa |
| Caminhos do Vinho (Wine Routes) | A region famous for its vineyards, attracting visitors interested in wine tasting and agricultural tourism, with beautiful landscapes. | Vinícolas locais, Rota do Vinho, Eventos gastronômicos |
| Praia de Arambaré | A picturesque beach with calm waters, perfect for families and those looking to spend a peaceful day by the sea, with local seafood restaurants. | Praia de Arambaré, Lagoa do Arambaré, Restaurantes de frutos do mar |
| Sítio do Pica-Pau | An eco-tourism spot offering rustic accommodations and nature experiences, ideal for travelers looking to connect with nature and escape the city. | Caminhadas na natureza, Observação de aves, Atividades rurais |
Understanding Airbnb License Requirements & STR Laws in Osório (2026)
While Osório, Rio Grande do Sul, Brazil currently shows low STR regulations, specific Airbnb license requirements might still exist or change. Always verify the latest short term rental regulations and Airbnb license requirements directly with local government authorities for Osório to ensure full compliance before hosting.
(Source: AirROI data, 2026, based on 1% licensed listings)
Top Performing Airbnb Properties in Osório (2026)
Benchmark your potential! Explore examples of top-performing Airbnb properties in Osóriobased on Trailing Twelve Month (TTM) revenue. Analyze their characteristics, revenue, occupancy rate, and ADR to understand what drives success in this market.
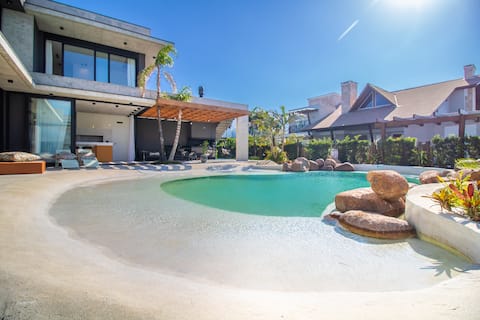
Amazing house with spa and private artificial beach!
Entire Place • 4 bedrooms
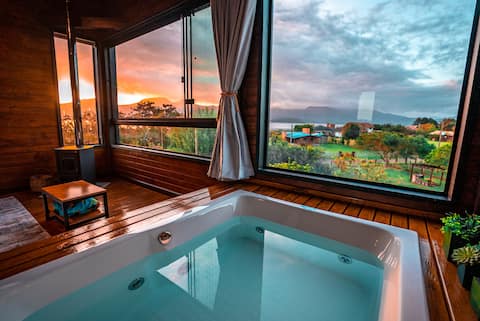
Atalaia da Pinguela - Couple tower overlooking the lake
Entire Place • 1 bedroom
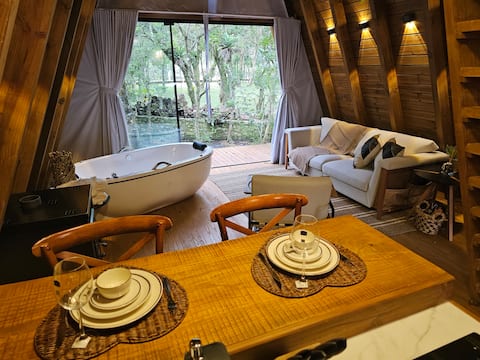
Cabin with breakfast and hydro.
Entire Place • 1 bedroom
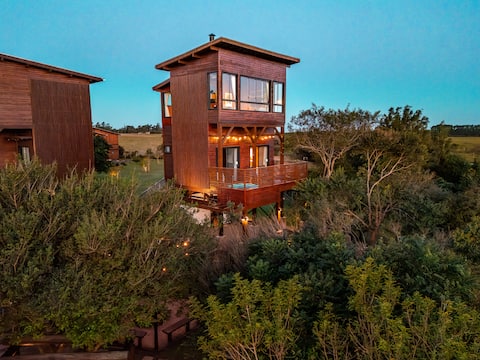
Atalaia da Pinguela - Tower with panoramic view of the lagoon
Entire Place • 2 bedrooms

Portal das Montanhas House Spa House - Alto do Morro
Entire Place • 1 bedroom
Atalaia da Pinguela | Lake View Cabin 2
Entire Place • 1 bedroom
Note: Performance varies based on location, size, amenities, seasonality, and management quality. Data reflects the past 12 months.
Top Performing Airbnb Hosts in Osório (2026)
Learn from the best! This table showcases top-performing Airbnb hosts in Osório based on the number of properties managed and estimated total revenue over the past year. Analyze their scale and performance metrics.
| Host Name | Properties | Grossing Revenue | Stay Reviews | Avg Rating |
|---|---|---|---|---|
| Rafael | 8 | $151,733 | 1647 | 4.90/5.0 |
| Samuel | 1 | $50,689 | 55 | 4.91/5.0 |
| Diego | 2 | $44,018 | 152 | 4.93/5.0 |
| Viviani | 6 | $22,870 | 80 | 4.45/5.0 |
| Giovano | 1 | $22,311 | 148 | 4.91/5.0 |
| Sergio | 1 | $18,946 | 77 | 4.99/5.0 |
| Gibran | 1 | $14,217 | 6 | 5.00/5.0 |
| Jairo | 1 | $14,053 | 38 | 5.00/5.0 |
| Silvana | 1 | $12,975 | 38 | 4.97/5.0 |
| Regina | 1 | $12,444 | 19 | 4.84/5.0 |
Analyzing the strategies of top hosts, such as their property selection, pricing, and guest communication, can offer valuable lessons for optimizing your own Airbnb operations in Osório.
Dive Deeper: Advanced Osório STR Market Data (2026)
Ready to unlock more insights? AirROI provides access to advanced metrics and comprehensive Airbnb data for Osório. Explore detailed analytics beyond this report to refine your investment strategy, optimize pricing, and maximize your vacation rental profits.
Explore Advanced MetricsOsório Short-Term Rental Market Composition (2026): Property & Room Types
Room Type Distribution
Property Type Distribution
Market Composition Insights for Osório
- The Osório Airbnb market composition is heavily skewed towards Entire Home/Apt listings, which make up 96.1% of the 181 active rentals. This indicates strong guest preference for privacy and space.
- Looking at the property type distribution in Osório, House properties are the most common (65.2%), reflecting the local real estate landscape.
- Houses represent a significant 65.2% portion, catering likely to families or larger groups.
- Smaller segments like hotel/boutique, unique stays (combined 6.1%) offer potential for unique stay experiences.
Osório Airbnb Room Capacity Analysis (2026): Bedroom Distribution
Distribution of Listings by Number of Bedrooms
Room Capacity Insights for Osório
- The dominant room capacity in Osório is 2 bedrooms listings, making up 30.4% of the market. This suggests a strong demand for properties suitable for couples or solo travelers.
- Together, 2 bedrooms and 1 bedroom properties represent 56.4% of the active Airbnb listings in Osório, indicating a high concentration in these sizes.
- A significant 37.6% of listings offer 3+ bedrooms, catering to larger groups and families seeking more space in Osório.
Osório Vacation Rental Guest Capacity Trends (2026)
Distribution of Listings by Guest Capacity
Guest Capacity Insights for Osório
- The most common guest capacity trend in Osório vacation rentals is listings accommodating 8+ guests (29.3%). This suggests the primary traveler segment is likely larger groups.
- Properties designed for 8+ guests and 6 guests dominate the Osório STR market, accounting for 48.6% of listings.
- 54.7% of properties accommodate 6+ guests, serving the market segment for larger families or group travel in Osório.
- On average, properties in Osório are equipped to host 5.3 guests.
Osório Airbnb Booking Patterns (2026): Available vs. Booked Days
Available Days Distribution
Booked Days Distribution
Booking Pattern Insights for Osório
- The most common availability pattern in Osório falls within the 271-366 days range, representing 86.7% of listings. This suggests many properties have significant open periods on their calendars.
- Approximately 94.4% of listings show high availability (181+ days open annually), indicating potential for increased bookings or specific owner usage patterns.
- For booked days, the 1-30 days range is most frequent in Osório (46.4%), reflecting common guest stay durations or potential owner blocking patterns.
- A notable 5.6% of properties secure long booking periods (181+ days booked per year), highlighting successful long-term rental strategies or significant owner usage.
Osório Airbnb Minimum Stay Requirements Analysis
Distribution of Listings by Minimum Night Requirement
1 Night
66 listings
36.5% of total
2 Nights
24 listings
13.3% of total
3 Nights
10 listings
5.5% of total
4-6 Nights
28 listings
15.5% of total
7-29 Nights
3 listings
1.7% of total
30+ Nights
50 listings
27.6% of total
Key Insights
- The most prevalent minimum stay requirement in Osório is 1 Night, adopted by 36.5% of listings. This highlights the market's preference for shorter, flexible bookings.
- A significant segment (27.6%) caters to monthly stays (30+ nights) in Osório, pointing to opportunities in the extended-stay market.
Recommendations
- Align with the market by considering a 1 Night minimum stay, as 36.5% of Osório hosts use this setting.
- Explore offering discounts for stays of 30+ nights to attract the 27.6% of the market seeking extended stays.
- Adjust minimum nights based on seasonality – potentially shorter during low season and longer during peak demand periods in Osório.
Osório Airbnb Cancellation Policy Trends Analysis (2026)
Limited
3 listings
1.7% of total
Super Strict 30 Days
1 listings
0.6% of total
Flexible
50 listings
27.8% of total
Moderate
56 listings
31.1% of total
Firm
62 listings
34.4% of total
Strict
8 listings
4.4% of total
Cancellation Policy Insights for Osório
- The prevailing Airbnb cancellation policy trend in Osório is Firm, used by 34.4% of listings.
- There's a relatively balanced mix between guest-friendly (58.9%) and stricter (38.8%) policies, offering choices for different guest needs.
- Strict cancellation policies are quite rare (4.4%), potentially making listings with this policy less competitive unless justified by high demand or property type.
Recommendations for Hosts
- Consider adopting a Firm policy to align with the 34.4% market standard in Osório.
- Using a Strict policy might deter some guests, as only 4.4% of listings use it. Evaluate if potential revenue protection outweighs possible lower booking rates.
- Regularly review your cancellation policy against competitors and market demand shifts in Osório.
Osório STR Booking Lead Time Analysis (2026)
Average Booking Lead Time by Month
Booking Lead Time Insights for Osório
- The overall average booking lead time for vacation rentals in Osório is 26 days.
- Guests book furthest in advance for stays during December (average 41 days), likely coinciding with peak travel demand or local events.
- The shortest booking windows occur for stays in June (average 10 days), indicating more last-minute travel plans during this time.
- Seasonally, Winter (34 days avg.) sees the longest lead times, while Summer (13 days avg.) has the shortest, reflecting typical travel planning cycles.
Recommendations for Hosts
- Use the overall average lead time (26 days) as a baseline for your pricing and availability strategy in Osório.
- For December stays, consider implementing length-of-stay discounts or slightly higher rates for bookings made less than 41 days out to capitalize on advance planning.
- During June, focus on last-minute booking availability and promotions, as guests book with very short notice (10 days avg.).
- Target marketing efforts for the Winter season well in advance (at least 34 days) to capture early planners.
- Monitor your own booking lead times against these Osório averages to identify opportunities for dynamic pricing adjustments.
Popular & Essential Airbnb Amenities in Osório (2026)
Amenity Prevalence
Amenity Insights for Osório
- Popular amenities like Wifi, Kitchen, Free parking on premises are common but not universal. Offering these can provide a competitive edge.
- Warning: Wifi is not universally provided but is considered essential globally. Ensure reliable Wifi is offered.
Recommendations for Hosts
- Consider adding popular differentiators like Wifi or Kitchen to increase appeal.
- Highlight unique or less common amenities you offer (e.g., hot tub, dedicated workspace, EV charger) in your listing description and photos.
- Regularly check competitor amenities in Osório to stay competitive.
Osório Airbnb Guest Demographics & Profile Analysis (2026)
Guest Profile Summary for Osório
- The typical guest profile for Airbnb in Osório consists of primarily domestic travelers (91%), often arriving from nearby Porto Alegre, typically belonging to the Post-2000s (Gen Z/Alpha) group (50%), primarily speaking Portuguese or English.
- Domestic travelers account for 90.5% of guests.
- Key international markets include Brazil (90.5%) and Argentina (4.4%).
- Top languages spoken are Portuguese (47.6%) followed by English (27.4%).
- A significant demographic segment is the Post-2000s (Gen Z/Alpha) group, representing 50% of guests.
Recommendations for Hosts
- Target domestic marketing efforts towards travelers from Porto Alegre and Rio Grande do Sul.
- Tailor amenities and listing descriptions to appeal to the dominant Post-2000s (Gen Z/Alpha) demographic (e.g., highlight fast WiFi, smart home features, local guides).
- Highlight unique local experiences or amenities relevant to the primary guest profile.
- Consider seasonal promotions aligned with peak travel times for key origin markets.
Nearby Short-Term Rental Market Comparison
How does the Osório Airbnb market stack up against its neighbors? Compare key performance metrics like average monthly revenue, ADR, and occupancy rates in surrounding areas to understand the broader regional STR landscape.
| Market | Active Properties | Monthly Revenue | Daily Rate | Avg. Occupancy |
|---|---|---|---|---|
| Pinto Bandeira | 20 | $1,439 | $161.98 | 31% |
| Flores da Cunha | 16 | $891 | $71.27 | 44% |
| Linha Nova | 10 | $890 | $86.73 | 37% |
| Gramado | 3,177 | $778 | $93.36 | 36% |
| Monte Belo do Sul | 14 | $768 | $96.62 | 32% |
| Picada Café | 24 | $766 | $97.19 | 32% |
| Região Geográfica Imediata de Criciúma | 11 | $678 | $98.34 | 30% |
| Garibaldi | 66 | $672 | $90.05 | 30% |
| Santa Maria do Herval | 39 | $638 | $67.87 | 33% |
| Carlos Barbosa | 31 | $631 | $78.33 | 32% |