Mampituba Airbnb Market Analysis 2026: Short Term Rental Data & Vacation Rental Statistics in Rio Grande do Sul, Brazil
Is Airbnb profitable in Mampituba in 2026? Explore comprehensive Airbnb analytics for Mampituba, Rio Grande do Sul, Brazil to uncover income potential. This 2026 STR market report for Mampituba, based on AirROI data from February 2025 to January 2026, reveals key trends in the niche market of 18 active listings.
Whether you're considering an Airbnb investment in Mampituba, optimizing your existing vacation rental, or exploring rental arbitrage opportunities, understanding the Mampituba Airbnb data is crucial. Leveraging the low regulation environment is key to maximizing your short term rental income potential. Let's dive into the specifics.
Key Mampituba Airbnb Performance Metrics Overview
Monthly Airbnb Revenue Variations & Income Potential in Mampituba (2026)
Understanding the monthly revenue variations for Airbnb listings in Mampituba is key to maximizing your short term rental income potential. Seasonality significantly impacts earnings. Our analysis, based on data from the past 12 months, shows that the peak revenue month for STRs in Mampituba is typically May, while November often presents the lowest earnings, highlighting opportunities for strategic pricing adjustments during shoulder and low seasons. Explore the typical Airbnb income in Mampituba across different performance tiers:
- Best-in-class properties (Top 10%) achieve $1,597+ monthly, often utilizing dynamic pricing and superior guest experiences.
- Strong performing properties (Top 25%) earn $1,084 or more, indicating effective management and desirable locations/amenities.
- Typical properties (Median) generate around $532 per month, representing the average market performance.
- Entry-level properties (Bottom 25%) see earnings around $221, often with potential for optimization.
Average Monthly Airbnb Earnings Trend in Mampituba
Mampituba Airbnb Occupancy Rate Trends (2026)
Maximize your bookings by understanding the Mampituba STR occupancy trends. Seasonal demand shifts significantly influence how often properties are booked. Typically, Maysees the highest demand (peak season occupancy), while October experiences the lowest (low season). Effective strategies, like adjusting minimum stays or offering promotions, can boost occupancy during slower periods. Here's how different property tiers perform in Mampituba:
- Best-in-class properties (Top 10%) achieve 49%+ occupancy, indicating high desirability and potentially optimized availability.
- Strong performing properties (Top 25%) maintain 36% or higher occupancy, suggesting good market fit and guest satisfaction.
- Typical properties (Median) have an occupancy rate around 20%.
- Entry-level properties (Bottom 25%) average 10% occupancy, potentially facing higher vacancy.
Average Monthly Occupancy Rate Trend in Mampituba
Average Daily Rate (ADR) Airbnb Trends in Mampituba (2026)
Effective short term rental pricing strategy in Mampituba involves understanding monthly ADR fluctuations. The Average Daily Rate (ADR) for Airbnb in Mampituba typically peaks in January and dips lowest during April. Leveraging Airbnb dynamic pricing tools or strategies based on this seasonality can significantly boost revenue. Here's a look at the typical nightly rates achieved:
- Best-in-class properties (Top 10%) command rates of $129+ per night, often due to premium features or locations.
- Strong performing properties (Top 25%) achieve nightly rates of $115 or more.
- Typical properties (Median) charge around $79 per night.
- Entry-level properties (Bottom 25%) earn around $51 per night.
Average Daily Rate (ADR) Trend by Month in Mampituba
Get Live Mampituba Market Intelligence 👇

Explore Real-time Analytics
Airbnb Seasonality Analysis & Trends in Mampituba (2026)
Peak Season (May, March, July)
- Revenue averages $992 per month
- Occupancy rates average 33.4%
- Daily rates average $81
Shoulder Season
- Revenue averages $722 per month
- Occupancy maintains around 24.2%
- Daily rates hold near $84
Low Season (September, October, November)
- Revenue drops to average $529 per month
- Occupancy decreases to average 16.8%
- Daily rates adjust to average $87
Seasonality Insights for Mampituba
- The Airbnb seasonality in Mampituba shows highly seasonal trends requiring careful strategy. While the sections above show seasonal averages, it's also insightful to look at the extremes:
- During the high season, the absolute peak month showcases Mampituba's highest earning potential, with monthly revenues capable of climbing to $1,161, occupancy reaching a high of 39.9%, and ADRs peaking at $90.
- Conversely, the slowest single month of the year, typically falling within the low season, marks the market's lowest point. In this month, revenue might dip to $500, occupancy could drop to 16.1%, and ADRs may adjust down to $79.
- Understanding both the seasonal averages and these monthly peaks and troughs in revenue, occupancy, and ADR is crucial for maximizing your Airbnb profit potential in Mampituba.
Seasonal Strategies for Maximizing Profit
- Peak Season: Maximize revenue through premium pricing and potentially longer minimum stays. Ensure high availability.
- Low Season: Offer competitive pricing, special promotions (e.g., extended stay discounts), and flexible cancellation policies. Target off-season travelers like remote workers or budget-conscious guests.
- Shoulder Seasons: Implement dynamic pricing that balances peak and low rates. Target weekend travelers or specific events. Offer slightly more flexible terms than peak season.
- Regularly analyze your own performance against these Mampituba seasonality benchmarks and adjust your pricing and availability strategy accordingly.
Best Areas for Airbnb Investment in Mampituba (2026)
Exploring the top neighborhoods for short-term rentals in Mampituba? This section highlights key areas, outlining why they are attractive for hosts and guests, along with notable local attractions. Consider these locations based on your target guest profile and investment strategy.
| Neighborhood / Area | Why Host Here? (Target Guests & Appeal) | Key Attractions & Landmarks |
|---|---|---|
| Lagoa do Peixe | A stunning national park area known for its wildlife and natural beauty, attracting nature enthusiasts and birdwatchers. | Lagoa do Peixe National Park, Birdwatching tours, Natural beauty, Fishing spots |
| Praia do Laranjal | A popular beach destination with calm waters and beautiful sunsets, appealing to families and vacationers. | Laranjal Beach, Water sports, Local restaurants, Beach volleyball |
| Capão da Canoa | A vibrant beach town known for its lively atmosphere, it is a hotspot for summer vacationers and young crowd. | Capão da Canoa Beach, Nightlife, Local markets, Surfing |
| Torres | A picturesque coastal town known for its stunning cliffs and beaches, perfect for outdoor activities and relaxation. | Praia da Guarita, Cliff hiking, Local festivals, Ecotourism |
| São Lourenço do Sul | A charming town situated on a lake, famous for its local culture and serene environment, attracting tourists looking for tranquility. | Lake São Lourenço, Cultural heritage sites, Tranquil parks, Local crafts |
| Balneário Camboriú | An upscale beach destination known for its high-rise skyline, shopping, and vibrant nightlife, attracting urban tourists. | Central Beach, Shopping malls, Bars and clubs, Cable car rides |
| Canguçu | A lesser-known rural area with unique local experiences and outdoor activities, perfect for travelers looking for authenticity. | Cultural heritage, Local farms, Outdoor activities, Traditional cuisine |
| Rio Grande | A historic city with beautiful architecture and access to beaches, appealing to both history enthusiasts and beachgoers. | Historic downtown, Beaches, Museums, Cultural events |
Understanding Airbnb License Requirements & STR Laws in Mampituba (2026)
While Mampituba, Rio Grande do Sul, Brazil currently shows low STR regulations, specific Airbnb license requirements might still exist or change. Always verify the latest short term rental regulations and Airbnb license requirements directly with local government authorities for Mampituba to ensure full compliance before hosting.
(Source: AirROI data, 2026, finding no licensed listings among those analyzed)
Top Performing Airbnb Properties in Mampituba (2026)
Benchmark your potential! Explore examples of top-performing Airbnb properties in Mampitubabased on Trailing Twelve Month (TTM) revenue. Analyze their characteristics, revenue, occupancy rate, and ADR to understand what drives success in this market.
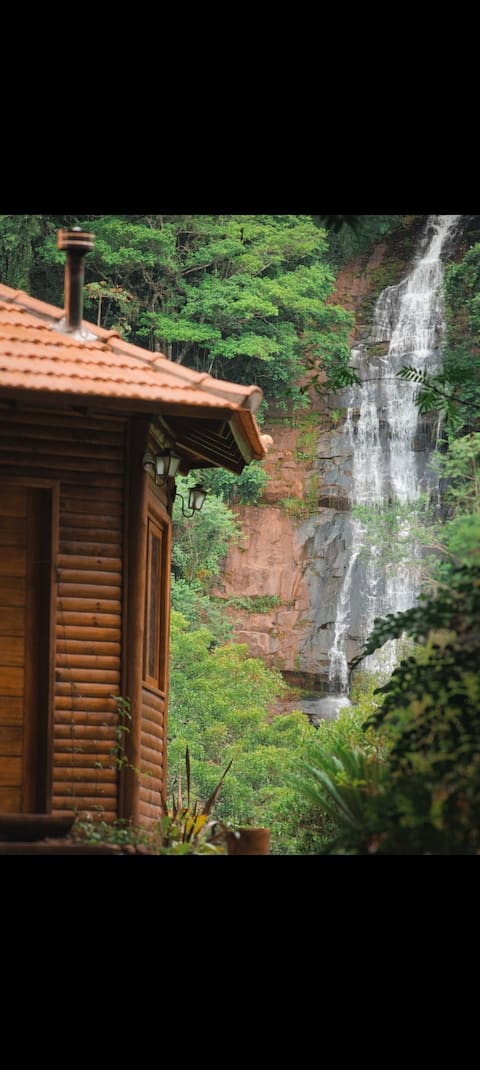
Chalet facing a waterfall
Entire Place • 1 bedroom
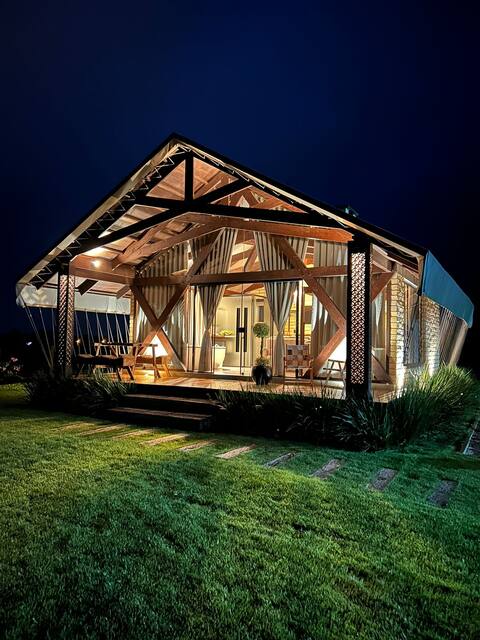
Glamping Umbu
Entire Place • 1 bedroom

Glamping Tajuva
Entire Place • 1 bedroom

Hydro, chalet and balloon
Entire Place • 2 bedrooms
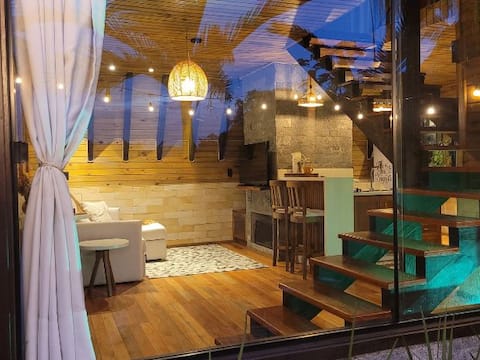
Arimara Chalés. Bem-te-vi Chalet
Entire Place • 1 bedroom

Chalet with amazing views and coziness
Entire Place • 1 bedroom
Note: Performance varies based on location, size, amenities, seasonality, and management quality. Data reflects the past 12 months.
Top Performing Airbnb Hosts in Mampituba (2026)
Learn from the best! This table showcases top-performing Airbnb hosts in Mampituba based on the number of properties managed and estimated total revenue over the past year. Analyze their scale and performance metrics.
| Host Name | Properties | Grossing Revenue | Stay Reviews | Avg Rating |
|---|---|---|---|---|
| Monica | 2 | $30,290 | 36 | 5.00/5.0 |
| Moisés | 2 | $21,184 | 24 | 5.00/5.0 |
| Tamires | 1 | $19,736 | 77 | 4.97/5.0 |
| Lucas | 2 | $15,040 | 35 | 5.00/5.0 |
| Patricia | 1 | $13,860 | 28 | 4.86/5.0 |
| Juliano | 2 | $10,401 | 3 | Not Rated |
| Josi | 1 | $3,251 | 26 | 5.00/5.0 |
| Jucy | 1 | $3,213 | 4 | 5.00/5.0 |
| Mateus | 1 | $2,213 | 102 | 4.94/5.0 |
| Marcia | 1 | $1,766 | 25 | 5.00/5.0 |
Analyzing the strategies of top hosts, such as their property selection, pricing, and guest communication, can offer valuable lessons for optimizing your own Airbnb operations in Mampituba.
Dive Deeper: Advanced Mampituba STR Market Data (2026)
Ready to unlock more insights? AirROI provides access to advanced metrics and comprehensive Airbnb data for Mampituba. Explore detailed analytics beyond this report to refine your investment strategy, optimize pricing, and maximize your vacation rental profits.
Explore Advanced MetricsMampituba Short-Term Rental Market Composition (2026): Property & Room Types
Room Type Distribution
Property Type Distribution
Market Composition Insights for Mampituba
- The Mampituba Airbnb market composition is heavily skewed towards Entire Home/Apt listings, which make up 94.4% of the 18 active rentals. This indicates strong guest preference for privacy and space.
- Looking at the property type distribution in Mampituba, Outdoor/Unique properties are the most common (61.1%), reflecting the local real estate landscape.
- Houses represent a significant 27.8% portion, catering likely to families or larger groups.
- The presence of 11.1% Hotel/Boutique listings indicates integration with traditional hospitality.
Mampituba Airbnb Room Capacity Analysis (2026): Bedroom Distribution
Distribution of Listings by Number of Bedrooms
Room Capacity Insights for Mampituba
- The dominant room capacity in Mampituba is 1 bedroom listings, making up 77.8% of the market. This suggests a strong demand for properties suitable for couples or solo travelers.
- Together, 1 bedroom and 2 bedrooms properties represent 94.5% of the active Airbnb listings in Mampituba, indicating a high concentration in these sizes.
- With over half the market (77.8%) consisting of studios or 1-bedroom units, Mampituba is particularly well-suited for individuals or couples.
- Listings with 3+ bedrooms (5.6%) represent a smaller niche, potentially indicating an underserved market for larger group accommodations in Mampituba.
Mampituba Vacation Rental Guest Capacity Trends (2026)
Distribution of Listings by Guest Capacity
Guest Capacity Insights for Mampituba
- The most common guest capacity trend in Mampituba vacation rentals is listings accommodating 2 guests (33.3%). This suggests the primary traveler segment is likely couples or solo travelers.
- Properties designed for 2 guests and 3 guests dominate the Mampituba STR market, accounting for 55.5% of listings.
- 16.7% of properties accommodate 6+ guests, serving the market segment for larger families or group travel in Mampituba.
- On average, properties in Mampituba are equipped to host 3.3 guests.
Mampituba Airbnb Booking Patterns (2026): Available vs. Booked Days
Available Days Distribution
Booked Days Distribution
Booking Pattern Insights for Mampituba
- The most common availability pattern in Mampituba falls within the 271-366 days range, representing 72.2% of listings. This suggests many properties have significant open periods on their calendars.
- Approximately 100.0% of listings show high availability (181+ days open annually), indicating potential for increased bookings or specific owner usage patterns.
- For booked days, the 31-90 days range is most frequent in Mampituba (50%), reflecting common guest stay durations or potential owner blocking patterns.
- A notable 5.6% of properties secure long booking periods (181+ days booked per year), highlighting successful long-term rental strategies or significant owner usage.
Mampituba Airbnb Minimum Stay Requirements Analysis
Distribution of Listings by Minimum Night Requirement
1 Night
9 listings
50% of total
2 Nights
1 listings
5.6% of total
4-6 Nights
1 listings
5.6% of total
30+ Nights
7 listings
38.9% of total
Key Insights
- The most prevalent minimum stay requirement in Mampituba is 1 Night, adopted by 50% of listings. This highlights the market's preference for shorter, flexible bookings.
- A significant segment (38.9%) caters to monthly stays (30+ nights) in Mampituba, pointing to opportunities in the extended-stay market.
Recommendations
- Align with the market by considering a 1 Night minimum stay, as 50% of Mampituba hosts use this setting.
- Explore offering discounts for stays of 30+ nights to attract the 38.9% of the market seeking extended stays.
- Adjust minimum nights based on seasonality – potentially shorter during low season and longer during peak demand periods in Mampituba.
Mampituba Airbnb Cancellation Policy Trends Analysis (2026)
Limited
1 listings
5.6% of total
Flexible
5 listings
27.8% of total
Moderate
8 listings
44.4% of total
Firm
4 listings
22.2% of total
Cancellation Policy Insights for Mampituba
- The prevailing Airbnb cancellation policy trend in Mampituba is Moderate, used by 44.4% of listings.
- The market strongly favors guest-friendly terms, with 72.2% of listings offering Flexible or Moderate policies. This suggests guests in Mampituba may expect booking flexibility.
Recommendations for Hosts
- Consider adopting a Moderate policy to align with the 44.4% market standard in Mampituba.
- Regularly review your cancellation policy against competitors and market demand shifts in Mampituba.
Mampituba STR Booking Lead Time Analysis (2026)
Average Booking Lead Time by Month
Booking Lead Time Insights for Mampituba
- The overall average booking lead time for vacation rentals in Mampituba is 41 days.
- Guests book furthest in advance for stays during October (average 75 days), likely coinciding with peak travel demand or local events.
- The shortest booking windows occur for stays in March (average 17 days), indicating more last-minute travel plans during this time.
- Seasonally, Fall (44 days avg.) sees the longest lead times, while Spring (24 days avg.) has the shortest, reflecting typical travel planning cycles.
Recommendations for Hosts
- Use the overall average lead time (41 days) as a baseline for your pricing and availability strategy in Mampituba.
- For October stays, consider implementing length-of-stay discounts or slightly higher rates for bookings made less than 75 days out to capitalize on advance planning.
- Target marketing efforts for the Fall season well in advance (at least 44 days) to capture early planners.
- Monitor your own booking lead times against these Mampituba averages to identify opportunities for dynamic pricing adjustments.
Popular & Essential Airbnb Amenities in Mampituba (2026)
Amenity Prevalence
Amenity Insights for Mampituba
- Essential amenities in Mampituba that guests expect include: Air conditioning, TV, Wifi. Lacking these (any) could significantly impact bookings.
- Popular amenities like Kitchen, Free parking on premises, Hair dryer are common but not universal. Offering these can provide a competitive edge.
Recommendations for Hosts
- Ensure your listing includes all essential amenities for Mampituba: Air conditioning, TV, Wifi.
- Consider adding popular differentiators like Kitchen or Free parking on premises to increase appeal.
- Highlight unique or less common amenities you offer (e.g., hot tub, dedicated workspace, EV charger) in your listing description and photos.
- Regularly check competitor amenities in Mampituba to stay competitive.
Mampituba Airbnb Guest Demographics & Profile Analysis (2026)
Guest Profile Summary for Mampituba
- The typical guest profile for Airbnb in Mampituba consists of primarily domestic travelers (96%), often arriving from nearby Rio Grande do Sul, typically belonging to the Post-2000s (Gen Z/Alpha) group (50%), primarily speaking Portuguese or English.
- Domestic travelers account for 96.1% of guests.
- Key international markets include Brazil (96.1%) and United Kingdom (2%).
- Top languages spoken are Portuguese (38.9%) followed by English (37%).
- A significant demographic segment is the Post-2000s (Gen Z/Alpha) group, representing 50% of guests.
Recommendations for Hosts
- Target domestic marketing efforts towards travelers from Rio Grande do Sul and Porto Alegre.
- Tailor amenities and listing descriptions to appeal to the dominant Post-2000s (Gen Z/Alpha) demographic (e.g., highlight fast WiFi, smart home features, local guides).
- Highlight unique local experiences or amenities relevant to the primary guest profile.
- Consider seasonal promotions aligned with peak travel times for key origin markets.
Nearby Short-Term Rental Market Comparison
How does the Mampituba Airbnb market stack up against its neighbors? Compare key performance metrics like average monthly revenue, ADR, and occupancy rates in surrounding areas to understand the broader regional STR landscape.
| Market | Active Properties | Monthly Revenue | Daily Rate | Avg. Occupancy |
|---|---|---|---|---|
| Gramado | 3,177 | $778 | $93.36 | 36% |
| Região Geográfica Imediata de Criciúma | 11 | $678 | $98.34 | 30% |
| Santa Maria do Herval | 39 | $638 | $67.87 | 33% |
| Orleans | 46 | $629 | $75.26 | 30% |
| Imaruí | 80 | $618 | $100.41 | 27% |
| Canela | 1,145 | $604 | $80.61 | 32% |
| Treviso | 20 | $591 | $96.18 | 23% |
| Garopaba | 1,921 | $572 | $111.80 | 30% |
| Igrejinha | 52 | $566 | $68.09 | 32% |
| Santo Antônio da Patrulha | 13 | $562 | $67.55 | 32% |