Imbé Airbnb Market Analysis 2026: Short Term Rental Data & Vacation Rental Statistics in Rio Grande do Sul, Brazil
Is Airbnb profitable in Imbé in 2026? Explore comprehensive Airbnb analytics for Imbé, Rio Grande do Sul, Brazil to uncover income potential. This 2026 STR market report for Imbé, based on AirROI data from February 2025 to January 2026, reveals key trends in the market of 450 active listings.
Whether you're considering an Airbnb investment in Imbé, optimizing your existing vacation rental, or exploring rental arbitrage opportunities, understanding the Imbé Airbnb data is crucial. Leveraging the low regulation environment is key to maximizing your short term rental income potential. Let's dive into the specifics.
Key Imbé Airbnb Performance Metrics Overview
Monthly Airbnb Revenue Variations & Income Potential in Imbé (2026)
Understanding the monthly revenue variations for Airbnb listings in Imbé is key to maximizing your short term rental income potential. Seasonality significantly impacts earnings. Our analysis, based on data from the past 12 months, shows that the peak revenue month for STRs in Imbé is typically January, while August often presents the lowest earnings, highlighting opportunities for strategic pricing adjustments during shoulder and low seasons. Explore the typical Airbnb income in Imbé across different performance tiers:
- Best-in-class properties (Top 10%) achieve $1,100+ monthly, often utilizing dynamic pricing and superior guest experiences.
- Strong performing properties (Top 25%) earn $597 or more, indicating effective management and desirable locations/amenities.
- Typical properties (Median) generate around $278 per month, representing the average market performance.
- Entry-level properties (Bottom 25%) see earnings around $141, often with potential for optimization.
Average Monthly Airbnb Earnings Trend in Imbé
Imbé Airbnb Occupancy Rate Trends (2026)
Maximize your bookings by understanding the Imbé STR occupancy trends. Seasonal demand shifts significantly influence how often properties are booked. Typically, Februarysees the highest demand (peak season occupancy), while August experiences the lowest (low season). Effective strategies, like adjusting minimum stays or offering promotions, can boost occupancy during slower periods. Here's how different property tiers perform in Imbé:
- Best-in-class properties (Top 10%) achieve 44%+ occupancy, indicating high desirability and potentially optimized availability.
- Strong performing properties (Top 25%) maintain 27% or higher occupancy, suggesting good market fit and guest satisfaction.
- Typical properties (Median) have an occupancy rate around 13%.
- Entry-level properties (Bottom 25%) average 7% occupancy, potentially facing higher vacancy.
Average Monthly Occupancy Rate Trend in Imbé
Average Daily Rate (ADR) Airbnb Trends in Imbé (2026)
Effective short term rental pricing strategy in Imbé involves understanding monthly ADR fluctuations. The Average Daily Rate (ADR) for Airbnb in Imbé typically peaks in January and dips lowest during April. Leveraging Airbnb dynamic pricing tools or strategies based on this seasonality can significantly boost revenue. Here's a look at the typical nightly rates achieved:
- Best-in-class properties (Top 10%) command rates of $136+ per night, often due to premium features or locations.
- Strong performing properties (Top 25%) achieve nightly rates of $97 or more.
- Typical properties (Median) charge around $66 per night.
- Entry-level properties (Bottom 25%) earn around $45 per night.
Average Daily Rate (ADR) Trend by Month in Imbé
Get Live Imbé Market Intelligence 👇

Explore Real-time Analytics
Airbnb Seasonality Analysis & Trends in Imbé (2026)
Peak Season (January, February, December)
- Revenue averages $862 per month
- Occupancy rates average 32.5%
- Daily rates average $87
Shoulder Season
- Revenue averages $407 per month
- Occupancy maintains around 18.5%
- Daily rates hold near $78
Low Season (June, July, August)
- Revenue drops to average $224 per month
- Occupancy decreases to average 10.1%
- Daily rates adjust to average $76
Seasonality Insights for Imbé
- The Airbnb seasonality in Imbé shows highly seasonal trends requiring careful strategy. While the sections above show seasonal averages, it's also insightful to look at the extremes:
- During the high season, the absolute peak month showcases Imbé's highest earning potential, with monthly revenues capable of climbing to $920, occupancy reaching a high of 41.3%, and ADRs peaking at $92.
- Conversely, the slowest single month of the year, typically falling within the low season, marks the market's lowest point. In this month, revenue might dip to $194, occupancy could drop to 8.6%, and ADRs may adjust down to $73.
- Understanding both the seasonal averages and these monthly peaks and troughs in revenue, occupancy, and ADR is crucial for maximizing your Airbnb profit potential in Imbé.
Seasonal Strategies for Maximizing Profit
- Peak Season: Maximize revenue through premium pricing and potentially longer minimum stays. Ensure high availability.
- Low Season: Offer competitive pricing, special promotions (e.g., extended stay discounts), and flexible cancellation policies. Target off-season travelers like remote workers or budget-conscious guests.
- Shoulder Seasons: Implement dynamic pricing that balances peak and low rates. Target weekend travelers or specific events. Offer slightly more flexible terms than peak season.
- Regularly analyze your own performance against these Imbé seasonality benchmarks and adjust your pricing and availability strategy accordingly.
Best Areas for Airbnb Investment in Imbé (2026)
Exploring the top neighborhoods for short-term rentals in Imbé? This section highlights key areas, outlining why they are attractive for hosts and guests, along with notable local attractions. Consider these locations based on your target guest profile and investment strategy.
| Neighborhood / Area | Why Host Here? (Target Guests & Appeal) | Key Attractions & Landmarks |
|---|---|---|
| Centro de Imbé | The heart of Imbé, offering easy access to local shops, restaurants, and services. Ideal for guests looking for convenience and proximity to everything. | Praia de Imbé, Parque do Lago, mercados locais, restaurantes, cafés |
| Praia de Imbé | Known for its beautiful beach and relaxed atmosphere, this area attracts visitors looking for sun and sand. Perfect for vacationers wanting waterfront access. | Praia de Santa Helena, praia e quiosques, caminhada na praia, esportes aquáticos, pessoas e agitação do verão |
| Praia das Conchas | Famous for its stunning coastline and scenic views, this beach area is popular with tourists seeking a picturesque getaway. | Praia das Conchas, passeios de barco, mirantes, restaurantes de frutos do mar, trilhas na natureza |
| Projeto Tamar | A conservation project for sea turtles that attracts eco-tourists and families. Great educational experiences for kids and nature lovers. | Centro de Reabilitação de Tartarugas, ateliê de educadores ambientais, visitas guiadas, atividades educativas, praia próxima |
| Quadra do Porto | A vibrant area with great nightlife and entertainment options, perfect for younger crowds looking to enjoy local music and events. | restaurantes e bares, shows ao vivo, mercado de artesanato, festivais de música, cultura local |
| Beco da Alegria | A quaint alley known for its artistic vibe and cultural activities, attracts visitors interested in local art and community events. | murais de arte, feiras de arte, eventos culturais, cafés, lojas de artesanato |
| Ponta do Selo | A tranquil spot that offers a more relaxed beach experience away from the crowds. Ideal for families and couples. | praia tranquila, passeios ao ar livre, pinturas ao céu, local para piqueniques, ravinas menores |
| Imbé Velho | A historic area that reflects the local culture and heritage, attracting those interested in authenticity and local stories. | igrejas antigas, ruas de pedras, cultura local, museus, festivais comunitários |
Understanding Airbnb License Requirements & STR Laws in Imbé (2026)
While Imbé, Rio Grande do Sul, Brazil currently shows low STR regulations, specific Airbnb license requirements might still exist or change. Always verify the latest short term rental regulations and Airbnb license requirements directly with local government authorities for Imbé to ensure full compliance before hosting.
(Source: AirROI data, 2026, based on 0% licensed listings)
Top Performing Airbnb Properties in Imbé (2026)
Benchmark your potential! Explore examples of top-performing Airbnb properties in Imbébased on Trailing Twelve Month (TTM) revenue. Analyze their characteristics, revenue, occupancy rate, and ADR to understand what drives success in this market.
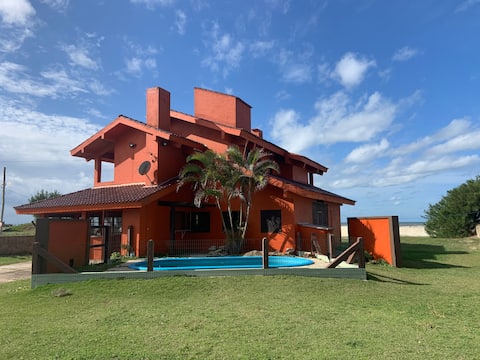
Beachfront house with pool
Entire Place • 6 bedrooms

Casa da Debbie - house with pool
Entire Place • 3 bedrooms

Air-conditioned house with 4 suites by the lagoon (5)
Entire Place • 4 bedrooms

Beach house with pool
Entire Place • 4 bedrooms

Casa em Imbé Com Piscina. Lugar calmo 500mts Mar.
Entire Place • 3 bedrooms

Grass Style Beach House
Entire Place • 8 bedrooms
Note: Performance varies based on location, size, amenities, seasonality, and management quality. Data reflects the past 12 months.
Top Performing Airbnb Hosts in Imbé (2026)
Learn from the best! This table showcases top-performing Airbnb hosts in Imbé based on the number of properties managed and estimated total revenue over the past year. Analyze their scale and performance metrics.
| Host Name | Properties | Grossing Revenue | Stay Reviews | Avg Rating |
|---|---|---|---|---|
| Laura | 1 | $35,535 | 73 | 4.79/5.0 |
| Maurício | 2 | $19,898 | 132 | 4.97/5.0 |
| Diego Woiczekoski | 1 | $17,739 | 10 | 5.00/5.0 |
| Tamara | 1 | $17,565 | 5 | 4.80/5.0 |
| Rose | 1 | $15,101 | 33 | 4.94/5.0 |
| Daniel | 1 | $14,934 | 9 | 4.56/5.0 |
| Julio Cesar | 1 | $14,617 | 4 | 4.75/5.0 |
| Gabrielle | 1 | $14,272 | 2 | Not Rated |
| Mari | 1 | $14,202 | 4 | 4.75/5.0 |
| Julio Berta | 1 | $13,350 | 14 | 4.93/5.0 |
Analyzing the strategies of top hosts, such as their property selection, pricing, and guest communication, can offer valuable lessons for optimizing your own Airbnb operations in Imbé.
Dive Deeper: Advanced Imbé STR Market Data (2026)
Ready to unlock more insights? AirROI provides access to advanced metrics and comprehensive Airbnb data for Imbé. Explore detailed analytics beyond this report to refine your investment strategy, optimize pricing, and maximize your vacation rental profits.
Explore Advanced MetricsImbé Short-Term Rental Market Composition (2026): Property & Room Types
Room Type Distribution
Property Type Distribution
Market Composition Insights for Imbé
- The Imbé Airbnb market composition is heavily skewed towards Entire Home/Apt listings, which make up 97.8% of the 450 active rentals. This indicates strong guest preference for privacy and space.
- Looking at the property type distribution in Imbé, House properties are the most common (84.9%), reflecting the local real estate landscape.
- Houses represent a significant 84.9% portion, catering likely to families or larger groups.
- Smaller segments like hotel/boutique, others (combined 2.4%) offer potential for unique stay experiences.
Imbé Airbnb Room Capacity Analysis (2026): Bedroom Distribution
Distribution of Listings by Number of Bedrooms
Room Capacity Insights for Imbé
- The dominant room capacity in Imbé is 2 bedrooms listings, making up 35.3% of the market. This suggests a strong demand for properties suitable for couples or solo travelers.
- Together, 2 bedrooms and 3 bedrooms properties represent 69.7% of the active Airbnb listings in Imbé, indicating a high concentration in these sizes.
- A significant 48.7% of listings offer 3+ bedrooms, catering to larger groups and families seeking more space in Imbé.
Imbé Vacation Rental Guest Capacity Trends (2026)
Distribution of Listings by Guest Capacity
Guest Capacity Insights for Imbé
- The most common guest capacity trend in Imbé vacation rentals is listings accommodating 8+ guests (35.8%). This suggests the primary traveler segment is likely larger groups.
- Properties designed for 8+ guests and 6 guests dominate the Imbé STR market, accounting for 66.5% of listings.
- 73.8% of properties accommodate 6+ guests, serving the market segment for larger families or group travel in Imbé.
- On average, properties in Imbé are equipped to host 6.2 guests.
Imbé Airbnb Booking Patterns (2026): Available vs. Booked Days
Available Days Distribution
Booked Days Distribution
Booking Pattern Insights for Imbé
- The most common availability pattern in Imbé falls within the 271-366 days range, representing 93.1% of listings. This suggests many properties have significant open periods on their calendars.
- Approximately 99.3% of listings show high availability (181+ days open annually), indicating potential for increased bookings or specific owner usage patterns.
- For booked days, the 1-30 days range is most frequent in Imbé (52.9%), reflecting common guest stay durations or potential owner blocking patterns.
- A notable 0.9% of properties secure long booking periods (181+ days booked per year), highlighting successful long-term rental strategies or significant owner usage.
Imbé Airbnb Minimum Stay Requirements Analysis
Distribution of Listings by Minimum Night Requirement
1 Night
50 listings
11.1% of total
2 Nights
93 listings
20.7% of total
3 Nights
53 listings
11.8% of total
4-6 Nights
81 listings
18% of total
7-29 Nights
20 listings
4.4% of total
30+ Nights
153 listings
34% of total
Key Insights
- The most prevalent minimum stay requirement in Imbé is 30+ Nights, adopted by 34% of listings. This highlights the market's preference for longer commitments.
- A significant segment (34%) caters to monthly stays (30+ nights) in Imbé, pointing to opportunities in the extended-stay market.
Recommendations
- Align with the market by considering a 30+ Nights minimum stay, as 34% of Imbé hosts use this setting.
- If feasible, allowing 1-night stays, especially midweek or during low season, could capture last-minute bookings, as only 11.1% currently do.
- Explore offering discounts for stays of 30+ nights to attract the 34% of the market seeking extended stays.
- Adjust minimum nights based on seasonality – potentially shorter during low season and longer during peak demand periods in Imbé.
Imbé Airbnb Cancellation Policy Trends Analysis (2026)
Limited
9 listings
2% of total
Flexible
107 listings
24% of total
Moderate
115 listings
25.8% of total
Firm
177 listings
39.7% of total
Strict
38 listings
8.5% of total
Cancellation Policy Insights for Imbé
- The prevailing Airbnb cancellation policy trend in Imbé is Firm, used by 39.7% of listings.
- There's a relatively balanced mix between guest-friendly (49.8%) and stricter (48.2%) policies, offering choices for different guest needs.
- Strict cancellation policies are quite rare (8.5%), potentially making listings with this policy less competitive unless justified by high demand or property type.
Recommendations for Hosts
- Consider adopting a Firm policy to align with the 39.7% market standard in Imbé.
- Using a Strict policy might deter some guests, as only 8.5% of listings use it. Evaluate if potential revenue protection outweighs possible lower booking rates.
- Regularly review your cancellation policy against competitors and market demand shifts in Imbé.
Imbé STR Booking Lead Time Analysis (2026)
Average Booking Lead Time by Month
Booking Lead Time Insights for Imbé
- The overall average booking lead time for vacation rentals in Imbé is 33 days.
- Guests book furthest in advance for stays during December (average 56 days), likely coinciding with peak travel demand or local events.
- The shortest booking windows occur for stays in June (average 3 days), indicating more last-minute travel plans during this time.
- Seasonally, Winter (44 days avg.) sees the longest lead times, while Summer (6 days avg.) has the shortest, reflecting typical travel planning cycles.
Recommendations for Hosts
- Use the overall average lead time (33 days) as a baseline for your pricing and availability strategy in Imbé.
- For December stays, consider implementing length-of-stay discounts or slightly higher rates for bookings made less than 56 days out to capitalize on advance planning.
- During June, focus on last-minute booking availability and promotions, as guests book with very short notice (3 days avg.).
- Target marketing efforts for the Winter season well in advance (at least 44 days) to capture early planners.
- Monitor your own booking lead times against these Imbé averages to identify opportunities for dynamic pricing adjustments.
Popular & Essential Airbnb Amenities in Imbé (2026)
Amenity Prevalence
Amenity Insights for Imbé
- Essential amenities in Imbé that guests expect include: Kitchen. Lacking these (this) could significantly impact bookings.
- Popular amenities like TV, Free parking on premises, Wifi are common but not universal. Offering these can provide a competitive edge.
- Warning: Wifi is not universally provided but is considered essential globally. Ensure reliable Wifi is offered.
Recommendations for Hosts
- Ensure your listing includes all essential amenities for Imbé: Kitchen.
- Prioritize adding missing essentials: Kitchen.
- Consider adding popular differentiators like TV or Free parking on premises to increase appeal.
- Highlight unique or less common amenities you offer (e.g., hot tub, dedicated workspace, EV charger) in your listing description and photos.
- Regularly check competitor amenities in Imbé to stay competitive.
Imbé Airbnb Guest Demographics & Profile Analysis (2026)
Guest Profile Summary for Imbé
- The typical guest profile for Airbnb in Imbé consists of primarily domestic travelers (98%), often arriving from nearby Porto Alegre, typically belonging to the Post-2000s (Gen Z/Alpha) group (50%), primarily speaking Portuguese or English.
- Domestic travelers account for 97.8% of guests.
- Key international markets include Brazil (97.8%) and United States (0.6%).
- Top languages spoken are Portuguese (54.7%) followed by English (24.5%).
- A significant demographic segment is the Post-2000s (Gen Z/Alpha) group, representing 50% of guests.
Recommendations for Hosts
- Target domestic marketing efforts towards travelers from Porto Alegre and Rio Grande do Sul.
- Tailor amenities and listing descriptions to appeal to the dominant Post-2000s (Gen Z/Alpha) demographic (e.g., highlight fast WiFi, smart home features, local guides).
- Highlight unique local experiences or amenities relevant to the primary guest profile.
- Consider seasonal promotions aligned with peak travel times for key origin markets.
Nearby Short-Term Rental Market Comparison
How does the Imbé Airbnb market stack up against its neighbors? Compare key performance metrics like average monthly revenue, ADR, and occupancy rates in surrounding areas to understand the broader regional STR landscape.
| Market | Active Properties | Monthly Revenue | Daily Rate | Avg. Occupancy |
|---|---|---|---|---|
| Pinto Bandeira | 20 | $1,439 | $161.98 | 31% |
| Flores da Cunha | 16 | $891 | $71.27 | 44% |
| Linha Nova | 10 | $890 | $86.73 | 37% |
| Gramado | 3,177 | $778 | $93.36 | 36% |
| Monte Belo do Sul | 14 | $768 | $96.62 | 32% |
| Picada Café | 24 | $766 | $97.19 | 32% |
| Região Geográfica Imediata de Criciúma | 11 | $678 | $98.34 | 30% |
| Garibaldi | 66 | $672 | $90.05 | 30% |
| Santa Maria do Herval | 39 | $638 | $67.87 | 33% |
| Carlos Barbosa | 31 | $631 | $78.33 | 32% |