Cachoeira do Sul Airbnb Market Analysis 2026: Short Term Rental Data & Vacation Rental Statistics in Rio Grande do Sul, Brazil
Is Airbnb profitable in Cachoeira do Sul in 2026? Explore comprehensive Airbnb analytics for Cachoeira do Sul, Rio Grande do Sul, Brazil to uncover income potential. This 2026 STR market report for Cachoeira do Sul, based on AirROI data from February 2025 to January 2026, reveals key trends in the niche market of 56 active listings.
Whether you're considering an Airbnb investment in Cachoeira do Sul, optimizing your existing vacation rental, or exploring rental arbitrage opportunities, understanding the Cachoeira do Sul Airbnb data is crucial. Leveraging the low regulation environment is key to maximizing your short term rental income potential. Let's dive into the specifics.
Key Cachoeira do Sul Airbnb Performance Metrics Overview
Monthly Airbnb Revenue Variations & Income Potential in Cachoeira do Sul (2026)
Understanding the monthly revenue variations for Airbnb listings in Cachoeira do Sul is key to maximizing your short term rental income potential. Seasonality significantly impacts earnings. Our analysis, based on data from the past 12 months, shows that the peak revenue month for STRs in Cachoeira do Sul is typically February, while April often presents the lowest earnings, highlighting opportunities for strategic pricing adjustments during shoulder and low seasons. Explore the typical Airbnb income in Cachoeira do Sul across different performance tiers:
- Best-in-class properties (Top 10%) achieve $633+ monthly, often utilizing dynamic pricing and superior guest experiences.
- Strong performing properties (Top 25%) earn $460 or more, indicating effective management and desirable locations/amenities.
- Typical properties (Median) generate around $221 per month, representing the average market performance.
- Entry-level properties (Bottom 25%) see earnings around $108, often with potential for optimization.
Average Monthly Airbnb Earnings Trend in Cachoeira do Sul
Cachoeira do Sul Airbnb Occupancy Rate Trends (2026)
Maximize your bookings by understanding the Cachoeira do Sul STR occupancy trends. Seasonal demand shifts significantly influence how often properties are booked. Typically, Februarysees the highest demand (peak season occupancy), while July experiences the lowest (low season). Effective strategies, like adjusting minimum stays or offering promotions, can boost occupancy during slower periods. Here's how different property tiers perform in Cachoeira do Sul:
- Best-in-class properties (Top 10%) achieve 66%+ occupancy, indicating high desirability and potentially optimized availability.
- Strong performing properties (Top 25%) maintain 46% or higher occupancy, suggesting good market fit and guest satisfaction.
- Typical properties (Median) have an occupancy rate around 27%.
- Entry-level properties (Bottom 25%) average 13% occupancy, potentially facing higher vacancy.
Average Monthly Occupancy Rate Trend in Cachoeira do Sul
Average Daily Rate (ADR) Airbnb Trends in Cachoeira do Sul (2026)
Effective short term rental pricing strategy in Cachoeira do Sul involves understanding monthly ADR fluctuations. The Average Daily Rate (ADR) for Airbnb in Cachoeira do Sul typically peaks in October and dips lowest during February. Leveraging Airbnb dynamic pricing tools or strategies based on this seasonality can significantly boost revenue. Here's a look at the typical nightly rates achieved:
- Best-in-class properties (Top 10%) command rates of $45+ per night, often due to premium features or locations.
- Strong performing properties (Top 25%) achieve nightly rates of $36 or more.
- Typical properties (Median) charge around $28 per night.
- Entry-level properties (Bottom 25%) earn around $22 per night.
Average Daily Rate (ADR) Trend by Month in Cachoeira do Sul
Get Live Cachoeira do Sul Market Intelligence 👇

Explore Real-time Analytics
Airbnb Seasonality Analysis & Trends in Cachoeira do Sul (2026)
Peak Season (February, December, November)
- Revenue averages $366 per month
- Occupancy rates average 38.7%
- Daily rates average $31
Shoulder Season
- Revenue averages $310 per month
- Occupancy maintains around 31.8%
- Daily rates hold near $30
Low Season (April, May, July)
- Revenue drops to average $236 per month
- Occupancy decreases to average 27.0%
- Daily rates adjust to average $28
Seasonality Insights for Cachoeira do Sul
- The Airbnb seasonality in Cachoeira do Sul shows moderate seasonality with distinct peak and low periods. While the sections above show seasonal averages, it's also insightful to look at the extremes:
- During the high season, the absolute peak month showcases Cachoeira do Sul's highest earning potential, with monthly revenues capable of climbing to $413, occupancy reaching a high of 51.7%, and ADRs peaking at $34.
- Conversely, the slowest single month of the year, typically falling within the low season, marks the market's lowest point. In this month, revenue might dip to $222, occupancy could drop to 23.3%, and ADRs may adjust down to $25.
- Understanding both the seasonal averages and these monthly peaks and troughs in revenue, occupancy, and ADR is crucial for maximizing your Airbnb profit potential in Cachoeira do Sul.
Seasonal Strategies for Maximizing Profit
- Peak Season: Maximize revenue through premium pricing and potentially longer minimum stays. Ensure high availability.
- Low Season: Offer competitive pricing, special promotions (e.g., extended stay discounts), and flexible cancellation policies. Target off-season travelers like remote workers or budget-conscious guests.
- Shoulder Seasons: Implement dynamic pricing that balances peak and low rates. Target weekend travelers or specific events. Offer slightly more flexible terms than peak season.
- Regularly analyze your own performance against these Cachoeira do Sul seasonality benchmarks and adjust your pricing and availability strategy accordingly.
Best Areas for Airbnb Investment in Cachoeira do Sul (2026)
Exploring the top neighborhoods for short-term rentals in Cachoeira do Sul? This section highlights key areas, outlining why they are attractive for hosts and guests, along with notable local attractions. Consider these locations based on your target guest profile and investment strategy.
| Neighborhood / Area | Why Host Here? (Target Guests & Appeal) | Key Attractions & Landmarks |
|---|---|---|
| Centro | The city center of Cachoeira do Sul, ideal for tourists looking to explore local culture and amenities. Close to historical sites and local markets, making it convenient for guests. | Caminho dos Antiquários, Museu do Colono, Igreja do Rosário, Mercado Público, Praça Cândido Gomes |
| Praia das Pedras Brancas | A scenic area known for its beautiful beaches and natural surroundings. Great for vacationers seeking relaxation and outdoor activities like swimming and hiking. | Beaches, Nature trails, Water sports, Fishing areas |
| Caminho do Vinho | A wine route in the region, perfect for wine enthusiasts. Offers various vineyards and wine tasting experiences, attracting visitors year-round. | Local vineyards, Wine tasting tours, Gastronomic experiences, Beautiful landscapes |
| Barragem do Salto | A popular spot for nature lovers, known for water activities and fishing, attracting tourists looking for adventure and relaxation in a natural setting. | Lakes, Fishing, Boating, Hiking trails |
| São João do Polêsine | A neighboring district known for its rural tourism and agriculture. Ideal for guests wanting to experience the countryside and local farm life. | Rural properties, Agricultural experiences, Local festivals |
| Lagoa do Sobradinho | A picturesque lake area offering recreational activities such as kayaking and picnicking. Attractive to families and outdoor enthusiasts. | Kayaking, Picnic areas, Scenic views |
| Ilha das Pedras | An island offering a unique natural experience, great for visitors looking for an escape into nature with a chance to enjoy some tranquility. | Nature walks, Birdwatching, Relaxation spots |
| Parque do Lago | A community park that features walking trails and picnic areas, making it a relaxing spot for family-friendly activities in a natural setting. | Walking trails, Picnic areas, Children's playground |
Understanding Airbnb License Requirements & STR Laws in Cachoeira do Sul (2026)
While Cachoeira do Sul, Rio Grande do Sul, Brazil currently shows low STR regulations, specific Airbnb license requirements might still exist or change. Always verify the latest short term rental regulations and Airbnb license requirements directly with local government authorities for Cachoeira do Sul to ensure full compliance before hosting.
(Source: AirROI data, 2026, finding no licensed listings among those analyzed)
Top Performing Airbnb Properties in Cachoeira do Sul (2026)
Benchmark your potential! Explore examples of top-performing Airbnb properties in Cachoeira do Sulbased on Trailing Twelve Month (TTM) revenue. Analyze their characteristics, revenue, occupancy rate, and ADR to understand what drives success in this market.

Large Family House
Entire Place • 3 bedrooms

Cachoeira do Sul Studio - 202
Entire Place • 1 bedroom
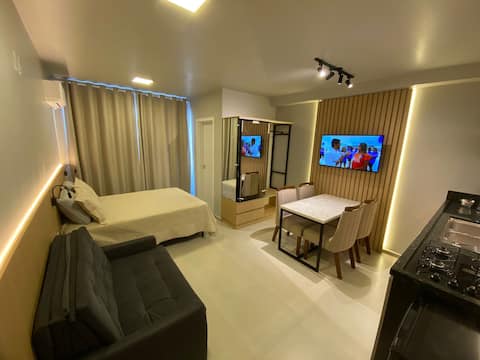
Comfortable high standard studio
Entire Place • 1 bedroom
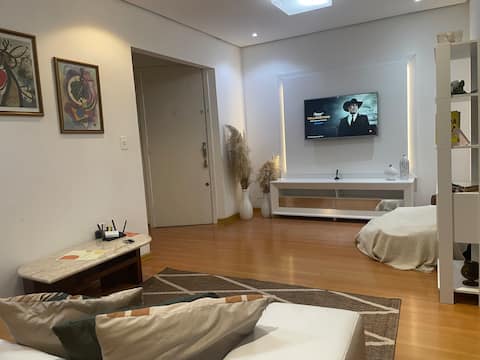
A few steps from downtown: complete and spacious apartment.
Entire Place • 2 bedrooms

Studio Cachoeira do Sul - 409,
Entire Place • 1 bedroom
Full studio in the center.
Entire Place • 1 bedroom
Note: Performance varies based on location, size, amenities, seasonality, and management quality. Data reflects the past 12 months.
Top Performing Airbnb Hosts in Cachoeira do Sul (2026)
Learn from the best! This table showcases top-performing Airbnb hosts in Cachoeira do Sul based on the number of properties managed and estimated total revenue over the past year. Analyze their scale and performance metrics.
| Host Name | Properties | Grossing Revenue | Stay Reviews | Avg Rating |
|---|---|---|---|---|
| Diego | 7 | $32,669 | 270 | 4.95/5.0 |
| Cristiano | 8 | $17,435 | 360 | 4.95/5.0 |
| Ana Rita | 2 | $13,330 | 199 | 4.99/5.0 |
| Danúbia | 2 | $11,007 | 136 | 4.96/5.0 |
| Raquel | 5 | $8,581 | 126 | 4.81/5.0 |
| Luciano | 1 | $8,271 | 81 | 4.93/5.0 |
| Taiana | 2 | $6,781 | 150 | 4.86/5.0 |
| Cristina | 1 | $6,337 | 45 | 4.98/5.0 |
| Nubia | 1 | $5,632 | 54 | 5.00/5.0 |
| Letícia | 2 | $5,589 | 45 | 4.94/5.0 |
Analyzing the strategies of top hosts, such as their property selection, pricing, and guest communication, can offer valuable lessons for optimizing your own Airbnb operations in Cachoeira do Sul.
Dive Deeper: Advanced Cachoeira do Sul STR Market Data (2026)
Ready to unlock more insights? AirROI provides access to advanced metrics and comprehensive Airbnb data for Cachoeira do Sul. Explore detailed analytics beyond this report to refine your investment strategy, optimize pricing, and maximize your vacation rental profits.
Explore Advanced MetricsCachoeira do Sul Short-Term Rental Market Composition (2026): Property & Room Types
Room Type Distribution
Property Type Distribution
Market Composition Insights for Cachoeira do Sul
- The Cachoeira do Sul Airbnb market composition is heavily skewed towards Entire Home/Apt listings, which make up 91.1% of the 56 active rentals. This indicates strong guest preference for privacy and space.
- Looking at the property type distribution in Cachoeira do Sul, Apartment/Condo properties are the most common (64.3%), reflecting the local real estate landscape.
- Houses represent a significant 30.4% portion, catering likely to families or larger groups.
- Smaller segments like hotel/boutique, unique stays (combined 5.4%) offer potential for unique stay experiences.
Cachoeira do Sul Airbnb Room Capacity Analysis (2026): Bedroom Distribution
Distribution of Listings by Number of Bedrooms
Room Capacity Insights for Cachoeira do Sul
- The dominant room capacity in Cachoeira do Sul is 1 bedroom listings, making up 60.7% of the market. This suggests a strong demand for properties suitable for couples or solo travelers.
- Together, 1 bedroom and 2 bedrooms properties represent 78.6% of the active Airbnb listings in Cachoeira do Sul, indicating a high concentration in these sizes.
- With over half the market (60.7%) consisting of studios or 1-bedroom units, Cachoeira do Sul is particularly well-suited for individuals or couples.
- Listings with 3+ bedrooms (9.0%) represent a smaller niche, potentially indicating an underserved market for larger group accommodations in Cachoeira do Sul.
Cachoeira do Sul Vacation Rental Guest Capacity Trends (2026)
Distribution of Listings by Guest Capacity
Guest Capacity Insights for Cachoeira do Sul
- The most common guest capacity trend in Cachoeira do Sul vacation rentals is listings accommodating 4 guests (39.3%). This suggests the primary traveler segment is likely small families or groups.
- Properties designed for 4 guests and 2 guests dominate the Cachoeira do Sul STR market, accounting for 58.9% of listings.
- On average, properties in Cachoeira do Sul are equipped to host 3.5 guests.
Cachoeira do Sul Airbnb Booking Patterns (2026): Available vs. Booked Days
Available Days Distribution
Booked Days Distribution
Booking Pattern Insights for Cachoeira do Sul
- The most common availability pattern in Cachoeira do Sul falls within the 271-366 days range, representing 58.9% of listings. This suggests many properties have significant open periods on their calendars.
- Approximately 89.3% of listings show high availability (181+ days open annually), indicating potential for increased bookings or specific owner usage patterns.
- For booked days, the 31-90 days range is most frequent in Cachoeira do Sul (37.5%), reflecting common guest stay durations or potential owner blocking patterns.
- A notable 12.5% of properties secure long booking periods (181+ days booked per year), highlighting successful long-term rental strategies or significant owner usage.
Cachoeira do Sul Airbnb Minimum Stay Requirements Analysis
Distribution of Listings by Minimum Night Requirement
1 Night
42 listings
75% of total
2 Nights
7 listings
12.5% of total
30+ Nights
7 listings
12.5% of total
Key Insights
- The most prevalent minimum stay requirement in Cachoeira do Sul is 1 Night, adopted by 75% of listings. This highlights the market's preference for shorter, flexible bookings.
- A strong majority (87.5%) of the Cachoeira do Sul Airbnb data shows acceptance of very short stays (1-2 nights), indicating a dynamic, high-turnover market.
- A significant segment (12.5%) caters to monthly stays (30+ nights) in Cachoeira do Sul, pointing to opportunities in the extended-stay market.
Recommendations
- Align with the market by considering a 1 Night minimum stay, as 75% of Cachoeira do Sul hosts use this setting.
- Explore offering discounts for stays of 30+ nights to attract the 12.5% of the market seeking extended stays.
- Adjust minimum nights based on seasonality – potentially shorter during low season and longer during peak demand periods in Cachoeira do Sul.
Cachoeira do Sul Airbnb Cancellation Policy Trends Analysis (2026)
Flexible
42 listings
75% of total
Moderate
9 listings
16.1% of total
Firm
3 listings
5.4% of total
Strict
2 listings
3.6% of total
Cancellation Policy Insights for Cachoeira do Sul
- The prevailing Airbnb cancellation policy trend in Cachoeira do Sul is Flexible, used by 75% of listings.
- The market strongly favors guest-friendly terms, with 91.1% of listings offering Flexible or Moderate policies. This suggests guests in Cachoeira do Sul may expect booking flexibility.
- Strict cancellation policies are quite rare (3.6%), potentially making listings with this policy less competitive unless justified by high demand or property type.
Recommendations for Hosts
- Consider adopting a Flexible policy to align with the 75% market standard in Cachoeira do Sul.
- Given the high prevalence of Flexible policies (75%), offering this can enhance booking appeal, especially during shoulder seasons.
- Using a Strict policy might deter some guests, as only 3.6% of listings use it. Evaluate if potential revenue protection outweighs possible lower booking rates.
- Regularly review your cancellation policy against competitors and market demand shifts in Cachoeira do Sul.
Cachoeira do Sul STR Booking Lead Time Analysis (2026)
Average Booking Lead Time by Month
Booking Lead Time Insights for Cachoeira do Sul
- The overall average booking lead time for vacation rentals in Cachoeira do Sul is 12 days.
- Guests book furthest in advance for stays during January (average 24 days), likely coinciding with peak travel demand or local events.
- The shortest booking windows occur for stays in July (average 8 days), indicating more last-minute travel plans during this time.
- Seasonally, Winter (16 days avg.) sees the longest lead times, while Spring (9 days avg.) has the shortest, reflecting typical travel planning cycles.
Recommendations for Hosts
- Use the overall average lead time (12 days) as a baseline for your pricing and availability strategy in Cachoeira do Sul.
- For January stays, consider implementing length-of-stay discounts or slightly higher rates for bookings made less than 24 days out to capitalize on advance planning.
- Target marketing efforts for the Winter season well in advance (at least 16 days) to capture early planners.
- Monitor your own booking lead times against these Cachoeira do Sul averages to identify opportunities for dynamic pricing adjustments.
Popular & Essential Airbnb Amenities in Cachoeira do Sul (2026)
Amenity Prevalence
Amenity Insights for Cachoeira do Sul
- Essential amenities in Cachoeira do Sul that guests expect include: Wifi, TV, Air conditioning. Lacking these (any) could significantly impact bookings.
- Popular amenities like Kitchen, Free parking on premises, Dishes and silverware are common but not universal. Offering these can provide a competitive edge.
Recommendations for Hosts
- Ensure your listing includes all essential amenities for Cachoeira do Sul: Wifi, TV, Air conditioning.
- Prioritize adding missing essentials: TV, Air conditioning.
- Consider adding popular differentiators like Kitchen or Free parking on premises to increase appeal.
- Highlight unique or less common amenities you offer (e.g., hot tub, dedicated workspace, EV charger) in your listing description and photos.
- Regularly check competitor amenities in Cachoeira do Sul to stay competitive.
Cachoeira do Sul Airbnb Guest Demographics & Profile Analysis (2026)
Guest Profile Summary for Cachoeira do Sul
- The typical guest profile for Airbnb in Cachoeira do Sul consists of primarily domestic travelers (95%), often arriving from nearby Rio Grande do Sul, typically belonging to the Post-2000s (Gen Z/Alpha) group (50%), primarily speaking Portuguese or English.
- Domestic travelers account for 95.1% of guests.
- Key international markets include Brazil (95.1%) and Argentina (1.2%).
- Top languages spoken are Portuguese (49.6%) followed by English (26.3%).
- A significant demographic segment is the Post-2000s (Gen Z/Alpha) group, representing 50% of guests.
Recommendations for Hosts
- Target domestic marketing efforts towards travelers from Rio Grande do Sul and Porto Alegre.
- Tailor amenities and listing descriptions to appeal to the dominant Post-2000s (Gen Z/Alpha) demographic (e.g., highlight fast WiFi, smart home features, local guides).
- Highlight unique local experiences or amenities relevant to the primary guest profile.
- Consider seasonal promotions aligned with peak travel times for key origin markets.
Nearby Short-Term Rental Market Comparison
How does the Cachoeira do Sul Airbnb market stack up against its neighbors? Compare key performance metrics like average monthly revenue, ADR, and occupancy rates in surrounding areas to understand the broader regional STR landscape.
| Market | Active Properties | Monthly Revenue | Daily Rate | Avg. Occupancy |
|---|---|---|---|---|
| Pinto Bandeira | 20 | $1,439 | $161.98 | 31% |
| Flores da Cunha | 16 | $891 | $71.27 | 44% |
| Linha Nova | 10 | $890 | $86.73 | 37% |
| Monte Belo do Sul | 14 | $768 | $96.62 | 32% |
| Picada Café | 24 | $766 | $97.19 | 32% |
| Garibaldi | 66 | $672 | $90.05 | 30% |
| Carlos Barbosa | 31 | $631 | $78.33 | 32% |
| Itaara | 38 | $607 | $98.91 | 28% |
| Nova Petrópolis | 239 | $589 | $66.80 | 30% |
| Eldorado do Sul | 14 | $515 | $97.88 | 23% |