Balneário Pinhal Airbnb Market Analysis 2026: Short Term Rental Data & Vacation Rental Statistics in Rio Grande do Sul, Brazil
Is Airbnb profitable in Balneário Pinhal in 2026? Explore comprehensive Airbnb analytics for Balneário Pinhal, Rio Grande do Sul, Brazil to uncover income potential. This 2026 STR market report for Balneário Pinhal, based on AirROI data from February 2025 to January 2026, reveals key trends in the niche market of 52 active listings.
Whether you're considering an Airbnb investment in Balneário Pinhal, optimizing your existing vacation rental, or exploring rental arbitrage opportunities, understanding the Balneário Pinhal Airbnb data is crucial. Leveraging the low regulation environment is key to maximizing your short term rental income potential. Let's dive into the specifics.
Key Balneário Pinhal Airbnb Performance Metrics Overview
Monthly Airbnb Revenue Variations & Income Potential in Balneário Pinhal (2026)
Understanding the monthly revenue variations for Airbnb listings in Balneário Pinhal is key to maximizing your short term rental income potential. Seasonality significantly impacts earnings. Our analysis, based on data from the past 12 months, shows that the peak revenue month for STRs in Balneário Pinhal is typically February, while August often presents the lowest earnings, highlighting opportunities for strategic pricing adjustments during shoulder and low seasons. Explore the typical Airbnb income in Balneário Pinhal across different performance tiers:
- Best-in-class properties (Top 10%) achieve $571+ monthly, often utilizing dynamic pricing and superior guest experiences.
- Strong performing properties (Top 25%) earn $323 or more, indicating effective management and desirable locations/amenities.
- Typical properties (Median) generate around $189 per month, representing the average market performance.
- Entry-level properties (Bottom 25%) see earnings around $96, often with potential for optimization.
Average Monthly Airbnb Earnings Trend in Balneário Pinhal
Balneário Pinhal Airbnb Occupancy Rate Trends (2026)
Maximize your bookings by understanding the Balneário Pinhal STR occupancy trends. Seasonal demand shifts significantly influence how often properties are booked. Typically, Februarysees the highest demand (peak season occupancy), while August experiences the lowest (low season). Effective strategies, like adjusting minimum stays or offering promotions, can boost occupancy during slower periods. Here's how different property tiers perform in Balneário Pinhal:
- Best-in-class properties (Top 10%) achieve 36%+ occupancy, indicating high desirability and potentially optimized availability.
- Strong performing properties (Top 25%) maintain 24% or higher occupancy, suggesting good market fit and guest satisfaction.
- Typical properties (Median) have an occupancy rate around 14%.
- Entry-level properties (Bottom 25%) average 9% occupancy, potentially facing higher vacancy.
Average Monthly Occupancy Rate Trend in Balneário Pinhal
Average Daily Rate (ADR) Airbnb Trends in Balneário Pinhal (2026)
Effective short term rental pricing strategy in Balneário Pinhal involves understanding monthly ADR fluctuations. The Average Daily Rate (ADR) for Airbnb in Balneário Pinhal typically peaks in December and dips lowest during April. Leveraging Airbnb dynamic pricing tools or strategies based on this seasonality can significantly boost revenue. Here's a look at the typical nightly rates achieved:
- Best-in-class properties (Top 10%) command rates of $70+ per night, often due to premium features or locations.
- Strong performing properties (Top 25%) achieve nightly rates of $51 or more.
- Typical properties (Median) charge around $39 per night.
- Entry-level properties (Bottom 25%) earn around $29 per night.
Average Daily Rate (ADR) Trend by Month in Balneário Pinhal
Get Live Balneário Pinhal Market Intelligence 👇

Explore Real-time Analytics
Airbnb Seasonality Analysis & Trends in Balneário Pinhal (2026)
Peak Season (February, January, March)
- Revenue averages $509 per month
- Occupancy rates average 37.0%
- Daily rates average $44
Shoulder Season
- Revenue averages $219 per month
- Occupancy maintains around 13.9%
- Daily rates hold near $44
Low Season (August, October, November)
- Revenue drops to average $91 per month
- Occupancy decreases to average 6.9%
- Daily rates adjust to average $46
Seasonality Insights for Balneário Pinhal
- The Airbnb seasonality in Balneário Pinhal shows highly seasonal trends requiring careful strategy. While the sections above show seasonal averages, it's also insightful to look at the extremes:
- During the high season, the absolute peak month showcases Balneário Pinhal's highest earning potential, with monthly revenues capable of climbing to $587, occupancy reaching a high of 47.9%, and ADRs peaking at $48.
- Conversely, the slowest single month of the year, typically falling within the low season, marks the market's lowest point. In this month, revenue might dip to $90, occupancy could drop to 5.9%, and ADRs may adjust down to $41.
- Understanding both the seasonal averages and these monthly peaks and troughs in revenue, occupancy, and ADR is crucial for maximizing your Airbnb profit potential in Balneário Pinhal.
Seasonal Strategies for Maximizing Profit
- Peak Season: Maximize revenue through premium pricing and potentially longer minimum stays. Ensure high availability.
- Low Season: Offer competitive pricing, special promotions (e.g., extended stay discounts), and flexible cancellation policies. Target off-season travelers like remote workers or budget-conscious guests.
- Shoulder Seasons: Implement dynamic pricing that balances peak and low rates. Target weekend travelers or specific events. Offer slightly more flexible terms than peak season.
- Regularly analyze your own performance against these Balneário Pinhal seasonality benchmarks and adjust your pricing and availability strategy accordingly.
Best Areas for Airbnb Investment in Balneário Pinhal (2026)
Exploring the top neighborhoods for short-term rentals in Balneário Pinhal? This section highlights key areas, outlining why they are attractive for hosts and guests, along with notable local attractions. Consider these locations based on your target guest profile and investment strategy.
| Neighborhood / Area | Why Host Here? (Target Guests & Appeal) | Key Attractions & Landmarks |
|---|---|---|
| Praia de Balneário Pinhal | A beautiful beach known for its fine sand and clear waters, making it an ideal spot for tourists looking for a beach getaway. Activities like sunbathing, swimming, and beach sports are popular here. | Balneário Pinhal Beach, Water sports facilities, Local beach bars, Surfing spots, Scenic dunes |
| Centro de Balneário Pinhal | The central area provides easy access to shops, restaurants, and services. It's a hub for tourists looking to experience local culture and cuisine. | Local markets, Restaurants, Shops, Artisan crafts, Cafes |
| Lagoa do Peixe National Park | A natural reserve with beautiful landscapes and a variety of wildlife, attracting nature lovers and bird watchers. Offers opportunities for eco-tourism and outdoor activities. | Bird watching, Hiking trails, Scenic views, Fishing, Kayaking |
| Praia do Lami | A less crowded beach option known for its tranquility, ideal for families and those looking for a peaceful vacation atmosphere. | Calm waters, Fishing spots, Beachside picnics, Natural beauty, Children-friendly areas |
| Praia de Araçá | A picturesque beach area with charming local eateries, perfect for travelers seeking an authentic coastal experience. | Local seafood restaurants, Artisan shops, Beachfront activities, Sunset views, Family-friendly environment |
| Balneário Pinhal Eco-Parque | An eco-park offering recreational activities and wellness experiences, attracting health-conscious travelers and families. | Walking and cycling paths, Picnic areas, Outdoor fitness activities, Nature observation, Children's playgrounds |
| Pousada Beach | Known for its beautiful lodges and quaint accommodations, this area appeals to those looking for a cozy and relaxing stay by the beach. | Charming lodges, Quiet beaches, Cozy cafes, Local art, Sunset viewing spots |
| Balneário Pinhal Boardwalk | A long scenic walkway that provides access along the beach, which is popular for jogging, walking, and cycling; it attracts fitness enthusiasts and leisurely walkers alike. | Scenic ocean views, Local food stalls, Art installations, Fitness areas, Community events |
Understanding Airbnb License Requirements & STR Laws in Balneário Pinhal (2026)
While Balneário Pinhal, Rio Grande do Sul, Brazil currently shows low STR regulations, specific Airbnb license requirements might still exist or change. Always verify the latest short term rental regulations and Airbnb license requirements directly with local government authorities for Balneário Pinhal to ensure full compliance before hosting.
(Source: AirROI data, 2026, finding no licensed listings among those analyzed)
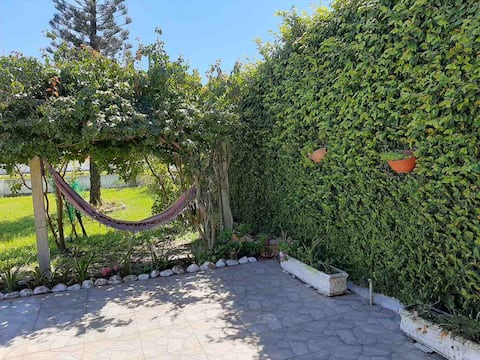
Top Performing Airbnb Properties in Balneário Pinhal (2026)
Benchmark your potential! Explore examples of top-performing Airbnb properties in Balneário Pinhalbased on Trailing Twelve Month (TTM) revenue. Analyze their characteristics, revenue, occupancy rate, and ADR to understand what drives success in this market.
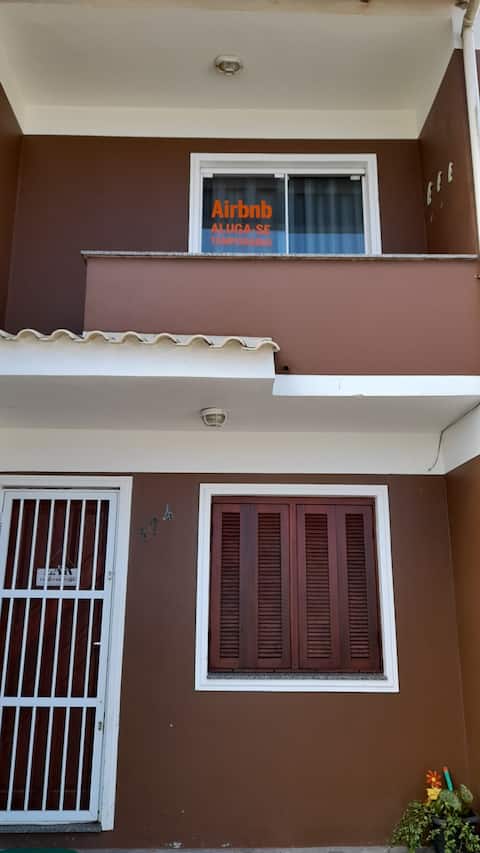
A townhouse one block from the sea, Balneário Pinhal - RS
Entire Place • 2 bedrooms

Beautiful apartment by the sea!
Entire Place • 3 bedrooms

House in Pinhal with pool and fireplace
Entire Place • 3 bedrooms

House with pool, near the seashore.
Entire Place • 4 bedrooms
Big house on the beach, with internet!
Entire Place • 3 bedrooms

Comfortable house on the sea block in Magistério!
Entire Place • 4 bedrooms
Note: Performance varies based on location, size, amenities, seasonality, and management quality. Data reflects the past 12 months.
Top Performing Airbnb Hosts in Balneário Pinhal (2026)
Learn from the best! This table showcases top-performing Airbnb hosts in Balneário Pinhal based on the number of properties managed and estimated total revenue over the past year. Analyze their scale and performance metrics.
| Host Name | Properties | Grossing Revenue | Stay Reviews | Avg Rating |
|---|---|---|---|---|
| Teresinha | 1 | $7,086 | 39 | 4.95/5.0 |
| Denize | 1 | $6,250 | 10 | 4.90/5.0 |
| Everton | 1 | $6,034 | 37 | 4.92/5.0 |
| Julia Alves | 1 | $4,240 | 17 | 4.94/5.0 |
| Carmen Lucia | 1 | $4,175 | 9 | 4.78/5.0 |
| Renata | 1 | $4,026 | 39 | 4.82/5.0 |
| Flávia | 1 | $3,735 | 9 | 4.89/5.0 |
| Catarina | 2 | $3,631 | 57 | 4.83/5.0 |
| Elisabete | 1 | $3,160 | 35 | 4.94/5.0 |
| Janaina Espindola | 1 | $3,146 | 9 | 5.00/5.0 |
Analyzing the strategies of top hosts, such as their property selection, pricing, and guest communication, can offer valuable lessons for optimizing your own Airbnb operations in Balneário Pinhal.
Dive Deeper: Advanced Balneário Pinhal STR Market Data (2026)
Ready to unlock more insights? AirROI provides access to advanced metrics and comprehensive Airbnb data for Balneário Pinhal. Explore detailed analytics beyond this report to refine your investment strategy, optimize pricing, and maximize your vacation rental profits.
Explore Advanced MetricsBalneário Pinhal Short-Term Rental Market Composition (2026): Property & Room Types
Room Type Distribution
Property Type Distribution
Market Composition Insights for Balneário Pinhal
- The Balneário Pinhal Airbnb market composition is heavily skewed towards Entire Home/Apt listings, which make up 92.3% of the 52 active rentals. This indicates strong guest preference for privacy and space.
- Looking at the property type distribution in Balneário Pinhal, House properties are the most common (65.4%), reflecting the local real estate landscape.
- Houses represent a significant 65.4% portion, catering likely to families or larger groups.
- The presence of 5.8% Hotel/Boutique listings indicates integration with traditional hospitality.
- Smaller segments like others, outdoor/unique (combined 3.8%) offer potential for unique stay experiences.
Balneário Pinhal Airbnb Room Capacity Analysis (2026): Bedroom Distribution
Distribution of Listings by Number of Bedrooms
Room Capacity Insights for Balneário Pinhal
- The dominant room capacity in Balneário Pinhal is 2 bedrooms listings, making up 40.4% of the market. This suggests a strong demand for properties suitable for couples or solo travelers.
- Together, 2 bedrooms and 3 bedrooms properties represent 75.0% of the active Airbnb listings in Balneário Pinhal, indicating a high concentration in these sizes.
- A significant 44.2% of listings offer 3+ bedrooms, catering to larger groups and families seeking more space in Balneário Pinhal.
Balneário Pinhal Vacation Rental Guest Capacity Trends (2026)
Distribution of Listings by Guest Capacity
Guest Capacity Insights for Balneário Pinhal
- The most common guest capacity trend in Balneário Pinhal vacation rentals is listings accommodating 8+ guests (28.8%). This suggests the primary traveler segment is likely larger groups.
- Properties designed for 8+ guests and 6 guests dominate the Balneário Pinhal STR market, accounting for 53.8% of listings.
- 63.4% of properties accommodate 6+ guests, serving the market segment for larger families or group travel in Balneário Pinhal.
- On average, properties in Balneário Pinhal are equipped to host 5.8 guests.
Balneário Pinhal Airbnb Booking Patterns (2026): Available vs. Booked Days
Available Days Distribution
Booked Days Distribution
Booking Pattern Insights for Balneário Pinhal
- The most common availability pattern in Balneário Pinhal falls within the 271-366 days range, representing 98.1% of listings. This suggests many properties have significant open periods on their calendars.
- Approximately 100.0% of listings show high availability (181+ days open annually), indicating potential for increased bookings or specific owner usage patterns.
- For booked days, the 1-30 days range is most frequent in Balneário Pinhal (50%), reflecting common guest stay durations or potential owner blocking patterns.
Balneário Pinhal Airbnb Minimum Stay Requirements Analysis
Distribution of Listings by Minimum Night Requirement
1 Night
11 listings
21.2% of total
2 Nights
12 listings
23.1% of total
3 Nights
6 listings
11.5% of total
4-6 Nights
5 listings
9.6% of total
7-29 Nights
2 listings
3.8% of total
30+ Nights
16 listings
30.8% of total
Key Insights
- The most prevalent minimum stay requirement in Balneário Pinhal is 30+ Nights, adopted by 30.8% of listings. This highlights the market's preference for longer commitments.
- A significant segment (30.8%) caters to monthly stays (30+ nights) in Balneário Pinhal, pointing to opportunities in the extended-stay market.
Recommendations
- Align with the market by considering a 30+ Nights minimum stay, as 30.8% of Balneário Pinhal hosts use this setting.
- If feasible, allowing 1-night stays, especially midweek or during low season, could capture last-minute bookings, as only 21.2% currently do.
- Explore offering discounts for stays of 30+ nights to attract the 30.8% of the market seeking extended stays.
- Adjust minimum nights based on seasonality – potentially shorter during low season and longer during peak demand periods in Balneário Pinhal.
Balneário Pinhal Airbnb Cancellation Policy Trends Analysis (2026)
Limited
1 listings
1.9% of total
Flexible
13 listings
25% of total
Moderate
10 listings
19.2% of total
Firm
26 listings
50% of total
Strict
2 listings
3.8% of total
Cancellation Policy Insights for Balneário Pinhal
- The prevailing Airbnb cancellation policy trend in Balneário Pinhal is Firm, used by 50% of listings.
- A majority (53.8%) of hosts in Balneário Pinhal utilize Firm or Strict policies, indicating a market where hosts prioritize booking security.
- Strict cancellation policies are quite rare (3.8%), potentially making listings with this policy less competitive unless justified by high demand or property type.
Recommendations for Hosts
- Consider adopting a Firm policy to align with the 50% market standard in Balneário Pinhal.
- Using a Strict policy might deter some guests, as only 3.8% of listings use it. Evaluate if potential revenue protection outweighs possible lower booking rates.
- Regularly review your cancellation policy against competitors and market demand shifts in Balneário Pinhal.
Balneário Pinhal STR Booking Lead Time Analysis (2026)
Average Booking Lead Time by Month
Booking Lead Time Insights for Balneário Pinhal
- The overall average booking lead time for vacation rentals in Balneário Pinhal is 27 days.
- Guests book furthest in advance for stays during December (average 36 days), likely coinciding with peak travel demand or local events.
- The shortest booking windows occur for stays in June (average 1 days), indicating more last-minute travel plans during this time.
- Seasonally, Winter (33 days avg.) sees the longest lead times, while Summer (4 days avg.) has the shortest, reflecting typical travel planning cycles.
Recommendations for Hosts
- Use the overall average lead time (27 days) as a baseline for your pricing and availability strategy in Balneário Pinhal.
- During June, focus on last-minute booking availability and promotions, as guests book with very short notice (1 days avg.).
- Target marketing efforts for the Winter season well in advance (at least 33 days) to capture early planners.
- Monitor your own booking lead times against these Balneário Pinhal averages to identify opportunities for dynamic pricing adjustments.
Popular & Essential Airbnb Amenities in Balneário Pinhal (2026)
Amenity Prevalence
Amenity Insights for Balneário Pinhal
- Popular amenities like Kitchen, Free parking on premises, TV are common but not universal. Offering these can provide a competitive edge.
- Warning: Wifi is not universally provided but is considered essential globally. Ensure reliable Wifi is offered.
Recommendations for Hosts
- Consider adding popular differentiators like Kitchen or Free parking on premises to increase appeal.
- Highlight unique or less common amenities you offer (e.g., hot tub, dedicated workspace, EV charger) in your listing description and photos.
- Regularly check competitor amenities in Balneário Pinhal to stay competitive.
Balneário Pinhal Airbnb Guest Demographics & Profile Analysis (2026)
Guest Profile Summary for Balneário Pinhal
- The typical guest profile for Airbnb in Balneário Pinhal consists of primarily domestic travelers (100%), often arriving from nearby Porto Alegre, typically belonging to the Post-2000s (Gen Z/Alpha) group (50%), primarily speaking Portuguese or Spanish.
- Domestic travelers account for 100.0% of guests.
- Top languages spoken are Portuguese (53.8%) followed by Spanish (23.1%).
- A significant demographic segment is the Post-2000s (Gen Z/Alpha) group, representing 50% of guests.
Recommendations for Hosts
- Target domestic marketing efforts towards travelers from Porto Alegre and Rio Grande do Sul.
- Tailor amenities and listing descriptions to appeal to the dominant Post-2000s (Gen Z/Alpha) demographic (e.g., highlight fast WiFi, smart home features, local guides).
- Highlight unique local experiences or amenities relevant to the primary guest profile.
- Consider seasonal promotions aligned with peak travel times for key origin markets.
Nearby Short-Term Rental Market Comparison
How does the Balneário Pinhal Airbnb market stack up against its neighbors? Compare key performance metrics like average monthly revenue, ADR, and occupancy rates in surrounding areas to understand the broader regional STR landscape.
| Market | Active Properties | Monthly Revenue | Daily Rate | Avg. Occupancy |
|---|---|---|---|---|
| Pinto Bandeira | 20 | $1,439 | $161.98 | 31% |
| Flores da Cunha | 16 | $891 | $71.27 | 44% |
| Linha Nova | 10 | $890 | $86.73 | 37% |
| Gramado | 3,177 | $778 | $93.36 | 36% |
| Monte Belo do Sul | 14 | $768 | $96.62 | 32% |
| Picada Café | 24 | $766 | $97.19 | 32% |
| Garibaldi | 66 | $672 | $90.05 | 30% |
| Santa Maria do Herval | 39 | $638 | $67.87 | 33% |
| Carlos Barbosa | 31 | $631 | $78.33 | 32% |
| Canela | 1,145 | $604 | $80.61 | 32% |