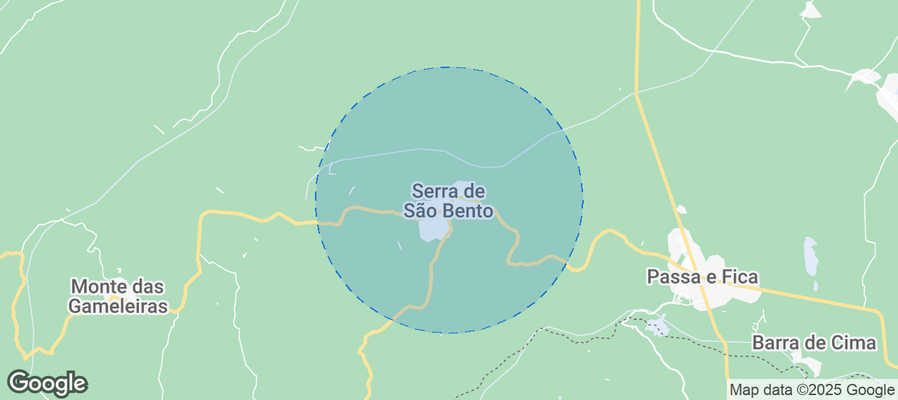
Serra de São Bento Airbnb Market Analysis 2026: Short Term Rental Data & Vacation Rental Statistics in Rio Grande do Norte, Brazil
Is Airbnb profitable in Serra de São Bento in 2026? Explore comprehensive Airbnb analytics for Serra de São Bento, Rio Grande do Norte, Brazil to uncover income potential. This 2026 STR market report for Serra de São Bento, based on AirROI data from February 2025 to January 2026, reveals key trends in the niche market of 22 active listings.
Whether you're considering an Airbnb investment in Serra de São Bento, optimizing your existing vacation rental, or exploring rental arbitrage opportunities, understanding the Serra de São Bento Airbnb data is crucial. Leveraging the low regulation environment is key to maximizing your short term rental income potential. Let's dive into the specifics.
Key Serra de São Bento Airbnb Performance Metrics Overview
Monthly Airbnb Revenue Variations & Income Potential in Serra de São Bento (2026)
Understanding the monthly revenue variations for Airbnb listings in Serra de São Bento is key to maximizing your short term rental income potential. Seasonality significantly impacts earnings. Our analysis, based on data from the past 12 months, shows that the peak revenue month for STRs in Serra de São Bento is typically March, while December often presents the lowest earnings, highlighting opportunities for strategic pricing adjustments during shoulder and low seasons. Explore the typical Airbnb income in Serra de São Bento across different performance tiers:
- Best-in-class properties (Top 10%) achieve $1,731+ monthly, often utilizing dynamic pricing and superior guest experiences.
- Strong performing properties (Top 25%) earn $664 or more, indicating effective management and desirable locations/amenities.
- Typical properties (Median) generate around $307 per month, representing the average market performance.
- Entry-level properties (Bottom 25%) see earnings around $165, often with potential for optimization.
Average Monthly Airbnb Earnings Trend in Serra de São Bento
Serra de São Bento Airbnb Occupancy Rate Trends (2026)
Maximize your bookings by understanding the Serra de São Bento STR occupancy trends. Seasonal demand shifts significantly influence how often properties are booked. Typically, Marchsees the highest demand (peak season occupancy), while December experiences the lowest (low season). Effective strategies, like adjusting minimum stays or offering promotions, can boost occupancy during slower periods. Here's how different property tiers perform in Serra de São Bento:
- Best-in-class properties (Top 10%) achieve 43%+ occupancy, indicating high desirability and potentially optimized availability.
- Strong performing properties (Top 25%) maintain 26% or higher occupancy, suggesting good market fit and guest satisfaction.
- Typical properties (Median) have an occupancy rate around 17%.
- Entry-level properties (Bottom 25%) average 9% occupancy, potentially facing higher vacancy.
Average Monthly Occupancy Rate Trend in Serra de São Bento
Average Daily Rate (ADR) Airbnb Trends in Serra de São Bento (2026)
Effective short term rental pricing strategy in Serra de São Bento involves understanding monthly ADR fluctuations. The Average Daily Rate (ADR) for Airbnb in Serra de São Bento typically peaks in August and dips lowest during January. Leveraging Airbnb dynamic pricing tools or strategies based on this seasonality can significantly boost revenue. Here's a look at the typical nightly rates achieved:
- Best-in-class properties (Top 10%) command rates of $156+ per night, often due to premium features or locations.
- Strong performing properties (Top 25%) achieve nightly rates of $106 or more.
- Typical properties (Median) charge around $54 per night.
- Entry-level properties (Bottom 25%) earn around $41 per night.
Average Daily Rate (ADR) Trend by Month in Serra de São Bento
Get Live Serra de São Bento Market Intelligence 👇
Explore Real-time Analytics
Airbnb Seasonality Analysis & Trends in Serra de São Bento (2026)
Peak Season (March, June, July)
- Revenue averages $811 per month
- Occupancy rates average 26.1%
- Daily rates average $79
Shoulder Season
- Revenue averages $615 per month
- Occupancy maintains around 20.7%
- Daily rates hold near $76
Low Season (January, February, December)
- Revenue drops to average $437 per month
- Occupancy decreases to average 16.6%
- Daily rates adjust to average $73
Seasonality Insights for Serra de São Bento
- The Airbnb seasonality in Serra de São Bento shows highly seasonal trends requiring careful strategy. While the sections above show seasonal averages, it's also insightful to look at the extremes:
- During the high season, the absolute peak month showcases Serra de São Bento's highest earning potential, with monthly revenues capable of climbing to $954, occupancy reaching a high of 27.9%, and ADRs peaking at $82.
- Conversely, the slowest single month of the year, typically falling within the low season, marks the market's lowest point. In this month, revenue might dip to $362, occupancy could drop to 11.8%, and ADRs may adjust down to $71.
- Understanding both the seasonal averages and these monthly peaks and troughs in revenue, occupancy, and ADR is crucial for maximizing your Airbnb profit potential in Serra de São Bento.
Seasonal Strategies for Maximizing Profit
- Peak Season: Maximize revenue through premium pricing and potentially longer minimum stays. Ensure high availability.
- Low Season: Offer competitive pricing, special promotions (e.g., extended stay discounts), and flexible cancellation policies. Target off-season travelers like remote workers or budget-conscious guests.
- Shoulder Seasons: Implement dynamic pricing that balances peak and low rates. Target weekend travelers or specific events. Offer slightly more flexible terms than peak season.
- Regularly analyze your own performance against these Serra de São Bento seasonality benchmarks and adjust your pricing and availability strategy accordingly.
Best Areas for Airbnb Investment in Serra de São Bento (2026)
Exploring the top neighborhoods for short-term rentals in Serra de São Bento? This section highlights key areas, outlining why they are attractive for hosts and guests, along with notable local attractions. Consider these locations based on your target guest profile and investment strategy.
| Neighborhood / Area | Why Host Here? (Target Guests & Appeal) | Key Attractions & Landmarks |
|---|---|---|
| Centro de Serra de São Bento | The center of Serra de São Bento is vibrant and full of local culture. It's ideal for guests who want to experience the local life, with easy access to shops and restaurants. | Praça de Eventos, Igreja Matriz de São Bento, Feira Livre, Shopping local, Gastronomia regional |
| Serra do Teixeira | A beautiful natural area popular for eco-tourism, hiking, and outdoor activities. Perfect for guests who love nature and tranquility. | Caminhadas nas montanhas, Vista das serras, Cascatas locais, Trilhas, Mirantes |
| Parque de Exposições | A popular spot during exhibitions and cultural events, attracting many visitors throughout the year. Ideal for short-term rentals during events. | Feiras de produtos locais, Eventos culturais, Exposições, Praça de Alimentação, Shows ao vivo |
| Cerca do Vale | This area offers stunning views and is known for its rural charm. It is becoming popular with tourists seeking a quiet retreat. | Mirantes, Atividades rurais, Passeios a cavalo, Casas de campo, Natureza preservada |
| Cascatas do Riachão | Famous for its beautiful waterfalls, this area attracts nature lovers and those looking for adventure amidst stunning scenery. | Caminhadas até as cascatas, Banho de cachoeira, Piqueniques, Natureza exuberante, Fotografia de paisagens |
| Caminho das Pedras | A scenic route that showcases the local landscape and history, appealing to tourists interested in culture and history. | Trilhas históricas, Patrimônio cultural, Artesanatos locais, Visitas guiadas, História da região |
| Mirante do Pôr do Sol | A popular sunset viewpoint, attracting visitors at the end of the day for stunning views and relaxation. Great for romantic getaways. | Pôr do sol deslumbrante, Área de piquenique, Fotografia, Relaxamento ao ar livre, Cafés nas proximidades |
| Zona Rural | The rural zone offers a true escape from city life, with opportunities for tourists to experience farm life and local agriculture. | Cultura agrícola, Fazendas locais, Oferecimento de produtos frescos, Atividades ao ar livre, Experiências rurais |
Understanding Airbnb License Requirements & STR Laws in Serra de São Bento (2026)
While Serra de São Bento, Rio Grande do Norte, Brazil currently shows low STR regulations, specific Airbnb license requirements might still exist or change. Always verify the latest short term rental regulations and Airbnb license requirements directly with local government authorities for Serra de São Bento to ensure full compliance before hosting.
(Source: AirROI data, 2026, finding no licensed listings among those analyzed)
Top Performing Airbnb Properties in Serra de São Bento (2026)
Benchmark your potential! Explore examples of top-performing Airbnb properties in Serra de São Bentobased on Trailing Twelve Month (TTM) revenue. Analyze their characteristics, revenue, occupancy rate, and ADR to understand what drives success in this market.
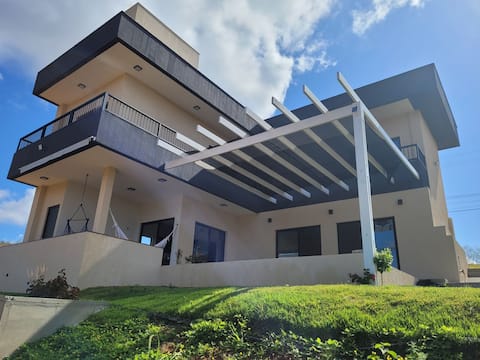
House for families with children
Entire Place • 3 bedrooms

Lajeiro's House
Entire Place • 2 bedrooms
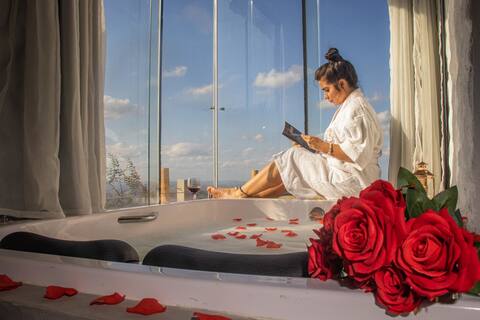
Romantic Chalet with Whirlpool and Breakfast
Entire Place • 1 bedroom

Cabanna Bella Vista Premium Hosting in Serra
Entire Place • 1 bedroom
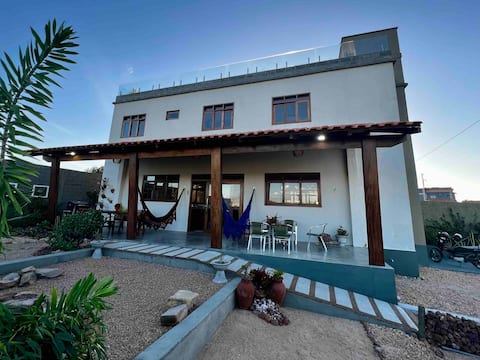
Casa da Laje - Rooftop in EV Condominium
Entire Place • 3 bedrooms

ACASA SSB with amazing view
Entire Place • 3 bedrooms
Note: Performance varies based on location, size, amenities, seasonality, and management quality. Data reflects the past 12 months.
Top Performing Airbnb Hosts in Serra de São Bento (2026)
Learn from the best! This table showcases top-performing Airbnb hosts in Serra de São Bento based on the number of properties managed and estimated total revenue over the past year. Analyze their scale and performance metrics.
| Host Name | Properties | Grossing Revenue | Stay Reviews | Avg Rating |
|---|---|---|---|---|
| Luana | 1 | $25,278 | 22 | 5.00/5.0 |
| Mari Tavares | 1 | $18,112 | 6 | 4.83/5.0 |
| Michele | 1 | $12,176 | 21 | 5.00/5.0 |
| Glória | 1 | $11,399 | 6 | 5.00/5.0 |
| Isabelle | 3 | $8,775 | 39 | 5.00/5.0 |
| Anna Beatriz | 3 | $8,704 | 38 | 4.72/5.0 |
| Rossana | 1 | $8,643 | 30 | 4.93/5.0 |
| Marcelo | 1 | $7,019 | 30 | 4.87/5.0 |
| Felipe | 1 | $3,614 | 10 | 5.00/5.0 |
| José Girlenio | 1 | $2,793 | 4 | 4.75/5.0 |
Analyzing the strategies of top hosts, such as their property selection, pricing, and guest communication, can offer valuable lessons for optimizing your own Airbnb operations in Serra de São Bento.
Dive Deeper: Advanced Serra de São Bento STR Market Data (2026)
Ready to unlock more insights? AirROI provides access to advanced metrics and comprehensive Airbnb data for Serra de São Bento. Explore detailed analytics beyond this report to refine your investment strategy, optimize pricing, and maximize your vacation rental profits.
Explore Advanced MetricsSerra de São Bento Short-Term Rental Market Composition (2026): Property & Room Types
Room Type Distribution
Property Type Distribution
Market Composition Insights for Serra de São Bento
- The Serra de São Bento Airbnb market composition is heavily skewed towards Entire Home/Apt listings, which make up 63.6% of the 22 active rentals. This indicates strong guest preference for privacy and space.
- However, a notable 36.4% share for Private Rooms suggests opportunities for budget-conscious travelers or hosts renting out spare rooms.
- Looking at the property type distribution in Serra de São Bento, House properties are the most common (50%), reflecting the local real estate landscape.
- Houses represent a significant 50% portion, catering likely to families or larger groups.
- The presence of 31.8% Hotel/Boutique listings indicates integration with traditional hospitality.
- Smaller segments like apartment/condo (combined 4.5%) offer potential for unique stay experiences.
Serra de São Bento Airbnb Room Capacity Analysis (2026): Bedroom Distribution
Distribution of Listings by Number of Bedrooms
Room Capacity Insights for Serra de São Bento
- The dominant room capacity in Serra de São Bento is 3 bedrooms listings, making up 27.3% of the market. This suggests a strong demand for properties suitable for families or small groups.
- Together, 3 bedrooms and 1 bedroom properties represent 54.6% of the active Airbnb listings in Serra de São Bento, indicating a high concentration in these sizes.
- A significant 27.3% of listings offer 3+ bedrooms, catering to larger groups and families seeking more space in Serra de São Bento.
Serra de São Bento Vacation Rental Guest Capacity Trends (2026)
Distribution of Listings by Guest Capacity
Guest Capacity Insights for Serra de São Bento
- The most common guest capacity trend in Serra de São Bento vacation rentals is listings accommodating 8+ guests (18.2%). This suggests the primary traveler segment is likely larger groups.
- Properties designed for 8+ guests and 2 guests dominate the Serra de São Bento STR market, accounting for 36.4% of listings.
- 36.3% of properties accommodate 6+ guests, serving the market segment for larger families or group travel in Serra de São Bento.
- On average, properties in Serra de São Bento are equipped to host 3.3 guests.
Serra de São Bento Airbnb Booking Patterns (2026): Available vs. Booked Days
Available Days Distribution
Booked Days Distribution
Booking Pattern Insights for Serra de São Bento
- The most common availability pattern in Serra de São Bento falls within the 271-366 days range, representing 81.8% of listings. This suggests many properties have significant open periods on their calendars.
- Approximately 100.0% of listings show high availability (181+ days open annually), indicating potential for increased bookings or specific owner usage patterns.
- For booked days, the 31-90 days range is most frequent in Serra de São Bento (59.1%), reflecting common guest stay durations or potential owner blocking patterns.
Serra de São Bento Airbnb Minimum Stay Requirements Analysis
Distribution of Listings by Minimum Night Requirement
1 Night
12 listings
54.5% of total
2 Nights
4 listings
18.2% of total
30+ Nights
6 listings
27.3% of total
Key Insights
- The most prevalent minimum stay requirement in Serra de São Bento is 1 Night, adopted by 54.5% of listings. This highlights the market's preference for shorter, flexible bookings.
- A strong majority (72.7%) of the Serra de São Bento Airbnb data shows acceptance of very short stays (1-2 nights), indicating a dynamic, high-turnover market.
- A significant segment (27.3%) caters to monthly stays (30+ nights) in Serra de São Bento, pointing to opportunities in the extended-stay market.
Recommendations
- Align with the market by considering a 1 Night minimum stay, as 54.5% of Serra de São Bento hosts use this setting.
- Explore offering discounts for stays of 30+ nights to attract the 27.3% of the market seeking extended stays.
- Adjust minimum nights based on seasonality – potentially shorter during low season and longer during peak demand periods in Serra de São Bento.
Serra de São Bento Airbnb Cancellation Policy Trends Analysis (2026)
Flexible
7 listings
31.8% of total
Moderate
8 listings
36.4% of total
Firm
7 listings
31.8% of total
Cancellation Policy Insights for Serra de São Bento
- The prevailing Airbnb cancellation policy trend in Serra de São Bento is Moderate, used by 36.4% of listings.
- There's a relatively balanced mix between guest-friendly (68.2%) and stricter (31.8%) policies, offering choices for different guest needs.
Recommendations for Hosts
- Consider adopting a Moderate policy to align with the 36.4% market standard in Serra de São Bento.
- Regularly review your cancellation policy against competitors and market demand shifts in Serra de São Bento.
Serra de São Bento STR Booking Lead Time Analysis (2026)
Average Booking Lead Time by Month
Booking Lead Time Insights for Serra de São Bento
- The overall average booking lead time for vacation rentals in Serra de São Bento is 34 days.
- Guests book furthest in advance for stays during August (average 57 days), likely coinciding with peak travel demand or local events.
- The shortest booking windows occur for stays in March (average 12 days), indicating more last-minute travel plans during this time.
- Seasonally, Summer (45 days avg.) sees the longest lead times, while Spring (22 days avg.) has the shortest, reflecting typical travel planning cycles.
Recommendations for Hosts
- Use the overall average lead time (34 days) as a baseline for your pricing and availability strategy in Serra de São Bento.
- For August stays, consider implementing length-of-stay discounts or slightly higher rates for bookings made less than 57 days out to capitalize on advance planning.
- During March, focus on last-minute booking availability and promotions, as guests book with very short notice (12 days avg.).
- Target marketing efforts for the Summer season well in advance (at least 45 days) to capture early planners.
- Monitor your own booking lead times against these Serra de São Bento averages to identify opportunities for dynamic pricing adjustments.
Popular & Essential Airbnb Amenities in Serra de São Bento (2026)
Amenity Prevalence
Amenity Insights for Serra de São Bento
- Essential amenities in Serra de São Bento that guests expect include: Wifi. Lacking these (this) could significantly impact bookings.
- Popular amenities like TV, Free parking on premises, Air conditioning are common but not universal. Offering these can provide a competitive edge.
Recommendations for Hosts
- Ensure your listing includes all essential amenities for Serra de São Bento: Wifi.
- Consider adding popular differentiators like TV or Free parking on premises to increase appeal.
- Highlight unique or less common amenities you offer (e.g., hot tub, dedicated workspace, EV charger) in your listing description and photos.
- Regularly check competitor amenities in Serra de São Bento to stay competitive.
Serra de São Bento Airbnb Guest Demographics & Profile Analysis (2026)
Guest Profile Summary for Serra de São Bento
- The typical guest profile for Airbnb in Serra de São Bento consists of primarily domestic travelers (93%), often arriving from nearby Natal, typically belonging to the Post-2000s (Gen Z/Alpha) group (50%), primarily speaking Portuguese or English.
- Domestic travelers account for 92.5% of guests.
- Key international markets include Brazil (92.5%) and Portugal (2.5%).
- Top languages spoken are Portuguese (56.7%) followed by English (26.7%).
- A significant demographic segment is the Post-2000s (Gen Z/Alpha) group, representing 50% of guests.
Recommendations for Hosts
- Target domestic marketing efforts towards travelers from Natal and Rio Grande do Norte.
- Tailor amenities and listing descriptions to appeal to the dominant Post-2000s (Gen Z/Alpha) demographic (e.g., highlight fast WiFi, smart home features, local guides).
- Highlight unique local experiences or amenities relevant to the primary guest profile.
- Consider seasonal promotions aligned with peak travel times for key origin markets.
Nearby Short-Term Rental Market Comparison
How does the Serra de São Bento Airbnb market stack up against its neighbors? Compare key performance metrics like average monthly revenue, ADR, and occupancy rates in surrounding areas to understand the broader regional STR landscape.
| Market | Active Properties | Monthly Revenue | Daily Rate | Avg. Occupancy |
|---|---|---|---|---|
| Ceará-Mirim | 33 | $1,211 | $232.73 | 23% |
| Bananeiras | 228 | $720 | $130.54 | 24% |
| Tibau do Sul | 1,407 | $717 | $90.98 | 33% |
| Camaragibe | 28 | $680 | $118.56 | 27% |
| Areia | 25 | $576 | $80.31 | 27% |
| Extremoz | 40 | $547 | $131.07 | 23% |
| João Pessoa | 4,825 | $539 | $61.10 | 38% |
| Parnamirim | 317 | $513 | $87.28 | 28% |
| São Miguel do Gostoso | 280 | $502 | $98.86 | 24% |
| Touros | 96 | $458 | $111.03 | 22% |