Rio do Fogo Airbnb Market Analysis 2026: Short Term Rental Data & Vacation Rental Statistics in Rio Grande do Norte, Brazil
Is Airbnb profitable in Rio do Fogo in 2026? Explore comprehensive Airbnb analytics for Rio do Fogo, Rio Grande do Norte, Brazil to uncover income potential. This 2026 STR market report for Rio do Fogo, based on AirROI data from February 2025 to January 2026, reveals key trends in the niche market of 26 active listings.
Whether you're considering an Airbnb investment in Rio do Fogo, optimizing your existing vacation rental, or exploring rental arbitrage opportunities, understanding the Rio do Fogo Airbnb data is crucial. Leveraging the low regulation environment is key to maximizing your short term rental income potential. Let's dive into the specifics.
Key Rio do Fogo Airbnb Performance Metrics Overview
Monthly Airbnb Revenue Variations & Income Potential in Rio do Fogo (2026)
Understanding the monthly revenue variations for Airbnb listings in Rio do Fogo is key to maximizing your short term rental income potential. Seasonality significantly impacts earnings. Our analysis, based on data from the past 12 months, shows that the peak revenue month for STRs in Rio do Fogo is typically January, while September often presents the lowest earnings, highlighting opportunities for strategic pricing adjustments during shoulder and low seasons. Explore the typical Airbnb income in Rio do Fogo across different performance tiers:
- Best-in-class properties (Top 10%) achieve $1,526+ monthly, often utilizing dynamic pricing and superior guest experiences.
- Strong performing properties (Top 25%) earn $816 or more, indicating effective management and desirable locations/amenities.
- Typical properties (Median) generate around $391 per month, representing the average market performance.
- Entry-level properties (Bottom 25%) see earnings around $231, often with potential for optimization.
Average Monthly Airbnb Earnings Trend in Rio do Fogo
Rio do Fogo Airbnb Occupancy Rate Trends (2026)
Maximize your bookings by understanding the Rio do Fogo STR occupancy trends. Seasonal demand shifts significantly influence how often properties are booked. Typically, Marchsees the highest demand (peak season occupancy), while September experiences the lowest (low season). Effective strategies, like adjusting minimum stays or offering promotions, can boost occupancy during slower periods. Here's how different property tiers perform in Rio do Fogo:
- Best-in-class properties (Top 10%) achieve 52%+ occupancy, indicating high desirability and potentially optimized availability.
- Strong performing properties (Top 25%) maintain 31% or higher occupancy, suggesting good market fit and guest satisfaction.
- Typical properties (Median) have an occupancy rate around 19%.
- Entry-level properties (Bottom 25%) average 11% occupancy, potentially facing higher vacancy.
Average Monthly Occupancy Rate Trend in Rio do Fogo
Average Daily Rate (ADR) Airbnb Trends in Rio do Fogo (2026)
Effective short term rental pricing strategy in Rio do Fogo involves understanding monthly ADR fluctuations. The Average Daily Rate (ADR) for Airbnb in Rio do Fogo typically peaks in January and dips lowest during October. Leveraging Airbnb dynamic pricing tools or strategies based on this seasonality can significantly boost revenue. Here's a look at the typical nightly rates achieved:
- Best-in-class properties (Top 10%) command rates of $140+ per night, often due to premium features or locations.
- Strong performing properties (Top 25%) achieve nightly rates of $107 or more.
- Typical properties (Median) charge around $77 per night.
- Entry-level properties (Bottom 25%) earn around $54 per night.
Average Daily Rate (ADR) Trend by Month in Rio do Fogo
Get Live Rio do Fogo Market Intelligence 👇

Explore Real-time Analytics
Airbnb Seasonality Analysis & Trends in Rio do Fogo (2026)
Peak Season (January, February, March)
- Revenue averages $806 per month
- Occupancy rates average 30.8%
- Daily rates average $86
Shoulder Season
- Revenue averages $591 per month
- Occupancy maintains around 22.8%
- Daily rates hold near $84
Low Season (April, June, September)
- Revenue drops to average $434 per month
- Occupancy decreases to average 20.7%
- Daily rates adjust to average $82
Seasonality Insights for Rio do Fogo
- The Airbnb seasonality in Rio do Fogo shows highly seasonal trends requiring careful strategy. While the sections above show seasonal averages, it's also insightful to look at the extremes:
- During the high season, the absolute peak month showcases Rio do Fogo's highest earning potential, with monthly revenues capable of climbing to $962, occupancy reaching a high of 33.1%, and ADRs peaking at $91.
- Conversely, the slowest single month of the year, typically falling within the low season, marks the market's lowest point. In this month, revenue might dip to $392, occupancy could drop to 17.9%, and ADRs may adjust down to $81.
- Understanding both the seasonal averages and these monthly peaks and troughs in revenue, occupancy, and ADR is crucial for maximizing your Airbnb profit potential in Rio do Fogo.
Seasonal Strategies for Maximizing Profit
- Peak Season: Maximize revenue through premium pricing and potentially longer minimum stays. Ensure high availability.
- Low Season: Offer competitive pricing, special promotions (e.g., extended stay discounts), and flexible cancellation policies. Target off-season travelers like remote workers or budget-conscious guests.
- Shoulder Seasons: Implement dynamic pricing that balances peak and low rates. Target weekend travelers or specific events. Offer slightly more flexible terms than peak season.
- Regularly analyze your own performance against these Rio do Fogo seasonality benchmarks and adjust your pricing and availability strategy accordingly.
Best Areas for Airbnb Investment in Rio do Fogo (2026)
Exploring the top neighborhoods for short-term rentals in Rio do Fogo? This section highlights key areas, outlining why they are attractive for hosts and guests, along with notable local attractions. Consider these locations based on your target guest profile and investment strategy.
| Neighborhood / Area | Why Host Here? (Target Guests & Appeal) | Key Attractions & Landmarks |
|---|---|---|
| Praia do Fogo | A stunning beach known for its natural beauty and serene atmosphere. Ideal for tourists looking to relax and enjoy a peaceful beach getaway. | Praia do Fogo Beach, Coqueirinho Beach, Pirambú Beach |
| Centro de Rio do Fogo | The central area of Rio do Fogo offers local culture, markets, and dining options. It's attractive for visitors wanting to experience genuine Brazilian life. | Local markets, Cultural festivals, Traditional Brazilian cuisine restaurants |
| Ponta do Fogo | Known for its scenic cliffs and breathtaking views of the Atlantic Ocean. A great spot for nature lovers and photographers. | Ponta do Fogo viewpoint, Hiking trails, Wildlife watching |
| Pousadas da Fogo | This area is home to many charming guesthouses and inns, perfect for travelers looking for cozy accommodations close to the beach. | Local guesthouses, Cultural experiences, Beach activities |
| Foz do Rio do Fogo | The estuary area where the Rio do Fogo meets the ocean. Offers unique ecosystem views and water sports activities. | Kayaking tours, Wildlife viewing, Fishing spots |
| Barra do Gil | A less-known yet beautiful beach destination ideal for an off-the-beaten-path vacation experience, attracting adventurous travelers. | Barra do Gil Beach, Water sports, Peaceful surroundings |
| Sítio do Fogo | A tranquil place with lush greenery and a more rural experience. Great for visitors looking to escape the crowds and immerse in nature. | Natural landscapes, Hiking trails, Local farms |
| Praia de Canguaretama | A nearby beach that offers additional options for sun and sand, known for its vibrant nightlife and beach bars. | Canguaretama Beach, Beachfront bars, Water sports |
Understanding Airbnb License Requirements & STR Laws in Rio do Fogo (2026)
While Rio do Fogo, Rio Grande do Norte, Brazil currently shows low STR regulations, specific Airbnb license requirements might still exist or change. Always verify the latest short term rental regulations and Airbnb license requirements directly with local government authorities for Rio do Fogo to ensure full compliance before hosting.
(Source: AirROI data, 2026, finding no licensed listings among those analyzed)
Top Performing Airbnb Properties in Rio do Fogo (2026)
Benchmark your potential! Explore examples of top-performing Airbnb properties in Rio do Fogobased on Trailing Twelve Month (TTM) revenue. Analyze their characteristics, revenue, occupancy rate, and ADR to understand what drives success in this market.

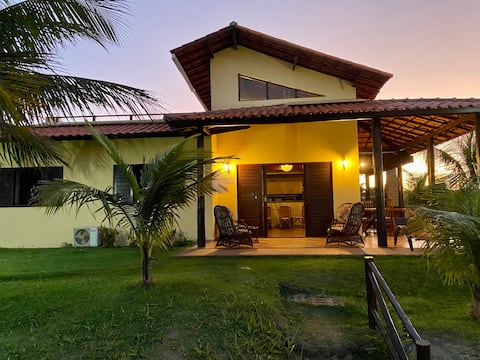
Paradise without any stress
Entire Place • 3 bedrooms
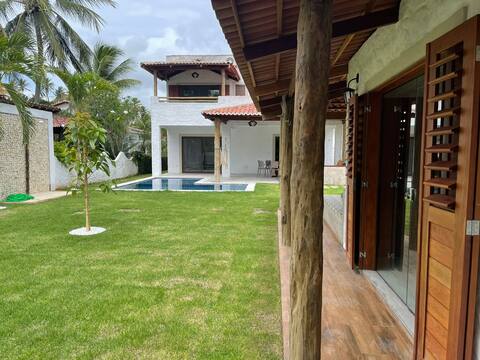
Spectacular house in waterfront condominium
Entire Place • 4 bedrooms
Chalet 17 | Zumbi Beach Resort Condominium
Entire Place • 4 bedrooms

House by the sea in zombie /punaú- Rn. A Paradise
Entire Place • 6 bedrooms
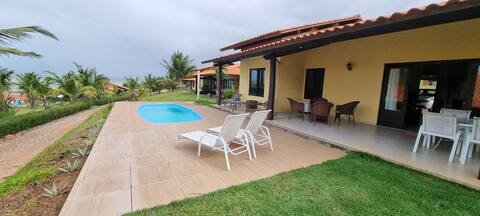
Wonderful villa with pool
Entire Place • 3 bedrooms

Spectacular house in waterfront condominium
Entire Place • 3 bedrooms
Note: Performance varies based on location, size, amenities, seasonality, and management quality. Data reflects the past 12 months.
Top Performing Airbnb Hosts in Rio do Fogo (2026)
Learn from the best! This table showcases top-performing Airbnb hosts in Rio do Fogo based on the number of properties managed and estimated total revenue over the past year. Analyze their scale and performance metrics.
| Host Name | Properties | Grossing Revenue | Stay Reviews | Avg Rating |
|---|---|---|---|---|
| Miguel Guimaraes | 8 | $24,841 | 60 | 4.77/5.0 |
| Adauto | 2 | $22,552 | 6 | 5.00/5.0 |
| Thomas | 1 | $16,891 | 104 | 4.93/5.0 |
| Manu | 1 | $11,716 | 14 | 5.00/5.0 |
| Breno | 1 | $8,492 | 26 | 4.96/5.0 |
| Sofia Braun | 1 | $7,610 | 8 | 5.00/5.0 |
| Luiz | 1 | $7,087 | 57 | 4.93/5.0 |
| Mário | 1 | $5,962 | 17 | 5.00/5.0 |
| Maria Rita Vale | 1 | $4,163 | 8 | 5.00/5.0 |
| Julliana | 1 | $2,716 | 2 | Not Rated |
Analyzing the strategies of top hosts, such as their property selection, pricing, and guest communication, can offer valuable lessons for optimizing your own Airbnb operations in Rio do Fogo.
Dive Deeper: Advanced Rio do Fogo STR Market Data (2026)
Ready to unlock more insights? AirROI provides access to advanced metrics and comprehensive Airbnb data for Rio do Fogo. Explore detailed analytics beyond this report to refine your investment strategy, optimize pricing, and maximize your vacation rental profits.
Explore Advanced MetricsRio do Fogo Short-Term Rental Market Composition (2026): Property & Room Types
Room Type Distribution
Property Type Distribution
Market Composition Insights for Rio do Fogo
- The Rio do Fogo Airbnb market composition is heavily skewed towards Entire Home/Apt listings, which make up 96.2% of the 26 active rentals. This indicates strong guest preference for privacy and space.
- Looking at the property type distribution in Rio do Fogo, House properties are the most common (57.7%), reflecting the local real estate landscape.
- Houses represent a significant 57.7% portion, catering likely to families or larger groups.
Rio do Fogo Airbnb Room Capacity Analysis (2026): Bedroom Distribution
Distribution of Listings by Number of Bedrooms
Room Capacity Insights for Rio do Fogo
- The dominant room capacity in Rio do Fogo is 3 bedrooms listings, making up 38.5% of the market. This suggests a strong demand for properties suitable for families or small groups.
- Together, 3 bedrooms and 2 bedrooms properties represent 69.3% of the active Airbnb listings in Rio do Fogo, indicating a high concentration in these sizes.
- A significant 53.8% of listings offer 3+ bedrooms, catering to larger groups and families seeking more space in Rio do Fogo.
Rio do Fogo Vacation Rental Guest Capacity Trends (2026)
Distribution of Listings by Guest Capacity
Guest Capacity Insights for Rio do Fogo
- The most common guest capacity trend in Rio do Fogo vacation rentals is listings accommodating 8+ guests (30.8%). This suggests the primary traveler segment is likely larger groups.
- Properties designed for 8+ guests and 4 guests dominate the Rio do Fogo STR market, accounting for 53.9% of listings.
- 65.4% of properties accommodate 6+ guests, serving the market segment for larger families or group travel in Rio do Fogo.
- On average, properties in Rio do Fogo are equipped to host 5.8 guests.
Rio do Fogo Airbnb Booking Patterns (2026): Available vs. Booked Days
Available Days Distribution
Booked Days Distribution
Booking Pattern Insights for Rio do Fogo
- The most common availability pattern in Rio do Fogo falls within the 271-366 days range, representing 84.6% of listings. This suggests many properties have significant open periods on their calendars.
- Approximately 96.1% of listings show high availability (181+ days open annually), indicating potential for increased bookings or specific owner usage patterns.
- For booked days, the 31-90 days range is most frequent in Rio do Fogo (46.2%), reflecting common guest stay durations or potential owner blocking patterns.
- A notable 3.8% of properties secure long booking periods (181+ days booked per year), highlighting successful long-term rental strategies or significant owner usage.
Rio do Fogo Airbnb Minimum Stay Requirements Analysis
Distribution of Listings by Minimum Night Requirement
1 Night
4 listings
15.4% of total
2 Nights
15 listings
57.7% of total
3 Nights
3 listings
11.5% of total
7-29 Nights
1 listings
3.8% of total
30+ Nights
3 listings
11.5% of total
Key Insights
- The most prevalent minimum stay requirement in Rio do Fogo is 2 Nights, adopted by 57.7% of listings. This highlights the market's preference for shorter, flexible bookings.
- A strong majority (73.1%) of the Rio do Fogo Airbnb data shows acceptance of very short stays (1-2 nights), indicating a dynamic, high-turnover market.
- A significant segment (11.5%) caters to monthly stays (30+ nights) in Rio do Fogo, pointing to opportunities in the extended-stay market.
Recommendations
- Align with the market by considering a 2 Nights minimum stay, as 57.7% of Rio do Fogo hosts use this setting.
- If feasible, allowing 1-night stays, especially midweek or during low season, could capture last-minute bookings, as only 15.4% currently do.
- A 2-night minimum appears standard (57.7%). Consider this for weekends or peak periods.
- Explore offering discounts for stays of 30+ nights to attract the 11.5% of the market seeking extended stays.
- Adjust minimum nights based on seasonality – potentially shorter during low season and longer during peak demand periods in Rio do Fogo.
Rio do Fogo Airbnb Cancellation Policy Trends Analysis (2026)
Super Strict 60 Days
1 listings
3.8% of total
Flexible
7 listings
26.9% of total
Moderate
4 listings
15.4% of total
Firm
10 listings
38.5% of total
Strict
4 listings
15.4% of total
Cancellation Policy Insights for Rio do Fogo
- The prevailing Airbnb cancellation policy trend in Rio do Fogo is Firm, used by 38.5% of listings.
- A majority (53.9%) of hosts in Rio do Fogo utilize Firm or Strict policies, indicating a market where hosts prioritize booking security.
Recommendations for Hosts
- Consider adopting a Firm policy to align with the 38.5% market standard in Rio do Fogo.
- Regularly review your cancellation policy against competitors and market demand shifts in Rio do Fogo.
Rio do Fogo STR Booking Lead Time Analysis (2026)
Average Booking Lead Time by Month
Booking Lead Time Insights for Rio do Fogo
- The overall average booking lead time for vacation rentals in Rio do Fogo is 31 days.
- Guests book furthest in advance for stays during December (average 58 days), likely coinciding with peak travel demand or local events.
- The shortest booking windows occur for stays in September (average 6 days), indicating more last-minute travel plans during this time.
- Seasonally, Winter (41 days avg.) sees the longest lead times, while Summer (15 days avg.) has the shortest, reflecting typical travel planning cycles.
Recommendations for Hosts
- Use the overall average lead time (31 days) as a baseline for your pricing and availability strategy in Rio do Fogo.
- For December stays, consider implementing length-of-stay discounts or slightly higher rates for bookings made less than 58 days out to capitalize on advance planning.
- During September, focus on last-minute booking availability and promotions, as guests book with very short notice (6 days avg.).
- Target marketing efforts for the Winter season well in advance (at least 41 days) to capture early planners.
- Monitor your own booking lead times against these Rio do Fogo averages to identify opportunities for dynamic pricing adjustments.
Popular & Essential Airbnb Amenities in Rio do Fogo (2026)
Amenity Prevalence
Amenity Insights for Rio do Fogo
- Essential amenities in Rio do Fogo that guests expect include: Kitchen, Wifi. Lacking these (any) could significantly impact bookings.
- Popular amenities like Free parking on premises, Cooking basics, TV are common but not universal. Offering these can provide a competitive edge.
Recommendations for Hosts
- Ensure your listing includes all essential amenities for Rio do Fogo: Kitchen, Wifi.
- Prioritize adding missing essentials: Wifi.
- Consider adding popular differentiators like Free parking on premises or Cooking basics to increase appeal.
- Highlight unique or less common amenities you offer (e.g., hot tub, dedicated workspace, EV charger) in your listing description and photos.
- Regularly check competitor amenities in Rio do Fogo to stay competitive.
Rio do Fogo Airbnb Guest Demographics & Profile Analysis (2026)
Guest Profile Summary for Rio do Fogo
- The typical guest profile for Airbnb in Rio do Fogo consists of primarily domestic travelers (86%), often arriving from nearby Natal, typically belonging to the Post-2000s (Gen Z/Alpha) group (50%), primarily speaking Portuguese or English.
- Domestic travelers account for 85.7% of guests.
- Key international markets include Brazil (85.7%) and Peru (2.9%).
- Top languages spoken are Portuguese (37.9%) followed by English (27.6%).
- A significant demographic segment is the Post-2000s (Gen Z/Alpha) group, representing 50% of guests.
Recommendations for Hosts
- Target domestic marketing efforts towards travelers from Natal and Rio Grande do Norte.
- Tailor amenities and listing descriptions to appeal to the dominant Post-2000s (Gen Z/Alpha) demographic (e.g., highlight fast WiFi, smart home features, local guides).
- Highlight unique local experiences or amenities relevant to the primary guest profile.
- Consider seasonal promotions aligned with peak travel times for key origin markets.
Nearby Short-Term Rental Market Comparison
How does the Rio do Fogo Airbnb market stack up against its neighbors? Compare key performance metrics like average monthly revenue, ADR, and occupancy rates in surrounding areas to understand the broader regional STR landscape.
| Market | Active Properties | Monthly Revenue | Daily Rate | Avg. Occupancy |
|---|---|---|---|---|
| Ceará-Mirim | 33 | $1,211 | $232.73 | 23% |
| Bananeiras | 228 | $720 | $130.54 | 24% |
| Tibau do Sul | 1,407 | $717 | $90.98 | 33% |
| Areia | 25 | $576 | $80.31 | 27% |
| Extremoz | 40 | $547 | $131.07 | 23% |
| Parnamirim | 317 | $513 | $87.28 | 28% |
| São Miguel do Gostoso | 280 | $502 | $98.86 | 24% |
| Touros | 96 | $458 | $111.03 | 22% |
| Serra de São Bento | 22 | $443 | $79.36 | 20% |
| Natal | 1,656 | $440 | $48.25 | 38% |