Teresina Airbnb Market Analysis 2026: Short Term Rental Data & Vacation Rental Statistics in Piauí, Brazil
Is Airbnb profitable in Teresina in 2026? Explore comprehensive Airbnb analytics for Teresina, Piauí, Brazil to uncover income potential. This 2026 STR market report for Teresina, based on AirROI data from February 2025 to January 2026, reveals key trends in the market of 272 active listings.
Whether you're considering an Airbnb investment in Teresina, optimizing your existing vacation rental, or exploring rental arbitrage opportunities, understanding the Teresina Airbnb data is crucial. Leveraging the low regulation environment is key to maximizing your short term rental income potential. Let's dive into the specifics.
Key Teresina Airbnb Performance Metrics Overview
Monthly Airbnb Revenue Variations & Income Potential in Teresina (2026)
Understanding the monthly revenue variations for Airbnb listings in Teresina is key to maximizing your short term rental income potential. Seasonality significantly impacts earnings. Our analysis, based on data from the past 12 months, shows that the peak revenue month for STRs in Teresina is typically October, while January often presents the lowest earnings, highlighting opportunities for strategic pricing adjustments during shoulder and low seasons. Explore the typical Airbnb income in Teresina across different performance tiers:
- Best-in-class properties (Top 10%) achieve $846+ monthly, often utilizing dynamic pricing and superior guest experiences.
- Strong performing properties (Top 25%) earn $592 or more, indicating effective management and desirable locations/amenities.
- Typical properties (Median) generate around $337 per month, representing the average market performance.
- Entry-level properties (Bottom 25%) see earnings around $144, often with potential for optimization.
Average Monthly Airbnb Earnings Trend in Teresina
Teresina Airbnb Occupancy Rate Trends (2026)
Maximize your bookings by understanding the Teresina STR occupancy trends. Seasonal demand shifts significantly influence how often properties are booked. Typically, Marchsees the highest demand (peak season occupancy), while January experiences the lowest (low season). Effective strategies, like adjusting minimum stays or offering promotions, can boost occupancy during slower periods. Here's how different property tiers perform in Teresina:
- Best-in-class properties (Top 10%) achieve 78%+ occupancy, indicating high desirability and potentially optimized availability.
- Strong performing properties (Top 25%) maintain 57% or higher occupancy, suggesting good market fit and guest satisfaction.
- Typical properties (Median) have an occupancy rate around 32%.
- Entry-level properties (Bottom 25%) average 13% occupancy, potentially facing higher vacancy.
Average Monthly Occupancy Rate Trend in Teresina
Average Daily Rate (ADR) Airbnb Trends in Teresina (2026)
Effective short term rental pricing strategy in Teresina involves understanding monthly ADR fluctuations. The Average Daily Rate (ADR) for Airbnb in Teresina typically peaks in August and dips lowest during September. Leveraging Airbnb dynamic pricing tools or strategies based on this seasonality can significantly boost revenue. Here's a look at the typical nightly rates achieved:
- Best-in-class properties (Top 10%) command rates of $58+ per night, often due to premium features or locations.
- Strong performing properties (Top 25%) achieve nightly rates of $41 or more.
- Typical properties (Median) charge around $32 per night.
- Entry-level properties (Bottom 25%) earn around $24 per night.
Average Daily Rate (ADR) Trend by Month in Teresina
Get Live Teresina Market Intelligence 👇

Explore Real-time Analytics
Airbnb Seasonality Analysis & Trends in Teresina (2026)
Peak Season (October, March, July)
- Revenue averages $458 per month
- Occupancy rates average 42.0%
- Daily rates average $40
Shoulder Season
- Revenue averages $409 per month
- Occupancy maintains around 35.2%
- Daily rates hold near $40
Low Season (January, February, April)
- Revenue drops to average $368 per month
- Occupancy decreases to average 36.0%
- Daily rates adjust to average $40
Seasonality Insights for Teresina
- The Airbnb seasonality in Teresina shows moderate seasonality with distinct peak and low periods. While the sections above show seasonal averages, it's also insightful to look at the extremes:
- During the high season, the absolute peak month showcases Teresina's highest earning potential, with monthly revenues capable of climbing to $465, occupancy reaching a high of 45.7%, and ADRs peaking at $42.
- Conversely, the slowest single month of the year, typically falling within the low season, marks the market's lowest point. In this month, revenue might dip to $329, occupancy could drop to 27.1%, and ADRs may adjust down to $38.
- Understanding both the seasonal averages and these monthly peaks and troughs in revenue, occupancy, and ADR is crucial for maximizing your Airbnb profit potential in Teresina.
Seasonal Strategies for Maximizing Profit
- Peak Season: Maximize revenue through premium pricing and potentially longer minimum stays. Ensure high availability.
- Low Season: Offer competitive pricing, special promotions (e.g., extended stay discounts), and flexible cancellation policies. Target off-season travelers like remote workers or budget-conscious guests.
- Shoulder Seasons: Implement dynamic pricing that balances peak and low rates. Target weekend travelers or specific events. Offer slightly more flexible terms than peak season.
- Regularly analyze your own performance against these Teresina seasonality benchmarks and adjust your pricing and availability strategy accordingly.
Best Areas for Airbnb Investment in Teresina (2026)
Exploring the top neighborhoods for short-term rentals in Teresina? This section highlights key areas, outlining why they are attractive for hosts and guests, along with notable local attractions. Consider these locations based on your target guest profile and investment strategy.
| Neighborhood / Area | Why Host Here? (Target Guests & Appeal) | Key Attractions & Landmarks |
|---|---|---|
| Centro | The heart of Teresina, featuring a mix of cultural attractions, business centers, and shopping. Ideal for both tourists and business travelers looking to explore the city. | Palácio de Karnak, Teatro 4 de Setembro, Parque Potycabana, Mercado dos Dités, Igreja de São Benedito |
| Teresina Shopping | A popular area with a major shopping mall that attracts locals and visitors alike. Great for those looking for convenience and access to dining and entertainment. | Teresina Shopping Mall, Cinemas, Restaurants, Lazer Park |
| Ilha Grande | A picturesque area known for its serene environment and proximity to the Poty River. Perfect for those seeking a peaceful retreat with easy access to nature. | Parque Natural Ilha Grande, Poty River, Ecotourism opportunities, Bicycle trails |
| Timon | Just across the river from Teresina, Timon offers a different experience with its local culture and hospitality. Suitable for those who want to explore the region beyond Teresina. | Praça da Bandeira, Parque da Cidade, Local markets, Cultural festivals |
| Zona Leste | A fast-growing neighborhood with a mix of residential and commercial areas. Popular among younger crowds and those looking for nightlife options. | Shopping Rio Poty, Clubs and bars, Parks |
| Praia do Meio | A unique riverside area known for its relaxed vibe and local life. Ideal for those looking to experience the authentic lifestyle of Teresina residents. | Riverside dining, Fishing spots, Local markets |
| Jardim Europa | An upscale residential neighborhood characterized by its greenery and modern homes. Great for longer stays and comfort-oriented travelers. | Private parks, Quiet streets, Shopping centers |
| São Cristóvão | A vibrant neighborhood with an active cultural scene and strong community feel. Attracts visitors interested in local traditions and customs. | Local festivals, Churches, Cultural centers |
Understanding Airbnb License Requirements & STR Laws in Teresina (2026)
While Teresina, Piauí, Brazil currently shows low STR regulations, specific Airbnb license requirements might still exist or change. Always verify the latest short term rental regulations and Airbnb license requirements directly with local government authorities for Teresina to ensure full compliance before hosting.
(Source: AirROI data, 2026, finding no licensed listings among those analyzed)
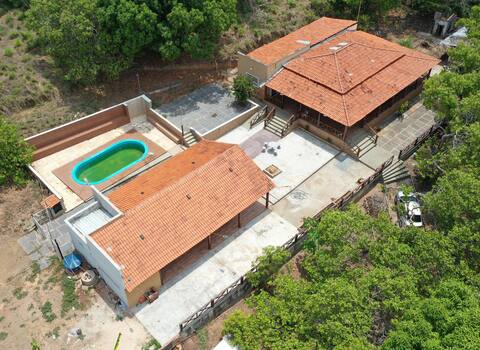
Top Performing Airbnb Properties in Teresina (2026)
Benchmark your potential! Explore examples of top-performing Airbnb properties in Teresinabased on Trailing Twelve Month (TTM) revenue. Analyze their characteristics, revenue, occupancy rate, and ADR to understand what drives success in this market.

LUXURIOUS APT NEAR TERESINA SHOPPING MALL
Entire Place • 3 bedrooms
Moderníssima Chácara Legado in Teresina-PI
Entire Place • 4 bedrooms

Vovó Maroca Country House
Entire Place • 4 bedrooms
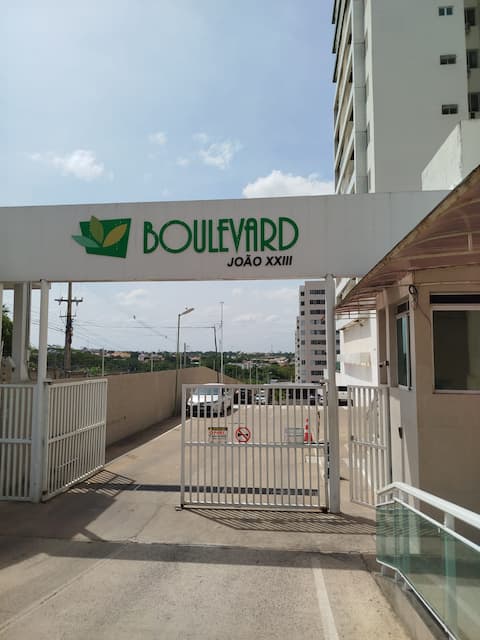
Apartment on João XXIII
Entire Place • 3 bedrooms
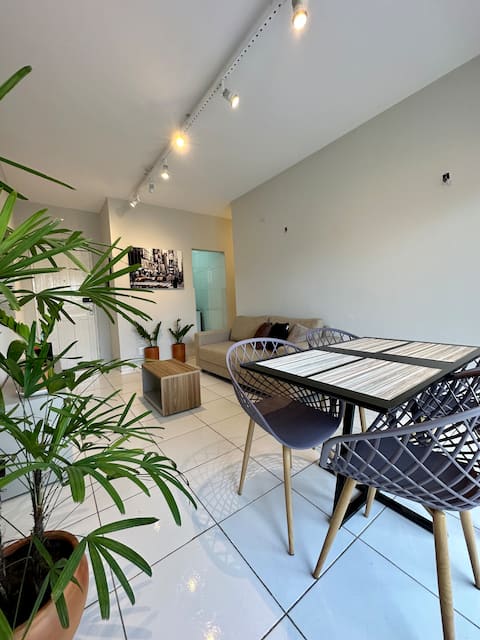
Ideal apartment in Ilhotas
Entire Place • 3 bedrooms
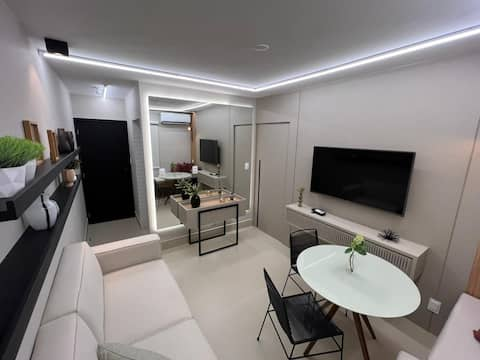
Super Cozy Fully Furnished Apartment
Entire Place • 2 bedrooms
Note: Performance varies based on location, size, amenities, seasonality, and management quality. Data reflects the past 12 months.
Top Performing Airbnb Hosts in Teresina (2026)
Learn from the best! This table showcases top-performing Airbnb hosts in Teresina based on the number of properties managed and estimated total revenue over the past year. Analyze their scale and performance metrics.
| Host Name | Properties | Grossing Revenue | Stay Reviews | Avg Rating |
|---|---|---|---|---|
| Roberto Veloso | 4 | $37,463 | 787 | 4.93/5.0 |
| Francisco Leal | 14 | $36,671 | 405 | 4.71/5.0 |
| Pitágoras | 13 | $31,854 | 515 | 4.86/5.0 |
| Lucas Santos | 2 | $20,485 | 236 | 4.85/5.0 |
| Rose | 4 | $20,321 | 350 | 4.94/5.0 |
| Mauro | 4 | $18,755 | 20 | 4.96/5.0 |
| Marcos | 4 | $17,891 | 183 | 4.50/5.0 |
| Maria | 7 | $17,500 | 115 | 4.82/5.0 |
| José Bringel | 3 | $15,229 | 85 | 4.76/5.0 |
| Marina | 2 | $14,872 | 102 | 4.94/5.0 |
Analyzing the strategies of top hosts, such as their property selection, pricing, and guest communication, can offer valuable lessons for optimizing your own Airbnb operations in Teresina.
Dive Deeper: Advanced Teresina STR Market Data (2026)
Ready to unlock more insights? AirROI provides access to advanced metrics and comprehensive Airbnb data for Teresina. Explore detailed analytics beyond this report to refine your investment strategy, optimize pricing, and maximize your vacation rental profits.
Explore Advanced MetricsTeresina Short-Term Rental Market Composition (2026): Property & Room Types
Room Type Distribution
Property Type Distribution
Market Composition Insights for Teresina
- The Teresina Airbnb market composition is heavily skewed towards Entire Home/Apt listings, which make up 79.4% of the 272 active rentals. This indicates strong guest preference for privacy and space.
- Looking at the property type distribution in Teresina, Apartment/Condo properties are the most common (69.5%), reflecting the local real estate landscape.
- Houses represent a significant 18.4% portion, catering likely to families or larger groups.
- The presence of 9.6% Hotel/Boutique listings indicates integration with traditional hospitality.
- Smaller segments like others, outdoor/unique (combined 2.5%) offer potential for unique stay experiences.
Teresina Airbnb Room Capacity Analysis (2026): Bedroom Distribution
Distribution of Listings by Number of Bedrooms
Room Capacity Insights for Teresina
- The dominant room capacity in Teresina is 1 bedroom listings, making up 39% of the market. This suggests a strong demand for properties suitable for couples or solo travelers.
- Together, 1 bedroom and 2 bedrooms properties represent 72.5% of the active Airbnb listings in Teresina, indicating a high concentration in these sizes.
Teresina Vacation Rental Guest Capacity Trends (2026)
Distribution of Listings by Guest Capacity
Guest Capacity Insights for Teresina
- The most common guest capacity trend in Teresina vacation rentals is listings accommodating 2 guests (23.9%). This suggests the primary traveler segment is likely couples or solo travelers.
- Properties designed for 2 guests and 4 guests dominate the Teresina STR market, accounting for 44.9% of listings.
- 17.0% of properties accommodate 6+ guests, serving the market segment for larger families or group travel in Teresina.
- On average, properties in Teresina are equipped to host 3.4 guests.
Teresina Airbnb Booking Patterns (2026): Available vs. Booked Days
Available Days Distribution
Booked Days Distribution
Booking Pattern Insights for Teresina
- The most common availability pattern in Teresina falls within the 271-366 days range, representing 62.1% of listings. This suggests many properties have significant open periods on their calendars.
- Approximately 86.4% of listings show high availability (181+ days open annually), indicating potential for increased bookings or specific owner usage patterns.
- For booked days, the 1-30 days range is most frequent in Teresina (32.7%), reflecting common guest stay durations or potential owner blocking patterns.
- A notable 14.0% of properties secure long booking periods (181+ days booked per year), highlighting successful long-term rental strategies or significant owner usage.
Teresina Airbnb Minimum Stay Requirements Analysis
Distribution of Listings by Minimum Night Requirement
1 Night
109 listings
40.1% of total
2 Nights
62 listings
22.8% of total
3 Nights
44 listings
16.2% of total
4-6 Nights
6 listings
2.2% of total
7-29 Nights
3 listings
1.1% of total
30+ Nights
48 listings
17.6% of total
Key Insights
- The most prevalent minimum stay requirement in Teresina is 1 Night, adopted by 40.1% of listings. This highlights the market's preference for shorter, flexible bookings.
- A strong majority (62.9%) of the Teresina Airbnb data shows acceptance of very short stays (1-2 nights), indicating a dynamic, high-turnover market.
- A significant segment (17.6%) caters to monthly stays (30+ nights) in Teresina, pointing to opportunities in the extended-stay market.
Recommendations
- Align with the market by considering a 1 Night minimum stay, as 40.1% of Teresina hosts use this setting.
- Explore offering discounts for stays of 30+ nights to attract the 17.6% of the market seeking extended stays.
- Adjust minimum nights based on seasonality – potentially shorter during low season and longer during peak demand periods in Teresina.
Teresina Airbnb Cancellation Policy Trends Analysis (2026)
Limited
1 listings
0.4% of total
Flexible
128 listings
47.1% of total
Moderate
48 listings
17.6% of total
Firm
71 listings
26.1% of total
Strict
24 listings
8.8% of total
Cancellation Policy Insights for Teresina
- The prevailing Airbnb cancellation policy trend in Teresina is Flexible, used by 47.1% of listings.
- There's a relatively balanced mix between guest-friendly (64.7%) and stricter (34.9%) policies, offering choices for different guest needs.
- Strict cancellation policies are quite rare (8.8%), potentially making listings with this policy less competitive unless justified by high demand or property type.
Recommendations for Hosts
- Consider adopting a Flexible policy to align with the 47.1% market standard in Teresina.
- Using a Strict policy might deter some guests, as only 8.8% of listings use it. Evaluate if potential revenue protection outweighs possible lower booking rates.
- Regularly review your cancellation policy against competitors and market demand shifts in Teresina.
Teresina STR Booking Lead Time Analysis (2026)
Average Booking Lead Time by Month
Booking Lead Time Insights for Teresina
- The overall average booking lead time for vacation rentals in Teresina is 24 days.
- Guests book furthest in advance for stays during January (average 55 days), likely coinciding with peak travel demand or local events.
- The shortest booking windows occur for stays in June (average 9 days), indicating more last-minute travel plans during this time.
- Seasonally, Winter (29 days avg.) sees the longest lead times, while Spring (11 days avg.) has the shortest, reflecting typical travel planning cycles.
Recommendations for Hosts
- Use the overall average lead time (24 days) as a baseline for your pricing and availability strategy in Teresina.
- For January stays, consider implementing length-of-stay discounts or slightly higher rates for bookings made less than 55 days out to capitalize on advance planning.
- During June, focus on last-minute booking availability and promotions, as guests book with very short notice (9 days avg.).
- Target marketing efforts for the Winter season well in advance (at least 29 days) to capture early planners.
- Monitor your own booking lead times against these Teresina averages to identify opportunities for dynamic pricing adjustments.
Popular & Essential Airbnb Amenities in Teresina (2026)
Amenity Prevalence
Amenity Insights for Teresina
- Essential amenities in Teresina that guests expect include: Wifi, Air conditioning. Lacking these (any) could significantly impact bookings.
- Popular amenities like TV, Kitchen, Free parking on premises are common but not universal. Offering these can provide a competitive edge.
Recommendations for Hosts
- Ensure your listing includes all essential amenities for Teresina: Wifi, Air conditioning.
- Prioritize adding missing essentials: Wifi, Air conditioning.
- Consider adding popular differentiators like TV or Kitchen to increase appeal.
- Highlight unique or less common amenities you offer (e.g., hot tub, dedicated workspace, EV charger) in your listing description and photos.
- Regularly check competitor amenities in Teresina to stay competitive.
Teresina Airbnb Guest Demographics & Profile Analysis (2026)
Guest Profile Summary for Teresina
- The typical guest profile for Airbnb in Teresina consists of primarily domestic travelers (97%), often arriving from nearby São Paulo, typically belonging to the Post-2000s (Gen Z/Alpha) group (50%), primarily speaking Portuguese or English.
- Domestic travelers account for 96.6% of guests.
- Key international markets include Brazil (96.6%) and United States (1%).
- Top languages spoken are Portuguese (50.7%) followed by English (24.3%).
- A significant demographic segment is the Post-2000s (Gen Z/Alpha) group, representing 50% of guests.
Recommendations for Hosts
- Target domestic marketing efforts towards travelers from São Paulo and Teresina.
- Tailor amenities and listing descriptions to appeal to the dominant Post-2000s (Gen Z/Alpha) demographic (e.g., highlight fast WiFi, smart home features, local guides).
- Highlight unique local experiences or amenities relevant to the primary guest profile.
- Consider seasonal promotions aligned with peak travel times for key origin markets.
Nearby Short-Term Rental Market Comparison
How does the Teresina Airbnb market stack up against its neighbors? Compare key performance metrics like average monthly revenue, ADR, and occupancy rates in surrounding areas to understand the broader regional STR landscape.
| Market | Active Properties | Monthly Revenue | Daily Rate | Avg. Occupancy |
|---|---|---|---|---|
| Pedro II | 10 | $159 | $54.83 | 16% |