Parnaíba Airbnb Market Analysis 2026: Short Term Rental Data & Vacation Rental Statistics in Piauí, Brazil
Is Airbnb profitable in Parnaíba in 2026? Explore comprehensive Airbnb analytics for Parnaíba, Piauí, Brazil to uncover income potential. This 2026 STR market report for Parnaíba, based on AirROI data from February 2025 to January 2026, reveals key trends in the niche market of 91 active listings.
Whether you're considering an Airbnb investment in Parnaíba, optimizing your existing vacation rental, or exploring rental arbitrage opportunities, understanding the Parnaíba Airbnb data is crucial. Leveraging the low regulation environment is key to maximizing your short term rental income potential. Let's dive into the specifics.
Key Parnaíba Airbnb Performance Metrics Overview
Monthly Airbnb Revenue Variations & Income Potential in Parnaíba (2026)
Understanding the monthly revenue variations for Airbnb listings in Parnaíba is key to maximizing your short term rental income potential. Seasonality significantly impacts earnings. Our analysis, based on data from the past 12 months, shows that the peak revenue month for STRs in Parnaíba is typically July, while May often presents the lowest earnings, highlighting opportunities for strategic pricing adjustments during shoulder and low seasons. Explore the typical Airbnb income in Parnaíba across different performance tiers:
- Best-in-class properties (Top 10%) achieve $830+ monthly, often utilizing dynamic pricing and superior guest experiences.
- Strong performing properties (Top 25%) earn $488 or more, indicating effective management and desirable locations/amenities.
- Typical properties (Median) generate around $238 per month, representing the average market performance.
- Entry-level properties (Bottom 25%) see earnings around $112, often with potential for optimization.
Average Monthly Airbnb Earnings Trend in Parnaíba
Parnaíba Airbnb Occupancy Rate Trends (2026)
Maximize your bookings by understanding the Parnaíba STR occupancy trends. Seasonal demand shifts significantly influence how often properties are booked. Typically, Julysees the highest demand (peak season occupancy), while January experiences the lowest (low season). Effective strategies, like adjusting minimum stays or offering promotions, can boost occupancy during slower periods. Here's how different property tiers perform in Parnaíba:
- Best-in-class properties (Top 10%) achieve 64%+ occupancy, indicating high desirability and potentially optimized availability.
- Strong performing properties (Top 25%) maintain 42% or higher occupancy, suggesting good market fit and guest satisfaction.
- Typical properties (Median) have an occupancy rate around 22%.
- Entry-level properties (Bottom 25%) average 12% occupancy, potentially facing higher vacancy.
Average Monthly Occupancy Rate Trend in Parnaíba
Average Daily Rate (ADR) Airbnb Trends in Parnaíba (2026)
Effective short term rental pricing strategy in Parnaíba involves understanding monthly ADR fluctuations. The Average Daily Rate (ADR) for Airbnb in Parnaíba typically peaks in December and dips lowest during February. Leveraging Airbnb dynamic pricing tools or strategies based on this seasonality can significantly boost revenue. Here's a look at the typical nightly rates achieved:
- Best-in-class properties (Top 10%) command rates of $73+ per night, often due to premium features or locations.
- Strong performing properties (Top 25%) achieve nightly rates of $49 or more.
- Typical properties (Median) charge around $31 per night.
- Entry-level properties (Bottom 25%) earn around $23 per night.
Average Daily Rate (ADR) Trend by Month in Parnaíba
Get Live Parnaíba Market Intelligence 👇

Explore Real-time Analytics
Airbnb Seasonality Analysis & Trends in Parnaíba (2026)
Peak Season (July, December, August)
- Revenue averages $483 per month
- Occupancy rates average 35.5%
- Daily rates average $46
Shoulder Season
- Revenue averages $354 per month
- Occupancy maintains around 28.5%
- Daily rates hold near $45
Low Season (April, May, September)
- Revenue drops to average $255 per month
- Occupancy decreases to average 26.7%
- Daily rates adjust to average $42
Seasonality Insights for Parnaíba
- The Airbnb seasonality in Parnaíba shows highly seasonal trends requiring careful strategy. While the sections above show seasonal averages, it's also insightful to look at the extremes:
- During the high season, the absolute peak month showcases Parnaíba's highest earning potential, with monthly revenues capable of climbing to $519, occupancy reaching a high of 41.2%, and ADRs peaking at $52.
- Conversely, the slowest single month of the year, typically falling within the low season, marks the market's lowest point. In this month, revenue might dip to $231, occupancy could drop to 25.1%, and ADRs may adjust down to $40.
- Understanding both the seasonal averages and these monthly peaks and troughs in revenue, occupancy, and ADR is crucial for maximizing your Airbnb profit potential in Parnaíba.
Seasonal Strategies for Maximizing Profit
- Peak Season: Maximize revenue through premium pricing and potentially longer minimum stays. Ensure high availability.
- Low Season: Offer competitive pricing, special promotions (e.g., extended stay discounts), and flexible cancellation policies. Target off-season travelers like remote workers or budget-conscious guests.
- Shoulder Seasons: Implement dynamic pricing that balances peak and low rates. Target weekend travelers or specific events. Offer slightly more flexible terms than peak season.
- Regularly analyze your own performance against these Parnaíba seasonality benchmarks and adjust your pricing and availability strategy accordingly.
Best Areas for Airbnb Investment in Parnaíba (2026)
Exploring the top neighborhoods for short-term rentals in Parnaíba? This section highlights key areas, outlining why they are attractive for hosts and guests, along with notable local attractions. Consider these locations based on your target guest profile and investment strategy.
| Neighborhood / Area | Why Host Here? (Target Guests & Appeal) | Key Attractions & Landmarks |
|---|---|---|
| Praia da Pedra do Sal | A stunning beach known for its natural beauty and cultural significance. It's a favorite spot for both locals and tourists, offering a unique experience by the coast. | Pedra do Sal Beach, Caminho dos Antiquários, Sunset views, Local seafood restaurants, Cultural events |
| Praia do Coqueiro | Famous for its calm waters, palm trees, and relaxing atmosphere, this beach attracts families and couples looking for a peaceful getaway. | Coqueiro Beach, Natural pools, Fish restaurants, Water sports, Relaxing beach bars |
| Centro Histórico | The historic center of Parnaíba showcases colonial architecture and local markets, making it a great place for tourists interested in culture and history. | Igreja de São Benedito, Teatro Municipal, Mercado da Caramuru, Historic architecture, Local crafts |
| Ilha das Canárias | A serene island experience, perfect for those looking to escape the city. It offers beautiful views and is ideal for eco-tourism. | Fishing spots, Birdwatching, Natural beauty, Tent camping, Kayaking |
| Praia de Atalaia | Known for its beautiful coastline and lively atmosphere, this beach is a great destination for both relaxation and entertainment. | Atalaia Beach, Beach volleyball, Local beach clubs, Water activities, Lively nightlife |
| Parque Nacional da Serra da Capivara | A UNESCO World Heritage Site renowned for its archaeological significance and unique rock formations. Attractive to adventure tourists and history buffs. | Ancient rock paintings, Hiking trails, Wildlife viewing, Guided tours, Educational experiences |
| Praia do Maceió | A popular destination for those looking to enjoy sun and surf, known for its vibrant beach scene and local hospitality. | Maceió Beach, Surf schools, Beachfront bars, Local artisans, Cultural festivals |
| Bairro São Benedito | An emerging neighborhood with a rich cultural scene, attracting young travelers looking for a more authentic local experience. | Local art galleries, Street food, Cultural performances, Community events, Craft markets |
Understanding Airbnb License Requirements & STR Laws in Parnaíba (2026)
While Parnaíba, Piauí, Brazil currently shows low STR regulations, specific Airbnb license requirements might still exist or change. Always verify the latest short term rental regulations and Airbnb license requirements directly with local government authorities for Parnaíba to ensure full compliance before hosting.
(Source: AirROI data, 2026, finding no licensed listings among those analyzed)
Top Performing Airbnb Properties in Parnaíba (2026)
Benchmark your potential! Explore examples of top-performing Airbnb properties in Parnaíbabased on Trailing Twelve Month (TTM) revenue. Analyze their characteristics, revenue, occupancy rate, and ADR to understand what drives success in this market.
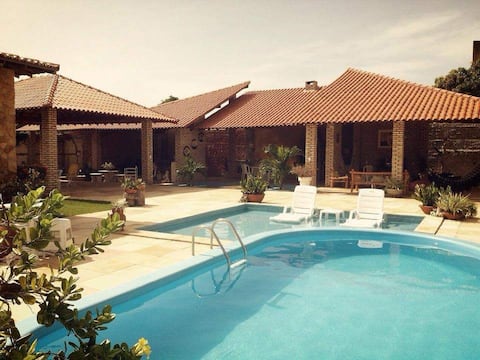
Casa das Palmeiras (Palm Trees House) (PHB)
Entire Place • 5 bedrooms
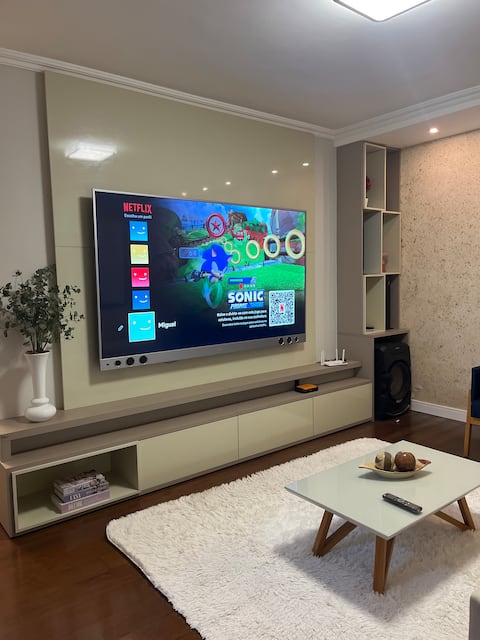
Coastal house with 85" TV, air-conditioned bedrooms.
Entire Place • 2 bedrooms
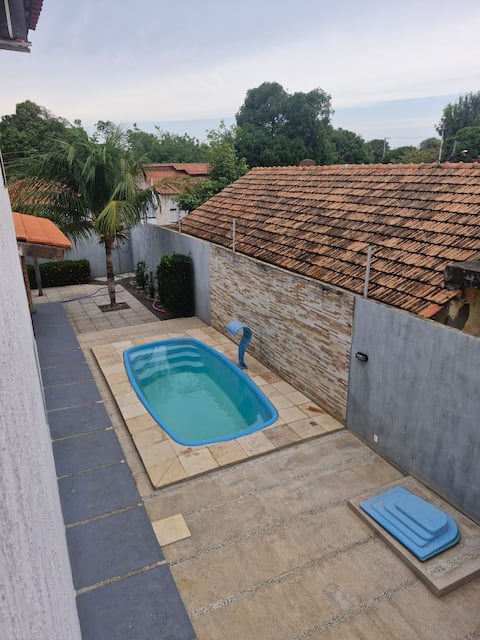
Relax in Parnaíba
Entire Place • 4 bedrooms

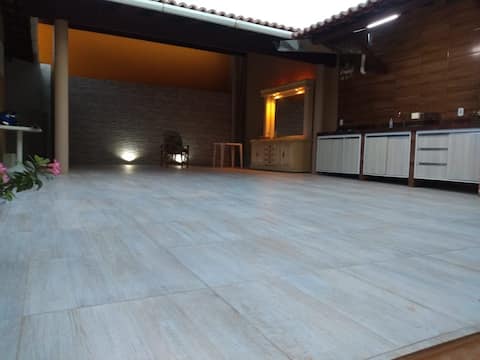
"Urban Refuge" in Parnaíba-PI
Entire Place • 3 bedrooms
Casa Tabajara
Entire Place • 2 bedrooms
Cozy house with a barbecue area
Entire Place • 2 bedrooms
Note: Performance varies based on location, size, amenities, seasonality, and management quality. Data reflects the past 12 months.
Top Performing Airbnb Hosts in Parnaíba (2026)
Learn from the best! This table showcases top-performing Airbnb hosts in Parnaíba based on the number of properties managed and estimated total revenue over the past year. Analyze their scale and performance metrics.
| Host Name | Properties | Grossing Revenue | Stay Reviews | Avg Rating |
|---|---|---|---|---|
| Daniel Fernando Pereira | 4 | $15,793 | 203 | 4.89/5.0 |
| Leonardo | 1 | $15,211 | 41 | 4.59/5.0 |
| Glaucia | 1 | $12,590 | 27 | 4.93/5.0 |
| Diogo | 2 | $11,585 | 118 | 4.99/5.0 |
| Veleida | 7 | $11,299 | 71 | 4.80/5.0 |
| Michelle | 1 | $10,812 | 13 | 5.00/5.0 |
| Chalés Do Delta | 4 | $8,509 | 10 | 4.89/5.0 |
| Antônia Edilma | 1 | $7,750 | 5 | 5.00/5.0 |
| Ana Klara | 1 | $7,045 | 47 | 5.00/5.0 |
| Rayron | 2 | $6,739 | 33 | 4.95/5.0 |
Analyzing the strategies of top hosts, such as their property selection, pricing, and guest communication, can offer valuable lessons for optimizing your own Airbnb operations in Parnaíba.
Dive Deeper: Advanced Parnaíba STR Market Data (2026)
Ready to unlock more insights? AirROI provides access to advanced metrics and comprehensive Airbnb data for Parnaíba. Explore detailed analytics beyond this report to refine your investment strategy, optimize pricing, and maximize your vacation rental profits.
Explore Advanced MetricsParnaíba Short-Term Rental Market Composition (2026): Property & Room Types
Room Type Distribution
Property Type Distribution
Market Composition Insights for Parnaíba
- The Parnaíba Airbnb market composition is heavily skewed towards Entire Home/Apt listings, which make up 72.5% of the 91 active rentals. This indicates strong guest preference for privacy and space.
- Looking at the property type distribution in Parnaíba, House properties are the most common (50.5%), reflecting the local real estate landscape.
- Houses represent a significant 50.5% portion, catering likely to families or larger groups.
- The presence of 19.8% Hotel/Boutique listings indicates integration with traditional hospitality.
Parnaíba Airbnb Room Capacity Analysis (2026): Bedroom Distribution
Distribution of Listings by Number of Bedrooms
Room Capacity Insights for Parnaíba
- The dominant room capacity in Parnaíba is 1 bedroom listings, making up 37.4% of the market. This suggests a strong demand for properties suitable for couples or solo travelers.
- Together, 1 bedroom and 2 bedrooms properties represent 71.5% of the active Airbnb listings in Parnaíba, indicating a high concentration in these sizes.
Parnaíba Vacation Rental Guest Capacity Trends (2026)
Distribution of Listings by Guest Capacity
Guest Capacity Insights for Parnaíba
- The most common guest capacity trend in Parnaíba vacation rentals is listings accommodating 8+ guests (20.9%). This suggests the primary traveler segment is likely larger groups.
- Properties designed for 8+ guests and 2 guests dominate the Parnaíba STR market, accounting for 39.6% of listings.
- 27.5% of properties accommodate 6+ guests, serving the market segment for larger families or group travel in Parnaíba.
- On average, properties in Parnaíba are equipped to host 4.0 guests.
Parnaíba Airbnb Booking Patterns (2026): Available vs. Booked Days
Available Days Distribution
Booked Days Distribution
Booking Pattern Insights for Parnaíba
- The most common availability pattern in Parnaíba falls within the 271-366 days range, representing 75.8% of listings. This suggests many properties have significant open periods on their calendars.
- Approximately 94.5% of listings show high availability (181+ days open annually), indicating potential for increased bookings or specific owner usage patterns.
- For booked days, the 1-30 days range is most frequent in Parnaíba (41.8%), reflecting common guest stay durations or potential owner blocking patterns.
- A notable 7.7% of properties secure long booking periods (181+ days booked per year), highlighting successful long-term rental strategies or significant owner usage.
Parnaíba Airbnb Minimum Stay Requirements Analysis
Distribution of Listings by Minimum Night Requirement
1 Night
37 listings
40.7% of total
2 Nights
26 listings
28.6% of total
3 Nights
3 listings
3.3% of total
4-6 Nights
1 listings
1.1% of total
30+ Nights
24 listings
26.4% of total
Key Insights
- The most prevalent minimum stay requirement in Parnaíba is 1 Night, adopted by 40.7% of listings. This highlights the market's preference for shorter, flexible bookings.
- A strong majority (69.3%) of the Parnaíba Airbnb data shows acceptance of very short stays (1-2 nights), indicating a dynamic, high-turnover market.
- A significant segment (26.4%) caters to monthly stays (30+ nights) in Parnaíba, pointing to opportunities in the extended-stay market.
Recommendations
- Align with the market by considering a 1 Night minimum stay, as 40.7% of Parnaíba hosts use this setting.
- Explore offering discounts for stays of 30+ nights to attract the 26.4% of the market seeking extended stays.
- Adjust minimum nights based on seasonality – potentially shorter during low season and longer during peak demand periods in Parnaíba.
Parnaíba Airbnb Cancellation Policy Trends Analysis (2026)
Limited
2 listings
2.2% of total
Flexible
49 listings
53.8% of total
Moderate
21 listings
23.1% of total
Firm
18 listings
19.8% of total
Strict
1 listings
1.1% of total
Cancellation Policy Insights for Parnaíba
- The prevailing Airbnb cancellation policy trend in Parnaíba is Flexible, used by 53.8% of listings.
- The market strongly favors guest-friendly terms, with 76.9% of listings offering Flexible or Moderate policies. This suggests guests in Parnaíba may expect booking flexibility.
- Strict cancellation policies are quite rare (1.1%), potentially making listings with this policy less competitive unless justified by high demand or property type.
Recommendations for Hosts
- Consider adopting a Flexible policy to align with the 53.8% market standard in Parnaíba.
- Given the high prevalence of Flexible policies (53.8%), offering this can enhance booking appeal, especially during shoulder seasons.
- Using a Strict policy might deter some guests, as only 1.1% of listings use it. Evaluate if potential revenue protection outweighs possible lower booking rates.
- Regularly review your cancellation policy against competitors and market demand shifts in Parnaíba.
Parnaíba STR Booking Lead Time Analysis (2026)
Average Booking Lead Time by Month
Booking Lead Time Insights for Parnaíba
- The overall average booking lead time for vacation rentals in Parnaíba is 30 days.
- Guests book furthest in advance for stays during August (average 49 days), likely coinciding with peak travel demand or local events.
- The shortest booking windows occur for stays in February (average 13 days), indicating more last-minute travel plans during this time.
- Seasonally, Summer (34 days avg.) sees the longest lead times, while Spring (19 days avg.) has the shortest, reflecting typical travel planning cycles.
Recommendations for Hosts
- Use the overall average lead time (30 days) as a baseline for your pricing and availability strategy in Parnaíba.
- For August stays, consider implementing length-of-stay discounts or slightly higher rates for bookings made less than 49 days out to capitalize on advance planning.
- During February, focus on last-minute booking availability and promotions, as guests book with very short notice (13 days avg.).
- Target marketing efforts for the Summer season well in advance (at least 34 days) to capture early planners.
- Monitor your own booking lead times against these Parnaíba averages to identify opportunities for dynamic pricing adjustments.
Popular & Essential Airbnb Amenities in Parnaíba (2026)
Amenity Prevalence
Amenity Insights for Parnaíba
- Essential amenities in Parnaíba that guests expect include: Wifi. Lacking these (this) could significantly impact bookings.
- Popular amenities like Kitchen, Free parking on premises, TV are common but not universal. Offering these can provide a competitive edge.
Recommendations for Hosts
- Ensure your listing includes all essential amenities for Parnaíba: Wifi.
- Prioritize adding missing essentials: Wifi.
- Consider adding popular differentiators like Kitchen or Free parking on premises to increase appeal.
- Highlight unique or less common amenities you offer (e.g., hot tub, dedicated workspace, EV charger) in your listing description and photos.
- Regularly check competitor amenities in Parnaíba to stay competitive.
Parnaíba Airbnb Guest Demographics & Profile Analysis (2026)
Guest Profile Summary for Parnaíba
- The typical guest profile for Airbnb in Parnaíba consists of primarily domestic travelers (88%), often arriving from nearby Teresina, typically belonging to the Post-2000s (Gen Z/Alpha) group (50%), primarily speaking Portuguese or English.
- Domestic travelers account for 88.3% of guests.
- Key international markets include Brazil (88.3%) and France (4.2%).
- Top languages spoken are Portuguese (41.4%) followed by English (28.7%).
- A significant demographic segment is the Post-2000s (Gen Z/Alpha) group, representing 50% of guests.
Recommendations for Hosts
- Target domestic marketing efforts towards travelers from Teresina and São Paulo.
- Tailor amenities and listing descriptions to appeal to the dominant Post-2000s (Gen Z/Alpha) demographic (e.g., highlight fast WiFi, smart home features, local guides).
- Highlight unique local experiences or amenities relevant to the primary guest profile.
- Consider seasonal promotions aligned with peak travel times for key origin markets.
Nearby Short-Term Rental Market Comparison
How does the Parnaíba Airbnb market stack up against its neighbors? Compare key performance metrics like average monthly revenue, ADR, and occupancy rates in surrounding areas to understand the broader regional STR landscape.
| Market | Active Properties | Monthly Revenue | Daily Rate | Avg. Occupancy |
|---|---|---|---|---|
| Jijoca de Jericoacoara | 452 | $771 | $100.13 | 31% |
| Cruz | 215 | $764 | $138.05 | 26% |
| Barreirinhas | 562 | $661 | $108.00 | 30% |
| Acaraú | 32 | $573 | $180.41 | 23% |
| Jericoacoara | 30 | $557 | $81.94 | 30% |
| Cajueiro da Praia | 203 | $532 | $125.26 | 21% |
| Camocim | 120 | $420 | $111.65 | 20% |
| Luís Correia | 358 | $364 | $98.90 | 19% |
| Tutóia | 40 | $315 | $86.15 | 20% |
| Viçosa do Ceará | 40 | $278 | $54.88 | 21% |