Petrolina Airbnb Market Analysis 2026: Short Term Rental Data & Vacation Rental Statistics in Pernambuco, Brazil
Is Airbnb profitable in Petrolina in 2026? Explore comprehensive Airbnb analytics for Petrolina, Pernambuco, Brazil to uncover income potential. This 2026 STR market report for Petrolina, based on AirROI data from February 2025 to January 2026, reveals key trends in the market of 289 active listings.
Whether you're considering an Airbnb investment in Petrolina, optimizing your existing vacation rental, or exploring rental arbitrage opportunities, understanding the Petrolina Airbnb data is crucial. Leveraging the low regulation environment is key to maximizing your short term rental income potential. Let's dive into the specifics.
Key Petrolina Airbnb Performance Metrics Overview
Monthly Airbnb Revenue Variations & Income Potential in Petrolina (2026)
Understanding the monthly revenue variations for Airbnb listings in Petrolina is key to maximizing your short term rental income potential. Seasonality significantly impacts earnings. Our analysis, based on data from the past 12 months, shows that the peak revenue month for STRs in Petrolina is typically June, while February often presents the lowest earnings, highlighting opportunities for strategic pricing adjustments during shoulder and low seasons. Explore the typical Airbnb income in Petrolina across different performance tiers:
- Best-in-class properties (Top 10%) achieve $978+ monthly, often utilizing dynamic pricing and superior guest experiences.
- Strong performing properties (Top 25%) earn $651 or more, indicating effective management and desirable locations/amenities.
- Typical properties (Median) generate around $340 per month, representing the average market performance.
- Entry-level properties (Bottom 25%) see earnings around $165, often with potential for optimization.
Average Monthly Airbnb Earnings Trend in Petrolina
Petrolina Airbnb Occupancy Rate Trends (2026)
Maximize your bookings by understanding the Petrolina STR occupancy trends. Seasonal demand shifts significantly influence how often properties are booked. Typically, Marchsees the highest demand (peak season occupancy), while May experiences the lowest (low season). Effective strategies, like adjusting minimum stays or offering promotions, can boost occupancy during slower periods. Here's how different property tiers perform in Petrolina:
- Best-in-class properties (Top 10%) achieve 74%+ occupancy, indicating high desirability and potentially optimized availability.
- Strong performing properties (Top 25%) maintain 53% or higher occupancy, suggesting good market fit and guest satisfaction.
- Typical properties (Median) have an occupancy rate around 29%.
- Entry-level properties (Bottom 25%) average 15% occupancy, potentially facing higher vacancy.
Average Monthly Occupancy Rate Trend in Petrolina
Average Daily Rate (ADR) Airbnb Trends in Petrolina (2026)
Effective short term rental pricing strategy in Petrolina involves understanding monthly ADR fluctuations. The Average Daily Rate (ADR) for Airbnb in Petrolina typically peaks in June and dips lowest during February. Leveraging Airbnb dynamic pricing tools or strategies based on this seasonality can significantly boost revenue. Here's a look at the typical nightly rates achieved:
- Best-in-class properties (Top 10%) command rates of $95+ per night, often due to premium features or locations.
- Strong performing properties (Top 25%) achieve nightly rates of $51 or more.
- Typical properties (Median) charge around $34 per night.
- Entry-level properties (Bottom 25%) earn around $26 per night.
Average Daily Rate (ADR) Trend by Month in Petrolina
Get Live Petrolina Market Intelligence 👇

Explore Real-time Analytics
Airbnb Seasonality Analysis & Trends in Petrolina (2026)
Peak Season (June, December, November)
- Revenue averages $579 per month
- Occupancy rates average 36.3%
- Daily rates average $54
Shoulder Season
- Revenue averages $452 per month
- Occupancy maintains around 35.8%
- Daily rates hold near $49
Low Season (January, February, May)
- Revenue drops to average $400 per month
- Occupancy decreases to average 33.0%
- Daily rates adjust to average $47
Seasonality Insights for Petrolina
- The Airbnb seasonality in Petrolina shows highly seasonal trends requiring careful strategy. While the sections above show seasonal averages, it's also insightful to look at the extremes:
- During the high season, the absolute peak month showcases Petrolina's highest earning potential, with monthly revenues capable of climbing to $769, occupancy reaching a high of 38.7%, and ADRs peaking at $62.
- Conversely, the slowest single month of the year, typically falling within the low season, marks the market's lowest point. In this month, revenue might dip to $356, occupancy could drop to 29.2%, and ADRs may adjust down to $45.
- Understanding both the seasonal averages and these monthly peaks and troughs in revenue, occupancy, and ADR is crucial for maximizing your Airbnb profit potential in Petrolina.
Seasonal Strategies for Maximizing Profit
- Peak Season: Maximize revenue through premium pricing and potentially longer minimum stays. Ensure high availability.
- Low Season: Offer competitive pricing, special promotions (e.g., extended stay discounts), and flexible cancellation policies. Target off-season travelers like remote workers or budget-conscious guests.
- Shoulder Seasons: Implement dynamic pricing that balances peak and low rates. Target weekend travelers or specific events. Offer slightly more flexible terms than peak season.
- Regularly analyze your own performance against these Petrolina seasonality benchmarks and adjust your pricing and availability strategy accordingly.
Best Areas for Airbnb Investment in Petrolina (2026)
Exploring the top neighborhoods for short-term rentals in Petrolina? This section highlights key areas, outlining why they are attractive for hosts and guests, along with notable local attractions. Consider these locations based on your target guest profile and investment strategy.
| Neighborhood / Area | Why Host Here? (Target Guests & Appeal) | Key Attractions & Landmarks |
|---|---|---|
| Center of Petrolina | The bustling center of the city, where guests can enjoy local culture, shopping, and dining. Ideal for tourists who want to explore the town's attractions and enjoy easy access to amenities. | Petrolina City Hall, Catedral de Petrolina, Jatobá Park, Riverfront Promenade, Petrolina Convention Center |
| Bairro São Gonçalo | A growing residential area that attracts visitors for its local charm and proximity to amenities. Great for families and those looking for a quieter stay while still close to the city. | São Gonçalo do Amarante Church, local markets, bakeries, community parks |
| Bairro Maria Auxiliadora | A neighborhood known for its affordability and residential feel, attracting budget travelers and long-term rentals. Ideal for those looking for a more local experience. | local supermarkets, casual restaurants, community art initiatives |
| Bairro Cohab VI | A vibrant neighborhood with a mix of cultural influences, perfect for visitors wanting to experience authentic local life. Offers a range of affordable housing options. | Cohab VI Community Park, local shops, traditional food stalls |
| Bairro Casinha | A quieter neighborhood favored by families and long-term visitors, providing a calm environment with local conveniences. Great for those looking for home-like settings. | local schools, family-friendly parks, community events |
| Bairro Gercino | An up-and-coming area with new developments and better infrastructure. Attracts both tourists and business travelers due to its modernization and accessibility. | new shopping areas, growing restaurant scene, modern plazas |
| Rodeador | A popular area for leisure activities with parks and close proximity to the river, great for visitors looking to engage in outdoor activities and relaxation. | Rodeador Park, local sports facilities, river access for leisure activities |
| Bairro Maria Auxiliadora | A thriving neighborhood with a dynamic atmosphere, it hosts various cultural events that interest tourists, adding to its value as an Airbnb location. | community festivals, art installations, local music venues |
Understanding Airbnb License Requirements & STR Laws in Petrolina (2026)
While Petrolina, Pernambuco, Brazil currently shows low STR regulations, specific Airbnb license requirements might still exist or change. Always verify the latest short term rental regulations and Airbnb license requirements directly with local government authorities for Petrolina to ensure full compliance before hosting.
(Source: AirROI data, 2026, based on 1% licensed listings)
Top Performing Airbnb Properties in Petrolina (2026)
Benchmark your potential! Explore examples of top-performing Airbnb properties in Petrolinabased on Trailing Twelve Month (TTM) revenue. Analyze their characteristics, revenue, occupancy rate, and ADR to understand what drives success in this market.
Velho Chico Farmhouse
Entire Place • 5 bedrooms
3/4 house with pool, Wi-Fi, 100% air-conditioned
Entire Place • 3 bedrooms
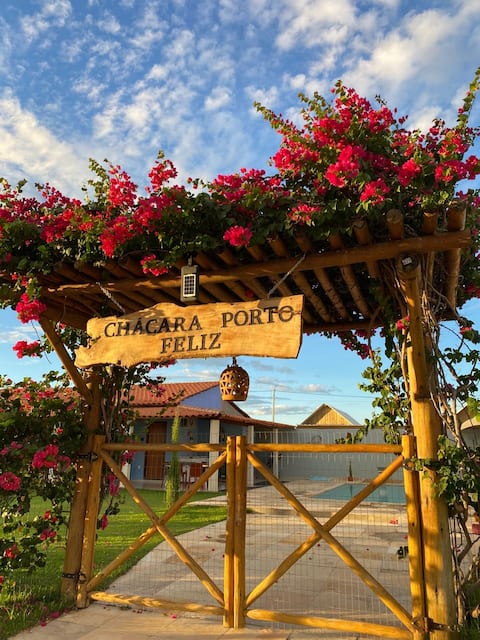
Chácara Porto Feliz - Petrolina, Brazil
Entire Place • 5 bedrooms
Nice house in Petrolina, rent with Sevé!
Entire Place • 4 bedrooms

New apartment with a view of the waterfront
Entire Place • 3 bedrooms

Entire space - Farm in a gated community
Entire Place • 2 bedrooms
Note: Performance varies based on location, size, amenities, seasonality, and management quality. Data reflects the past 12 months.
Top Performing Airbnb Hosts in Petrolina (2026)
Learn from the best! This table showcases top-performing Airbnb hosts in Petrolina based on the number of properties managed and estimated total revenue over the past year. Analyze their scale and performance metrics.
| Host Name | Properties | Grossing Revenue | Stay Reviews | Avg Rating |
|---|---|---|---|---|
| Edjane | 7 | $63,065 | 169 | 4.78/5.0 |
| Vale Hospedagens | By Jonis Ba | 7 | $58,350 | 336 | 4.95/5.0 |
| Maria Do Socorro | 5 | $52,742 | 7 | Not Rated |
| Alan | 6 | $42,302 | 465 | 4.88/5.0 |
| Marina | 2 | $25,989 | 172 | 4.95/5.0 |
| Jean Lima | 3 | $23,287 | 245 | 4.92/5.0 |
| Rodrigo | 4 | $20,831 | 124 | 4.97/5.0 |
| Clécia | 3 | $17,007 | 112 | 4.98/5.0 |
| Livya | 1 | $15,938 | 68 | 4.68/5.0 |
| Luciano Roberto | 1 | $15,705 | 3 | 4.67/5.0 |
Analyzing the strategies of top hosts, such as their property selection, pricing, and guest communication, can offer valuable lessons for optimizing your own Airbnb operations in Petrolina.
Dive Deeper: Advanced Petrolina STR Market Data (2026)
Ready to unlock more insights? AirROI provides access to advanced metrics and comprehensive Airbnb data for Petrolina. Explore detailed analytics beyond this report to refine your investment strategy, optimize pricing, and maximize your vacation rental profits.
Explore Advanced MetricsPetrolina Short-Term Rental Market Composition (2026): Property & Room Types
Room Type Distribution
Property Type Distribution
Market Composition Insights for Petrolina
- The Petrolina Airbnb market composition is heavily skewed towards Entire Home/Apt listings, which make up 88.6% of the 289 active rentals. This indicates strong guest preference for privacy and space.
- Looking at the property type distribution in Petrolina, Apartment/Condo properties are the most common (54.3%), reflecting the local real estate landscape.
- Houses represent a significant 41.2% portion, catering likely to families or larger groups.
- Smaller segments like hotel/boutique, outdoor/unique, others (combined 4.5%) offer potential for unique stay experiences.
Petrolina Airbnb Room Capacity Analysis (2026): Bedroom Distribution
Distribution of Listings by Number of Bedrooms
Room Capacity Insights for Petrolina
- The dominant room capacity in Petrolina is 2 bedrooms listings, making up 44.6% of the market. This suggests a strong demand for properties suitable for couples or solo travelers.
- Together, 2 bedrooms and 1 bedroom properties represent 68.1% of the active Airbnb listings in Petrolina, indicating a high concentration in these sizes.
- A significant 22.4% of listings offer 3+ bedrooms, catering to larger groups and families seeking more space in Petrolina.
Petrolina Vacation Rental Guest Capacity Trends (2026)
Distribution of Listings by Guest Capacity
Guest Capacity Insights for Petrolina
- The most common guest capacity trend in Petrolina vacation rentals is listings accommodating 4 guests (20.8%). This suggests the primary traveler segment is likely small families or groups.
- Properties designed for 4 guests and 8+ guests dominate the Petrolina STR market, accounting for 37.8% of listings.
- 36.7% of properties accommodate 6+ guests, serving the market segment for larger families or group travel in Petrolina.
- On average, properties in Petrolina are equipped to host 4.5 guests.
Petrolina Airbnb Booking Patterns (2026): Available vs. Booked Days
Available Days Distribution
Booked Days Distribution
Booking Pattern Insights for Petrolina
- The most common availability pattern in Petrolina falls within the 271-366 days range, representing 64.4% of listings. This suggests many properties have significant open periods on their calendars.
- Approximately 87.9% of listings show high availability (181+ days open annually), indicating potential for increased bookings or specific owner usage patterns.
- For booked days, the 31-90 days range is most frequent in Petrolina (35.3%), reflecting common guest stay durations or potential owner blocking patterns.
- A notable 13.1% of properties secure long booking periods (181+ days booked per year), highlighting successful long-term rental strategies or significant owner usage.
Petrolina Airbnb Minimum Stay Requirements Analysis
Distribution of Listings by Minimum Night Requirement
1 Night
130 listings
45% of total
2 Nights
84 listings
29.1% of total
3 Nights
13 listings
4.5% of total
4-6 Nights
4 listings
1.4% of total
30+ Nights
58 listings
20.1% of total
Key Insights
- The most prevalent minimum stay requirement in Petrolina is 1 Night, adopted by 45% of listings. This highlights the market's preference for shorter, flexible bookings.
- A strong majority (74.1%) of the Petrolina Airbnb data shows acceptance of very short stays (1-2 nights), indicating a dynamic, high-turnover market.
- A significant segment (20.1%) caters to monthly stays (30+ nights) in Petrolina, pointing to opportunities in the extended-stay market.
Recommendations
- Align with the market by considering a 1 Night minimum stay, as 45% of Petrolina hosts use this setting.
- Explore offering discounts for stays of 30+ nights to attract the 20.1% of the market seeking extended stays.
- Adjust minimum nights based on seasonality – potentially shorter during low season and longer during peak demand periods in Petrolina.
Petrolina Airbnb Cancellation Policy Trends Analysis (2026)
Limited
4 listings
1.4% of total
Flexible
104 listings
36.5% of total
Moderate
71 listings
24.9% of total
Firm
87 listings
30.5% of total
Strict
19 listings
6.7% of total
Cancellation Policy Insights for Petrolina
- The prevailing Airbnb cancellation policy trend in Petrolina is Flexible, used by 36.5% of listings.
- There's a relatively balanced mix between guest-friendly (61.4%) and stricter (37.2%) policies, offering choices for different guest needs.
- Strict cancellation policies are quite rare (6.7%), potentially making listings with this policy less competitive unless justified by high demand or property type.
Recommendations for Hosts
- Consider adopting a Flexible policy to align with the 36.5% market standard in Petrolina.
- Using a Strict policy might deter some guests, as only 6.7% of listings use it. Evaluate if potential revenue protection outweighs possible lower booking rates.
- Regularly review your cancellation policy against competitors and market demand shifts in Petrolina.
Petrolina STR Booking Lead Time Analysis (2026)
Average Booking Lead Time by Month
Booking Lead Time Insights for Petrolina
- The overall average booking lead time for vacation rentals in Petrolina is 23 days.
- Guests book furthest in advance for stays during June (average 43 days), likely coinciding with peak travel demand or local events.
- The shortest booking windows occur for stays in March (average 11 days), indicating more last-minute travel plans during this time.
- Seasonally, Summer (28 days avg.) sees the longest lead times, while Spring (15 days avg.) has the shortest, reflecting typical travel planning cycles.
Recommendations for Hosts
- Use the overall average lead time (23 days) as a baseline for your pricing and availability strategy in Petrolina.
- For June stays, consider implementing length-of-stay discounts or slightly higher rates for bookings made less than 43 days out to capitalize on advance planning.
- During March, focus on last-minute booking availability and promotions, as guests book with very short notice (11 days avg.).
- Target marketing efforts for the Summer season well in advance (at least 28 days) to capture early planners.
- Monitor your own booking lead times against these Petrolina averages to identify opportunities for dynamic pricing adjustments.
Popular & Essential Airbnb Amenities in Petrolina (2026)
Amenity Prevalence
Amenity Insights for Petrolina
- Essential amenities in Petrolina that guests expect include: Wifi, Air conditioning. Lacking these (any) could significantly impact bookings.
- Popular amenities like Kitchen, TV, Free parking on premises are common but not universal. Offering these can provide a competitive edge.
Recommendations for Hosts
- Ensure your listing includes all essential amenities for Petrolina: Wifi, Air conditioning.
- Prioritize adding missing essentials: Wifi, Air conditioning.
- Consider adding popular differentiators like Kitchen or TV to increase appeal.
- Highlight unique or less common amenities you offer (e.g., hot tub, dedicated workspace, EV charger) in your listing description and photos.
- Regularly check competitor amenities in Petrolina to stay competitive.
Petrolina Airbnb Guest Demographics & Profile Analysis (2026)
Guest Profile Summary for Petrolina
- The typical guest profile for Airbnb in Petrolina consists of primarily domestic travelers (96%), often arriving from nearby Pernambuco, typically belonging to the Post-2000s (Gen Z/Alpha) group (50%), primarily speaking Portuguese or English.
- Domestic travelers account for 96.0% of guests.
- Key international markets include Brazil (96%) and United States (1.3%).
- Top languages spoken are Portuguese (52.9%) followed by English (25.9%).
- A significant demographic segment is the Post-2000s (Gen Z/Alpha) group, representing 50% of guests.
Recommendations for Hosts
- Target domestic marketing efforts towards travelers from Pernambuco and São Paulo.
- Tailor amenities and listing descriptions to appeal to the dominant Post-2000s (Gen Z/Alpha) demographic (e.g., highlight fast WiFi, smart home features, local guides).
- Highlight unique local experiences or amenities relevant to the primary guest profile.
- Consider seasonal promotions aligned with peak travel times for key origin markets.
Nearby Short-Term Rental Market Comparison
How does the Petrolina Airbnb market stack up against its neighbors? Compare key performance metrics like average monthly revenue, ADR, and occupancy rates in surrounding areas to understand the broader regional STR landscape.
| Market | Active Properties | Monthly Revenue | Daily Rate | Avg. Occupancy |
|---|---|---|---|---|
| Juazeiro | 61 | $272 | $49.49 | 34% |