Paulista Airbnb Market Analysis 2026: Short Term Rental Data & Vacation Rental Statistics in Pernambuco, Brazil
Is Airbnb profitable in Paulista in 2026? Explore comprehensive Airbnb analytics for Paulista, Pernambuco, Brazil to uncover income potential. This 2026 STR market report for Paulista, based on AirROI data from February 2025 to January 2026, reveals key trends in the niche market of 132 active listings.
Whether you're considering an Airbnb investment in Paulista, optimizing your existing vacation rental, or exploring rental arbitrage opportunities, understanding the Paulista Airbnb data is crucial. Leveraging the low regulation environment is key to maximizing your short term rental income potential. Let's dive into the specifics.
Key Paulista Airbnb Performance Metrics Overview
Monthly Airbnb Revenue Variations & Income Potential in Paulista (2026)
Understanding the monthly revenue variations for Airbnb listings in Paulista is key to maximizing your short term rental income potential. Seasonality significantly impacts earnings. Our analysis, based on data from the past 12 months, shows that the peak revenue month for STRs in Paulista is typically January, while April often presents the lowest earnings, highlighting opportunities for strategic pricing adjustments during shoulder and low seasons. Explore the typical Airbnb income in Paulista across different performance tiers:
- Best-in-class properties (Top 10%) achieve $1,329+ monthly, often utilizing dynamic pricing and superior guest experiences.
- Strong performing properties (Top 25%) earn $758 or more, indicating effective management and desirable locations/amenities.
- Typical properties (Median) generate around $331 per month, representing the average market performance.
- Entry-level properties (Bottom 25%) see earnings around $131, often with potential for optimization.
Average Monthly Airbnb Earnings Trend in Paulista
Paulista Airbnb Occupancy Rate Trends (2026)
Maximize your bookings by understanding the Paulista STR occupancy trends. Seasonal demand shifts significantly influence how often properties are booked. Typically, Marchsees the highest demand (peak season occupancy), while August experiences the lowest (low season). Effective strategies, like adjusting minimum stays or offering promotions, can boost occupancy during slower periods. Here's how different property tiers perform in Paulista:
- Best-in-class properties (Top 10%) achieve 57%+ occupancy, indicating high desirability and potentially optimized availability.
- Strong performing properties (Top 25%) maintain 38% or higher occupancy, suggesting good market fit and guest satisfaction.
- Typical properties (Median) have an occupancy rate around 20%.
- Entry-level properties (Bottom 25%) average 9% occupancy, potentially facing higher vacancy.
Average Monthly Occupancy Rate Trend in Paulista
Average Daily Rate (ADR) Airbnb Trends in Paulista (2026)
Effective short term rental pricing strategy in Paulista involves understanding monthly ADR fluctuations. The Average Daily Rate (ADR) for Airbnb in Paulista typically peaks in January and dips lowest during April. Leveraging Airbnb dynamic pricing tools or strategies based on this seasonality can significantly boost revenue. Here's a look at the typical nightly rates achieved:
- Best-in-class properties (Top 10%) command rates of $139+ per night, often due to premium features or locations.
- Strong performing properties (Top 25%) achieve nightly rates of $88 or more.
- Typical properties (Median) charge around $47 per night.
- Entry-level properties (Bottom 25%) earn around $29 per night.
Average Daily Rate (ADR) Trend by Month in Paulista
Get Live Paulista Market Intelligence 👇

Explore Real-time Analytics
Airbnb Seasonality Analysis & Trends in Paulista (2026)
Peak Season (January, December, March)
- Revenue averages $767 per month
- Occupancy rates average 28.5%
- Daily rates average $82
Shoulder Season
- Revenue averages $514 per month
- Occupancy maintains around 25.8%
- Daily rates hold near $75
Low Season (April, June, October)
- Revenue drops to average $469 per month
- Occupancy decreases to average 24.7%
- Daily rates adjust to average $74
Seasonality Insights for Paulista
- The Airbnb seasonality in Paulista shows highly seasonal trends requiring careful strategy. While the sections above show seasonal averages, it's also insightful to look at the extremes:
- During the high season, the absolute peak month showcases Paulista's highest earning potential, with monthly revenues capable of climbing to $882, occupancy reaching a high of 30.2%, and ADRs peaking at $86.
- Conversely, the slowest single month of the year, typically falling within the low season, marks the market's lowest point. In this month, revenue might dip to $466, occupancy could drop to 22.1%, and ADRs may adjust down to $73.
- Understanding both the seasonal averages and these monthly peaks and troughs in revenue, occupancy, and ADR is crucial for maximizing your Airbnb profit potential in Paulista.
Seasonal Strategies for Maximizing Profit
- Peak Season: Maximize revenue through premium pricing and potentially longer minimum stays. Ensure high availability.
- Low Season: Offer competitive pricing, special promotions (e.g., extended stay discounts), and flexible cancellation policies. Target off-season travelers like remote workers or budget-conscious guests.
- Shoulder Seasons: Implement dynamic pricing that balances peak and low rates. Target weekend travelers or specific events. Offer slightly more flexible terms than peak season.
- Regularly analyze your own performance against these Paulista seasonality benchmarks and adjust your pricing and availability strategy accordingly.
Best Areas for Airbnb Investment in Paulista (2026)
Exploring the top neighborhoods for short-term rentals in Paulista? This section highlights key areas, outlining why they are attractive for hosts and guests, along with notable local attractions. Consider these locations based on your target guest profile and investment strategy.
| Neighborhood / Area | Why Host Here? (Target Guests & Appeal) | Key Attractions & Landmarks |
|---|---|---|
| Pina | Popular beach neighborhood with a lively atmosphere and proximity to the waterfront. Attracts tourists seeking beach activities and local cuisine. | Pina Beach, Praia do Pina, Beachfront bars and restaurants, Cenário do Porto, Shopping Center RioMar |
| Boa Viagem | Famous for its stunning beach and upscale dining and nightlife options. A prime location for tourists and business travelers alike. | Boa Viagem Beach, Parque Dona Lindu, Shopping Center Recife, Local seafood restaurants, Nightlife spots on the beach |
| Casa Forte | A residential neighborhood known for its parks and family-friendly environment, appealing to travelers looking for a quieter stay. | Casa Forte Park, Cultural Center, Local markets, Fine dining restaurants, Historic architecture |
| Olinda | A UNESCO World Heritage site, famous for its colonial architecture and vibrant cultural festivals. Attracts tourists interested in history and culture. | Historic Olinda, Churches and museums, Carnaval in Olinda, Artisan markets, Mirante de Olinda |
| Recife Antigo | The historic center of the city, known for its vibrant cultural scene and nightlife. Ideal for tourists wanting to explore the city's history and culture. | Marco Zero, Malakoff Tower, Cultural institutions, Local art galleries, Nightlife spots and bars |
| Jardim São Paulo | A growing area with a mix of residential and commercial spaces, appealing to both long-term and short-term guests. | Local parks, Shopping options, Cafes and restaurants, Cultural activities, Nearby beaches |
| Setúbal | A lively neighborhood close to the beach, known for its dining and entertainment options. Popular among both locals and tourists. | Setúbal Beach, Local markets, Bars and clubs, Beachfront dining, Shopping areas |
| Aflitos | An up-and-coming neighborhood with a charm of its own, appealing to younger travelers and locals with creative spaces. | Local art scene, Cafes and coffee shops, Community events, Parks, Cultural activities |
Understanding Airbnb License Requirements & STR Laws in Paulista (2026)
While Paulista, Pernambuco, Brazil currently shows low STR regulations, specific Airbnb license requirements might still exist or change. Always verify the latest short term rental regulations and Airbnb license requirements directly with local government authorities for Paulista to ensure full compliance before hosting.
(Source: AirROI data, 2026, finding no licensed listings among those analyzed)
Top Performing Airbnb Properties in Paulista (2026)
Benchmark your potential! Explore examples of top-performing Airbnb properties in Paulistabased on Trailing Twelve Month (TTM) revenue. Analyze their characteristics, revenue, occupancy rate, and ADR to understand what drives success in this market.

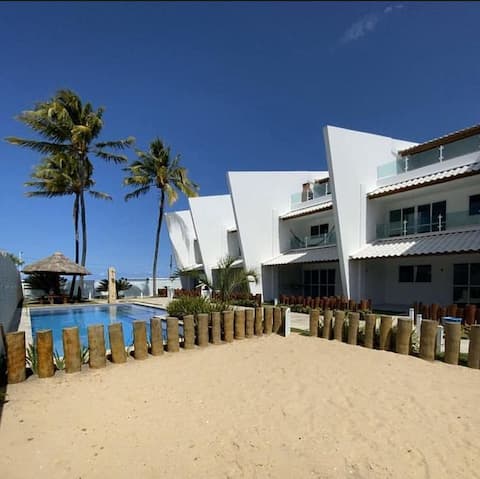
Casa Janga: Two-story house with pool, barbecue, 200m from the waterfront
Entire Place • 2 bedrooms

Penthouse at Maria Farinha Beach with Jacuzzi – Fl
Entire Place • 2 bedrooms

Maria Farinha's Corner
Entire Place • 3 bedrooms
Beachfront flat in Maria Farinha with Jacuzzi.
Entire Place • 2 bedrooms

Cheerful Beach house 5 bedroom with common pool
Entire Place • 5 bedrooms
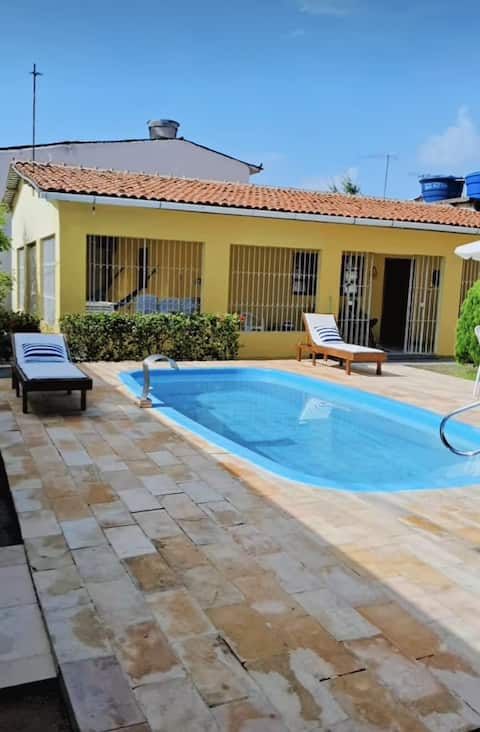
Beautiful House in Janga Cozy and charming
Entire Place • 3 bedrooms
Note: Performance varies based on location, size, amenities, seasonality, and management quality. Data reflects the past 12 months.
Top Performing Airbnb Hosts in Paulista (2026)
Learn from the best! This table showcases top-performing Airbnb hosts in Paulista based on the number of properties managed and estimated total revenue over the past year. Analyze their scale and performance metrics.
| Host Name | Properties | Grossing Revenue | Stay Reviews | Avg Rating |
|---|---|---|---|---|
| Locar House | 7 | $87,032 | 307 | 4.82/5.0 |
| Patricia | 1 | $25,896 | 45 | 5.00/5.0 |
| Cesar Otávio | 1 | $16,422 | 30 | 4.83/5.0 |
| Souza Beach | 1 | $16,280 | 136 | 4.91/5.0 |
| Marta | 1 | $16,248 | 11 | 4.82/5.0 |
| Bárbara | 2 | $15,343 | 49 | 4.95/5.0 |
| Suely Lima | 1 | $15,332 | 43 | 4.98/5.0 |
| Azenira | 1 | $14,602 | 27 | 5.00/5.0 |
| Lucas | 1 | $14,260 | 38 | 4.84/5.0 |
| Djair | 1 | $13,795 | 66 | 4.91/5.0 |
Analyzing the strategies of top hosts, such as their property selection, pricing, and guest communication, can offer valuable lessons for optimizing your own Airbnb operations in Paulista.
Dive Deeper: Advanced Paulista STR Market Data (2026)
Ready to unlock more insights? AirROI provides access to advanced metrics and comprehensive Airbnb data for Paulista. Explore detailed analytics beyond this report to refine your investment strategy, optimize pricing, and maximize your vacation rental profits.
Explore Advanced MetricsPaulista Short-Term Rental Market Composition (2026): Property & Room Types
Room Type Distribution
Property Type Distribution
Market Composition Insights for Paulista
- The Paulista Airbnb market composition is heavily skewed towards Entire Home/Apt listings, which make up 92.4% of the 132 active rentals. This indicates strong guest preference for privacy and space.
- Looking at the property type distribution in Paulista, Apartment/Condo properties are the most common (52.3%), reflecting the local real estate landscape.
- Houses represent a significant 45.5% portion, catering likely to families or larger groups.
- Smaller segments like hotel/boutique (combined 2.3%) offer potential for unique stay experiences.
Paulista Airbnb Room Capacity Analysis (2026): Bedroom Distribution
Distribution of Listings by Number of Bedrooms
Room Capacity Insights for Paulista
- The dominant room capacity in Paulista is 2 bedrooms listings, making up 43.9% of the market. This suggests a strong demand for properties suitable for couples or solo travelers.
- Together, 2 bedrooms and 3 bedrooms properties represent 65.1% of the active Airbnb listings in Paulista, indicating a high concentration in these sizes.
- A significant 37.1% of listings offer 3+ bedrooms, catering to larger groups and families seeking more space in Paulista.
Paulista Vacation Rental Guest Capacity Trends (2026)
Distribution of Listings by Guest Capacity
Guest Capacity Insights for Paulista
- The most common guest capacity trend in Paulista vacation rentals is listings accommodating 8+ guests (28.8%). This suggests the primary traveler segment is likely larger groups.
- Properties designed for 8+ guests and 4 guests dominate the Paulista STR market, accounting for 52.3% of listings.
- 49.3% of properties accommodate 6+ guests, serving the market segment for larger families or group travel in Paulista.
- On average, properties in Paulista are equipped to host 5.4 guests.
Paulista Airbnb Booking Patterns (2026): Available vs. Booked Days
Available Days Distribution
Booked Days Distribution
Booking Pattern Insights for Paulista
- The most common availability pattern in Paulista falls within the 271-366 days range, representing 79.5% of listings. This suggests many properties have significant open periods on their calendars.
- Approximately 95.4% of listings show high availability (181+ days open annually), indicating potential for increased bookings or specific owner usage patterns.
- For booked days, the 1-30 days range is most frequent in Paulista (42.4%), reflecting common guest stay durations or potential owner blocking patterns.
- A notable 4.5% of properties secure long booking periods (181+ days booked per year), highlighting successful long-term rental strategies or significant owner usage.
Paulista Airbnb Minimum Stay Requirements Analysis
Distribution of Listings by Minimum Night Requirement
1 Night
38 listings
28.8% of total
2 Nights
39 listings
29.5% of total
3 Nights
12 listings
9.1% of total
4-6 Nights
4 listings
3% of total
7-29 Nights
2 listings
1.5% of total
30+ Nights
37 listings
28% of total
Key Insights
- The most prevalent minimum stay requirement in Paulista is 2 Nights, adopted by 29.5% of listings. This highlights the market's preference for shorter, flexible bookings.
- A significant segment (28%) caters to monthly stays (30+ nights) in Paulista, pointing to opportunities in the extended-stay market.
Recommendations
- Align with the market by considering a 2 Nights minimum stay, as 29.5% of Paulista hosts use this setting.
- If feasible, allowing 1-night stays, especially midweek or during low season, could capture last-minute bookings, as only 28.8% currently do.
- Explore offering discounts for stays of 30+ nights to attract the 28% of the market seeking extended stays.
- Adjust minimum nights based on seasonality – potentially shorter during low season and longer during peak demand periods in Paulista.
Paulista Airbnb Cancellation Policy Trends Analysis (2026)
Limited
14 listings
10.7% of total
Flexible
34 listings
26% of total
Moderate
30 listings
22.9% of total
Firm
34 listings
26% of total
Strict
19 listings
14.5% of total
Cancellation Policy Insights for Paulista
- The prevailing Airbnb cancellation policy trend in Paulista is Flexible, used by 26% of listings.
- There's a relatively balanced mix between guest-friendly (48.9%) and stricter (40.5%) policies, offering choices for different guest needs.
Recommendations for Hosts
- Consider adopting a Flexible policy to align with the 26% market standard in Paulista.
- Using a Strict policy might deter some guests, as only 14.5% of listings use it. Evaluate if potential revenue protection outweighs possible lower booking rates.
- Regularly review your cancellation policy against competitors and market demand shifts in Paulista.
Paulista STR Booking Lead Time Analysis (2026)
Average Booking Lead Time by Month
Booking Lead Time Insights for Paulista
- The overall average booking lead time for vacation rentals in Paulista is 35 days.
- Guests book furthest in advance for stays during December (average 47 days), likely coinciding with peak travel demand or local events.
- The shortest booking windows occur for stays in July (average 20 days), indicating more last-minute travel plans during this time.
- Seasonally, Winter (42 days avg.) sees the longest lead times, while Spring (25 days avg.) has the shortest, reflecting typical travel planning cycles.
Recommendations for Hosts
- Use the overall average lead time (35 days) as a baseline for your pricing and availability strategy in Paulista.
- For December stays, consider implementing length-of-stay discounts or slightly higher rates for bookings made less than 47 days out to capitalize on advance planning.
- Target marketing efforts for the Winter season well in advance (at least 42 days) to capture early planners.
- Monitor your own booking lead times against these Paulista averages to identify opportunities for dynamic pricing adjustments.
Popular & Essential Airbnb Amenities in Paulista (2026)
Amenity Prevalence
Amenity Insights for Paulista
- Essential amenities in Paulista that guests expect include: Kitchen. Lacking these (this) could significantly impact bookings.
- Popular amenities like Wifi, TV, Free parking on premises are common but not universal. Offering these can provide a competitive edge.
- Warning: Wifi is not universally provided but is considered essential globally. Ensure reliable Wifi is offered.
Recommendations for Hosts
- Ensure your listing includes all essential amenities for Paulista: Kitchen.
- Prioritize adding missing essentials: Kitchen.
- Consider adding popular differentiators like Wifi or TV to increase appeal.
- Highlight unique or less common amenities you offer (e.g., hot tub, dedicated workspace, EV charger) in your listing description and photos.
- Regularly check competitor amenities in Paulista to stay competitive.
Paulista Airbnb Guest Demographics & Profile Analysis (2026)
Guest Profile Summary for Paulista
- The typical guest profile for Airbnb in Paulista consists of primarily domestic travelers (94%), often arriving from nearby Pernambuco, typically belonging to the Post-2000s (Gen Z/Alpha) group (50%), primarily speaking Portuguese or English.
- Domestic travelers account for 94.3% of guests.
- Key international markets include Brazil (94.3%) and United States (1.4%).
- Top languages spoken are Portuguese (50.9%) followed by English (20.8%).
- A significant demographic segment is the Post-2000s (Gen Z/Alpha) group, representing 50% of guests.
Recommendations for Hosts
- Target domestic marketing efforts towards travelers from Pernambuco and Recife.
- Tailor amenities and listing descriptions to appeal to the dominant Post-2000s (Gen Z/Alpha) demographic (e.g., highlight fast WiFi, smart home features, local guides).
- Highlight unique local experiences or amenities relevant to the primary guest profile.
- Consider seasonal promotions aligned with peak travel times for key origin markets.
Nearby Short-Term Rental Market Comparison
How does the Paulista Airbnb market stack up against its neighbors? Compare key performance metrics like average monthly revenue, ADR, and occupancy rates in surrounding areas to understand the broader regional STR landscape.
| Market | Active Properties | Monthly Revenue | Daily Rate | Avg. Occupancy |
|---|---|---|---|---|
| Sirinhaém | 44 | $1,343 | $225.63 | 25% |
| Ipojuca | 4,298 | $847 | $118.24 | 35% |
| Tamandaré | 1,255 | $830 | $141.81 | 28% |
| Maragogi | 768 | $792 | $120.80 | 29% |
| Bananeiras | 228 | $720 | $130.54 | 24% |
| Tibau do Sul | 1,407 | $717 | $90.98 | 33% |
| Camaragibe | 28 | $680 | $118.56 | 27% |
| Cabo de Santo Agostinho | 126 | $623 | $122.43 | 26% |
| São José da Coroa Grande | 186 | $609 | $85.73 | 32% |
| Areia | 25 | $576 | $80.31 | 27% |