Olinda Airbnb Market Analysis 2026: Short Term Rental Data & Vacation Rental Statistics in Pernambuco, Brazil
Is Airbnb profitable in Olinda in 2026? Explore comprehensive Airbnb analytics for Olinda, Pernambuco, Brazil to uncover income potential. This 2026 STR market report for Olinda, based on AirROI data from February 2025 to January 2026, reveals key trends in the market of 273 active listings.
Whether you're considering an Airbnb investment in Olinda, optimizing your existing vacation rental, or exploring rental arbitrage opportunities, understanding the Olinda Airbnb data is crucial. Leveraging the low regulation environment is key to maximizing your short term rental income potential. Let's dive into the specifics.
Key Olinda Airbnb Performance Metrics Overview
Monthly Airbnb Revenue Variations & Income Potential in Olinda (2026)
Understanding the monthly revenue variations for Airbnb listings in Olinda is key to maximizing your short term rental income potential. Seasonality significantly impacts earnings. Our analysis, based on data from the past 12 months, shows that the peak revenue month for STRs in Olinda is typically March, while June often presents the lowest earnings, highlighting opportunities for strategic pricing adjustments during shoulder and low seasons. Explore the typical Airbnb income in Olinda across different performance tiers:
- Best-in-class properties (Top 10%) achieve $1,139+ monthly, often utilizing dynamic pricing and superior guest experiences.
- Strong performing properties (Top 25%) earn $644 or more, indicating effective management and desirable locations/amenities.
- Typical properties (Median) generate around $306 per month, representing the average market performance.
- Entry-level properties (Bottom 25%) see earnings around $118, often with potential for optimization.
Average Monthly Airbnb Earnings Trend in Olinda
Olinda Airbnb Occupancy Rate Trends (2026)
Maximize your bookings by understanding the Olinda STR occupancy trends. Seasonal demand shifts significantly influence how often properties are booked. Typically, Februarysees the highest demand (peak season occupancy), while June experiences the lowest (low season). Effective strategies, like adjusting minimum stays or offering promotions, can boost occupancy during slower periods. Here's how different property tiers perform in Olinda:
- Best-in-class properties (Top 10%) achieve 70%+ occupancy, indicating high desirability and potentially optimized availability.
- Strong performing properties (Top 25%) maintain 45% or higher occupancy, suggesting good market fit and guest satisfaction.
- Typical properties (Median) have an occupancy rate around 24%.
- Entry-level properties (Bottom 25%) average 11% occupancy, potentially facing higher vacancy.
Average Monthly Occupancy Rate Trend in Olinda
Average Daily Rate (ADR) Airbnb Trends in Olinda (2026)
Effective short term rental pricing strategy in Olinda involves understanding monthly ADR fluctuations. The Average Daily Rate (ADR) for Airbnb in Olinda typically peaks in March and dips lowest during July. Leveraging Airbnb dynamic pricing tools or strategies based on this seasonality can significantly boost revenue. Here's a look at the typical nightly rates achieved:
- Best-in-class properties (Top 10%) command rates of $132+ per night, often due to premium features or locations.
- Strong performing properties (Top 25%) achieve nightly rates of $63 or more.
- Typical properties (Median) charge around $37 per night.
- Entry-level properties (Bottom 25%) earn around $24 per night.
Average Daily Rate (ADR) Trend by Month in Olinda
Get Live Olinda Market Intelligence 👇

Explore Real-time Analytics
Airbnb Seasonality Analysis & Trends in Olinda (2026)
Peak Season (March, February, December)
- Revenue averages $723 per month
- Occupancy rates average 32.5%
- Daily rates average $71
Shoulder Season
- Revenue averages $538 per month
- Occupancy maintains around 33.2%
- Daily rates hold near $63
Low Season (April, May, June)
- Revenue drops to average $404 per month
- Occupancy decreases to average 25.7%
- Daily rates adjust to average $62
Seasonality Insights for Olinda
- The Airbnb seasonality in Olinda shows highly seasonal trends requiring careful strategy. While the sections above show seasonal averages, it's also insightful to look at the extremes:
- During the high season, the absolute peak month showcases Olinda's highest earning potential, with monthly revenues capable of climbing to $782, occupancy reaching a high of 37.5%, and ADRs peaking at $74.
- Conversely, the slowest single month of the year, typically falling within the low season, marks the market's lowest point. In this month, revenue might dip to $390, occupancy could drop to 24.2%, and ADRs may adjust down to $60.
- Understanding both the seasonal averages and these monthly peaks and troughs in revenue, occupancy, and ADR is crucial for maximizing your Airbnb profit potential in Olinda.
Seasonal Strategies for Maximizing Profit
- Peak Season: Maximize revenue through premium pricing and potentially longer minimum stays. Ensure high availability.
- Low Season: Offer competitive pricing, special promotions (e.g., extended stay discounts), and flexible cancellation policies. Target off-season travelers like remote workers or budget-conscious guests.
- Shoulder Seasons: Implement dynamic pricing that balances peak and low rates. Target weekend travelers or specific events. Offer slightly more flexible terms than peak season.
- Regularly analyze your own performance against these Olinda seasonality benchmarks and adjust your pricing and availability strategy accordingly.
Best Areas for Airbnb Investment in Olinda (2026)
Exploring the top neighborhoods for short-term rentals in Olinda? This section highlights key areas, outlining why they are attractive for hosts and guests, along with notable local attractions. Consider these locations based on your target guest profile and investment strategy.
| Neighborhood / Area | Why Host Here? (Target Guests & Appeal) | Key Attractions & Landmarks |
|---|---|---|
| Centro Histórico | The historic downtown area known for its colonial architecture and vibrant cultural scene. It's popular with tourists who want to experience the cultural heritage of Olinda. | Olinda's Historic Center, Church of São Salvador do Mundo, Museu de Arte Contemporânea, Passeio Público, Carnival in Olinda |
| Bairro Novo | A family-friendly neighborhood with beautiful views of the Atlantic Ocean. It offers a mix of local life and tourist attractions. | Praia do Bairro Novo, Restaurante do Mercado, Cultural and Historical Points, Local artisan markets |
| Rio Doce | Known for its beautiful beaches and calm atmosphere, Rio Doce attracts visitors looking for relaxation and nature, making it a great spot for beachgoers. | Praia de Rio Doce, Natural Pools, Hiking trails, Local seafood restaurants |
| Sítio Histórico | A UNESCO World Heritage site, it features stunning colonial architecture and is the epicenter of cultural events, making it very attractive for tourists. | Olinda Carnival, Church of Nossa Senhora do Rosário, Mosteiro de São Bento, Art and Craft Shops, Cultural Festivals |
| Carmo | Another historic area, Carmo offers a blend of charm and picturesque streets ideal for exploration, attracting foot traffic from tourists. | Igreja de São Gonçalo do Amarante, Art galleries and handicraft shops, Historic Ruins |
| Praia de Casa Caiada | Offers a tranquil beachfront experience and is popular with visitors seeking sun, sand, and relaxation by the shoreline. | Casa Caiada Beach, Water sports activities, Shacks with local food |
| Vasco da Gama | A neighborhood that combines local culture with beautiful views, appealing to visitors looking for authenticity and good food. | Cultural food markets, Historic landmarks, Local music events |
| Alto da Sé | Famous for its breathtaking views of the surrounding area and the Atlantic Ocean, it attracts many photographers and tourists looking for stunning landmarks. | Sé de Olinda, Mirante do Alto da Sé, Art and handicraft fairs |
Understanding Airbnb License Requirements & STR Laws in Olinda (2026)
While Olinda, Pernambuco, Brazil currently shows low STR regulations, specific Airbnb license requirements might still exist or change. Always verify the latest short term rental regulations and Airbnb license requirements directly with local government authorities for Olinda to ensure full compliance before hosting.
(Source: AirROI data, 2026, based on 1% licensed listings)
Top Performing Airbnb Properties in Olinda (2026)
Benchmark your potential! Explore examples of top-performing Airbnb properties in Olindabased on Trailing Twelve Month (TTM) revenue. Analyze their characteristics, revenue, occupancy rate, and ADR to understand what drives success in this market.
Olinda Beira Mar Contact Us We Sent an Offer
Entire Place • 5 bedrooms

House by the Sea in Olinda
Entire Place • 4 bedrooms
Olinda Carnival House for 10 people
Entire Place • 2 bedrooms

House with a hot tub in the historic site of Olinda.
Entire Place • 3 bedrooms
comfort on the seafront carnival
Entire Place • 2 bedrooms

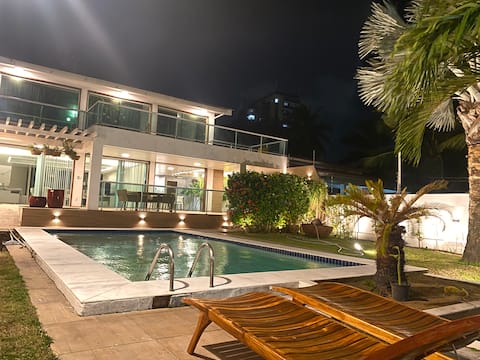
Large house with pool and amazing view in Olinda
Entire Place • 3 bedrooms
Note: Performance varies based on location, size, amenities, seasonality, and management quality. Data reflects the past 12 months.
Top Performing Airbnb Hosts in Olinda (2026)
Learn from the best! This table showcases top-performing Airbnb hosts in Olinda based on the number of properties managed and estimated total revenue over the past year. Analyze their scale and performance metrics.
| Host Name | Properties | Grossing Revenue | Stay Reviews | Avg Rating |
|---|---|---|---|---|
| Luiza | 2 | $78,975 | 46 | 4.90/5.0 |
| Zeneudo | 1 | $43,788 | 87 | 4.90/5.0 |
| Pamella | 2 | $35,147 | 4 | 4.67/5.0 |
| Tereza | 1 | $30,237 | 87 | 4.84/5.0 |
| Wera | 4 | $29,076 | 16 | 4.73/5.0 |
| Thaina E Caio | 1 | $26,882 | 3 | 5.00/5.0 |
| Marina | 2 | $25,135 | 74 | 4.84/5.0 |
| Natalia Reis | 1 | $24,183 | 69 | 4.83/5.0 |
| Joana | 3 | $24,009 | 43 | 4.93/5.0 |
| Aguinaldo | 5 | $22,150 | 78 | 4.96/5.0 |
Analyzing the strategies of top hosts, such as their property selection, pricing, and guest communication, can offer valuable lessons for optimizing your own Airbnb operations in Olinda.
Dive Deeper: Advanced Olinda STR Market Data (2026)
Ready to unlock more insights? AirROI provides access to advanced metrics and comprehensive Airbnb data for Olinda. Explore detailed analytics beyond this report to refine your investment strategy, optimize pricing, and maximize your vacation rental profits.
Explore Advanced MetricsOlinda Short-Term Rental Market Composition (2026): Property & Room Types
Room Type Distribution
Property Type Distribution
Market Composition Insights for Olinda
- The Olinda Airbnb market composition is heavily skewed towards Entire Home/Apt listings, which make up 64.1% of the 273 active rentals. This indicates strong guest preference for privacy and space.
- However, a notable 33.7% share for Private Rooms suggests opportunities for budget-conscious travelers or hosts renting out spare rooms.
- Looking at the property type distribution in Olinda, House properties are the most common (51.3%), reflecting the local real estate landscape.
- Houses represent a significant 51.3% portion, catering likely to families or larger groups.
- The presence of 9.5% Hotel/Boutique listings indicates integration with traditional hospitality.
- Smaller segments like others (combined 1.5%) offer potential for unique stay experiences.
Olinda Airbnb Room Capacity Analysis (2026): Bedroom Distribution
Distribution of Listings by Number of Bedrooms
Room Capacity Insights for Olinda
- The dominant room capacity in Olinda is 1 bedroom listings, making up 28.9% of the market. This suggests a strong demand for properties suitable for couples or solo travelers.
- Together, 1 bedroom and 2 bedrooms properties represent 57.5% of the active Airbnb listings in Olinda, indicating a high concentration in these sizes.
Olinda Vacation Rental Guest Capacity Trends (2026)
Distribution of Listings by Guest Capacity
Guest Capacity Insights for Olinda
- The most common guest capacity trend in Olinda vacation rentals is listings accommodating 4 guests (18.7%). This suggests the primary traveler segment is likely small families or groups.
- Properties designed for 4 guests and 2 guests dominate the Olinda STR market, accounting for 32.3% of listings.
- 25.6% of properties accommodate 6+ guests, serving the market segment for larger families or group travel in Olinda.
- On average, properties in Olinda are equipped to host 3.4 guests.
Olinda Airbnb Booking Patterns (2026): Available vs. Booked Days
Available Days Distribution
Booked Days Distribution
Booking Pattern Insights for Olinda
- The most common availability pattern in Olinda falls within the 271-366 days range, representing 72.2% of listings. This suggests many properties have significant open periods on their calendars.
- Approximately 92.3% of listings show high availability (181+ days open annually), indicating potential for increased bookings or specific owner usage patterns.
- For booked days, the 1-30 days range is most frequent in Olinda (35.5%), reflecting common guest stay durations or potential owner blocking patterns.
- A notable 8.4% of properties secure long booking periods (181+ days booked per year), highlighting successful long-term rental strategies or significant owner usage.
Olinda Airbnb Minimum Stay Requirements Analysis
Distribution of Listings by Minimum Night Requirement
1 Night
103 listings
37.7% of total
2 Nights
77 listings
28.2% of total
3 Nights
15 listings
5.5% of total
4-6 Nights
22 listings
8.1% of total
7-29 Nights
2 listings
0.7% of total
30+ Nights
54 listings
19.8% of total
Key Insights
- The most prevalent minimum stay requirement in Olinda is 1 Night, adopted by 37.7% of listings. This highlights the market's preference for shorter, flexible bookings.
- A strong majority (65.9%) of the Olinda Airbnb data shows acceptance of very short stays (1-2 nights), indicating a dynamic, high-turnover market.
- A significant segment (19.8%) caters to monthly stays (30+ nights) in Olinda, pointing to opportunities in the extended-stay market.
Recommendations
- Align with the market by considering a 1 Night minimum stay, as 37.7% of Olinda hosts use this setting.
- Explore offering discounts for stays of 30+ nights to attract the 19.8% of the market seeking extended stays.
- Adjust minimum nights based on seasonality – potentially shorter during low season and longer during peak demand periods in Olinda.
Olinda Airbnb Cancellation Policy Trends Analysis (2026)
Limited
5 listings
1.8% of total
Flexible
68 listings
24.9% of total
Moderate
63 listings
23.1% of total
Firm
89 listings
32.6% of total
Strict
48 listings
17.6% of total
Cancellation Policy Insights for Olinda
- The prevailing Airbnb cancellation policy trend in Olinda is Firm, used by 32.6% of listings.
- A majority (50.2%) of hosts in Olinda utilize Firm or Strict policies, indicating a market where hosts prioritize booking security.
Recommendations for Hosts
- Consider adopting a Firm policy to align with the 32.6% market standard in Olinda.
- Regularly review your cancellation policy against competitors and market demand shifts in Olinda.
Olinda STR Booking Lead Time Analysis (2026)
Average Booking Lead Time by Month
Booking Lead Time Insights for Olinda
- The overall average booking lead time for vacation rentals in Olinda is 47 days.
- Guests book furthest in advance for stays during February (average 74 days), likely coinciding with peak travel demand or local events.
- The shortest booking windows occur for stays in June (average 20 days), indicating more last-minute travel plans during this time.
- Seasonally, Winter (55 days avg.) sees the longest lead times, while Summer (25 days avg.) has the shortest, reflecting typical travel planning cycles.
Recommendations for Hosts
- Use the overall average lead time (47 days) as a baseline for your pricing and availability strategy in Olinda.
- For February stays, consider implementing length-of-stay discounts or slightly higher rates for bookings made less than 74 days out to capitalize on advance planning.
- Target marketing efforts for the Winter season well in advance (at least 55 days) to capture early planners.
- Monitor your own booking lead times against these Olinda averages to identify opportunities for dynamic pricing adjustments.
Popular & Essential Airbnb Amenities in Olinda (2026)
Amenity Prevalence
Amenity Insights for Olinda
- Essential amenities in Olinda that guests expect include: Wifi. Lacking these (this) could significantly impact bookings.
- Popular amenities like Kitchen, TV, Air conditioning are common but not universal. Offering these can provide a competitive edge.
Recommendations for Hosts
- Ensure your listing includes all essential amenities for Olinda: Wifi.
- Prioritize adding missing essentials: Wifi.
- Consider adding popular differentiators like Kitchen or TV to increase appeal.
- Highlight unique or less common amenities you offer (e.g., hot tub, dedicated workspace, EV charger) in your listing description and photos.
- Regularly check competitor amenities in Olinda to stay competitive.
Olinda Airbnb Guest Demographics & Profile Analysis (2026)
Guest Profile Summary for Olinda
- The typical guest profile for Airbnb in Olinda consists of primarily domestic travelers (76%), often arriving from nearby São Paulo, typically belonging to the Post-2000s (Gen Z/Alpha) group (50%), primarily speaking Portuguese or English.
- Domestic travelers account for 76.1% of guests.
- Key international markets include Brazil (76.1%) and France (4.9%).
- Top languages spoken are Portuguese (33.7%) followed by English (30%).
- A significant demographic segment is the Post-2000s (Gen Z/Alpha) group, representing 50% of guests.
Recommendations for Hosts
- Target domestic marketing efforts towards travelers from São Paulo and Pernambuco.
- Tailor amenities and listing descriptions to appeal to the dominant Post-2000s (Gen Z/Alpha) demographic (e.g., highlight fast WiFi, smart home features, local guides).
- Highlight unique local experiences or amenities relevant to the primary guest profile.
- Consider seasonal promotions aligned with peak travel times for key origin markets.
Nearby Short-Term Rental Market Comparison
How does the Olinda Airbnb market stack up against its neighbors? Compare key performance metrics like average monthly revenue, ADR, and occupancy rates in surrounding areas to understand the broader regional STR landscape.
| Market | Active Properties | Monthly Revenue | Daily Rate | Avg. Occupancy |
|---|---|---|---|---|
| Passo de Camaragibe | 155 | $2,288 | $323.99 | 30% |
| Sirinhaém | 44 | $1,343 | $225.63 | 25% |
| Porto de Pedras | 434 | $1,180 | $167.35 | 31% |
| Japaratinga | 178 | $895 | $118.94 | 29% |
| Barra de São Miguel | 441 | $875 | $174.19 | 24% |
| Paripueira | 149 | $867 | $150.43 | 26% |
| Ipojuca | 4,298 | $847 | $118.24 | 35% |
| Tamandaré | 1,255 | $830 | $141.81 | 28% |
| São Miguel dos Milagres | 549 | $801 | $126.23 | 27% |
| Maragogi | 768 | $792 | $120.80 | 29% |