Ipojuca Airbnb Market Analysis 2026: Short Term Rental Data & Vacation Rental Statistics in Pernambuco, Brazil
Is Airbnb profitable in Ipojuca in 2026? Explore comprehensive Airbnb analytics for Ipojuca, Pernambuco, Brazil to uncover income potential. This 2026 STR market report for Ipojuca, based on AirROI data from February 2025 to January 2026, reveals key trends in the bustling market of 4,298 active listings.
Whether you're considering an Airbnb investment in Ipojuca, optimizing your existing vacation rental, or exploring rental arbitrage opportunities, understanding the Ipojuca Airbnb data is crucial. Leveraging the low regulation environment is key to maximizing your short term rental income potential. Let's dive into the specifics.
Key Ipojuca Airbnb Performance Metrics Overview
Monthly Airbnb Revenue Variations & Income Potential in Ipojuca (2026)
Understanding the monthly revenue variations for Airbnb listings in Ipojuca is key to maximizing your short term rental income potential. Seasonality significantly impacts earnings. Our analysis, based on data from the past 12 months, shows that the peak revenue month for STRs in Ipojuca is typically January, while May often presents the lowest earnings, highlighting opportunities for strategic pricing adjustments during shoulder and low seasons. Explore the typical Airbnb income in Ipojuca across different performance tiers:
- Best-in-class properties (Top 10%) achieve $2,699+ monthly, often utilizing dynamic pricing and superior guest experiences.
- Strong performing properties (Top 25%) earn $1,545 or more, indicating effective management and desirable locations/amenities.
- Typical properties (Median) generate around $822 per month, representing the average market performance.
- Entry-level properties (Bottom 25%) see earnings around $379, often with potential for optimization.
Average Monthly Airbnb Earnings Trend in Ipojuca
Ipojuca Airbnb Occupancy Rate Trends (2026)
Maximize your bookings by understanding the Ipojuca STR occupancy trends. Seasonal demand shifts significantly influence how often properties are booked. Typically, Februarysees the highest demand (peak season occupancy), while June experiences the lowest (low season). Effective strategies, like adjusting minimum stays or offering promotions, can boost occupancy during slower periods. Here's how different property tiers perform in Ipojuca:
- Best-in-class properties (Top 10%) achieve 80%+ occupancy, indicating high desirability and potentially optimized availability.
- Strong performing properties (Top 25%) maintain 61% or higher occupancy, suggesting good market fit and guest satisfaction.
- Typical properties (Median) have an occupancy rate around 34%.
- Entry-level properties (Bottom 25%) average 16% occupancy, potentially facing higher vacancy.
Average Monthly Occupancy Rate Trend in Ipojuca
Average Daily Rate (ADR) Airbnb Trends in Ipojuca (2026)
Effective short term rental pricing strategy in Ipojuca involves understanding monthly ADR fluctuations. The Average Daily Rate (ADR) for Airbnb in Ipojuca typically peaks in January and dips lowest during May. Leveraging Airbnb dynamic pricing tools or strategies based on this seasonality can significantly boost revenue. Here's a look at the typical nightly rates achieved:
- Best-in-class properties (Top 10%) command rates of $228+ per night, often due to premium features or locations.
- Strong performing properties (Top 25%) achieve nightly rates of $130 or more.
- Typical properties (Median) charge around $77 per night.
- Entry-level properties (Bottom 25%) earn around $53 per night.
Average Daily Rate (ADR) Trend by Month in Ipojuca
Get Live Ipojuca Market Intelligence 👇

Explore Real-time Analytics
Airbnb Seasonality Analysis & Trends in Ipojuca (2026)
Peak Season (January, December, March)
- Revenue averages $1,743 per month
- Occupancy rates average 41.8%
- Daily rates average $140
Shoulder Season
- Revenue averages $1,210 per month
- Occupancy maintains around 41.6%
- Daily rates hold near $115
Low Season (May, June, August)
- Revenue drops to average $871 per month
- Occupancy decreases to average 32.8%
- Daily rates adjust to average $108
Seasonality Insights for Ipojuca
- The Airbnb seasonality in Ipojuca shows highly seasonal trends requiring careful strategy. While the sections above show seasonal averages, it's also insightful to look at the extremes:
- During the high season, the absolute peak month showcases Ipojuca's highest earning potential, with monthly revenues capable of climbing to $1,883, occupancy reaching a high of 47.2%, and ADRs peaking at $155.
- Conversely, the slowest single month of the year, typically falling within the low season, marks the market's lowest point. In this month, revenue might dip to $828, occupancy could drop to 30.0%, and ADRs may adjust down to $106.
- Understanding both the seasonal averages and these monthly peaks and troughs in revenue, occupancy, and ADR is crucial for maximizing your Airbnb profit potential in Ipojuca.
Seasonal Strategies for Maximizing Profit
- Peak Season: Maximize revenue through premium pricing and potentially longer minimum stays. Ensure high availability.
- Low Season: Offer competitive pricing, special promotions (e.g., extended stay discounts), and flexible cancellation policies. Target off-season travelers like remote workers or budget-conscious guests.
- Shoulder Seasons: Implement dynamic pricing that balances peak and low rates. Target weekend travelers or specific events. Offer slightly more flexible terms than peak season.
- Regularly analyze your own performance against these Ipojuca seasonality benchmarks and adjust your pricing and availability strategy accordingly.
Best Areas for Airbnb Investment in Ipojuca (2026)
Exploring the top neighborhoods for short-term rentals in Ipojuca? This section highlights key areas, outlining why they are attractive for hosts and guests, along with notable local attractions. Consider these locations based on your target guest profile and investment strategy.
| Neighborhood / Area | Why Host Here? (Target Guests & Appeal) | Key Attractions & Landmarks |
|---|---|---|
| Praia de Muro Alto | Famous for its stunning natural pools and tranquil atmosphere, Muro Alto is a prime location for beach lovers and families looking for a relaxing getaway. | Natural Pools of Muro Alto, Beaches of Cupe, Praia do Pontal do Cupe, Snorkeling, Beachfront Resorts |
| Praia de Porto de Galinhas | One of Brazil's most famous beach destinations, known for its beautiful sands, vibrant nightlife, and rich marine life. It's ideal for tourists seeking adventure and leisure. | Natural Pools of Porto de Galinhas, Beaches of Maracaípe, Vila de Porto de Galinhas, Diving and Snorkeling, Horseback Riding on the beach |
| Centro de Ipojuca | The town center features local culture and commerce, making it an attractive option for guests who want to experience the local lifestyle and convenient amenities. | Local Markets, Cultural Festivals, Restaurants, Historical Sites |
| Maracaípe | A quieter beach that attracts surfers and those looking for a peaceful retreat away from the hustle and bustle of tourist-heavy areas. | Surfing at Maracaípe Beach, Mangroves, Natural Beauty |
| Praia do Pontal | Known for its rugged beauty and stunning cliffs, Pontal is appealing to nature enthusiasts and those looking for scenic views and tranquility. | Beautiful Cliffs, Trekking Trails, Scenic Views |
| Reserva do Paiva | A luxury gated community that offers high-end amenities and a beautiful beach, catering to those seeking a more upscale vacation experience. | Private Beaches, Luxury Resorts, Golf Courses, Spa Services |
| Ipojuca's Cultural District | Focus on local culture and arts, perfect for travelers interested in experiencing the historical and cultural aspects of Ipojuca. | Art Galleries, Cultural Events, Historical Buildings |
| Praia do Cupe | Less crowded than its famous neighbor, offers a laid-back vibe and beautiful scenery, ideal for a relaxing beach vacation. | Quiet Beaches, Local Restaurants, Watersports |
Understanding Airbnb License Requirements & STR Laws in Ipojuca (2026)
While Ipojuca, Pernambuco, Brazil currently shows low STR regulations, specific Airbnb license requirements might still exist or change. Always verify the latest short term rental regulations and Airbnb license requirements directly with local government authorities for Ipojuca to ensure full compliance before hosting.
(Source: AirROI data, 2026, based on 0% licensed listings)
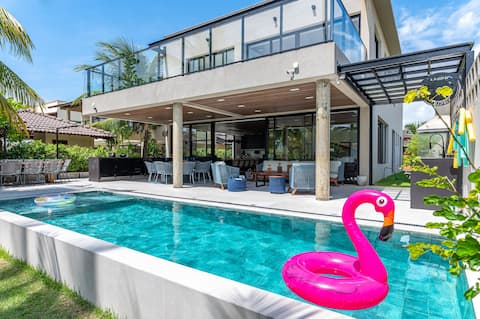
Top Performing Airbnb Properties in Ipojuca (2026)
Benchmark your potential! Explore examples of top-performing Airbnb properties in Ipojucabased on Trailing Twelve Month (TTM) revenue. Analyze their characteristics, revenue, occupancy rate, and ADR to understand what drives success in this market.

Casa Kala• a typical Pernambuco house
Entire Place • 5 bedrooms

Casa Amendoeiras, charm and comfort by the sea
Entire Place • 5 bedrooms

Casa Pe in the sand on the beach of Porto de Galinhas
Entire Place • 4 bedrooms
7 En-suites Praia de Muro Alto with Cook
Entire Place • 7 bedrooms

6-bedroom oceanfront bungalow in Porto de Galinhas
Entire Place • 7 bedrooms
Mana Beach - 62m² - 2 bedrooms - 1 Suite
Entire Place • 2 bedrooms
Note: Performance varies based on location, size, amenities, seasonality, and management quality. Data reflects the past 12 months.
Top Performing Airbnb Hosts in Ipojuca (2026)
Learn from the best! This table showcases top-performing Airbnb hosts in Ipojuca based on the number of properties managed and estimated total revenue over the past year. Analyze their scale and performance metrics.
| Host Name | Properties | Grossing Revenue | Stay Reviews | Avg Rating |
|---|---|---|---|---|
| Herbert HM TEMPORADA | 144 | $1,551,723 | 2727 | 4.74/5.0 |
| Giordani Brevelar | 76 | $1,167,917 | 988 | 4.74/5.0 |
| Alexandre | 32 | $925,458 | 225 | 4.90/5.0 |
| Carneiros Temporada | 83 | $884,257 | 691 | 4.54/5.0 |
| Carpediem Homes | 120 | $860,360 | 846 | 4.51/5.0 |
| Allan | 34 | $656,648 | 557 | 4.89/5.0 |
| Rita Farias | 49 | $629,669 | 2106 | 4.80/5.0 |
| Anfitrião Legal | 46 | $503,297 | 1012 | 4.73/5.0 |
| Temporada Inn | 53 | $481,775 | 1093 | 4.48/5.0 |
| Mayhost | 61 | $468,626 | 2249 | 4.60/5.0 |
Analyzing the strategies of top hosts, such as their property selection, pricing, and guest communication, can offer valuable lessons for optimizing your own Airbnb operations in Ipojuca.
Dive Deeper: Advanced Ipojuca STR Market Data (2026)
Ready to unlock more insights? AirROI provides access to advanced metrics and comprehensive Airbnb data for Ipojuca. Explore detailed analytics beyond this report to refine your investment strategy, optimize pricing, and maximize your vacation rental profits.
Explore Advanced MetricsIpojuca Short-Term Rental Market Composition (2026): Property & Room Types
Room Type Distribution
Property Type Distribution
Market Composition Insights for Ipojuca
- The Ipojuca Airbnb market composition is heavily skewed towards Entire Home/Apt listings, which make up 93.7% of the 4,298 active rentals. This indicates strong guest preference for privacy and space.
- Looking at the property type distribution in Ipojuca, Apartment/Condo properties are the most common (80.3%), reflecting the local real estate landscape.
- Houses represent a significant 16.1% portion, catering likely to families or larger groups.
- Smaller segments like hotel/boutique, others, outdoor/unique (combined 3.5%) offer potential for unique stay experiences.
Ipojuca Airbnb Room Capacity Analysis (2026): Bedroom Distribution
Distribution of Listings by Number of Bedrooms
Room Capacity Insights for Ipojuca
- The dominant room capacity in Ipojuca is 1 bedroom listings, making up 43.7% of the market. This suggests a strong demand for properties suitable for couples or solo travelers.
- Together, 1 bedroom and 2 bedrooms properties represent 70.2% of the active Airbnb listings in Ipojuca, indicating a high concentration in these sizes.
- A significant 21.9% of listings offer 3+ bedrooms, catering to larger groups and families seeking more space in Ipojuca.
Ipojuca Vacation Rental Guest Capacity Trends (2026)
Distribution of Listings by Guest Capacity
Guest Capacity Insights for Ipojuca
- The most common guest capacity trend in Ipojuca vacation rentals is listings accommodating 4 guests (27.1%). This suggests the primary traveler segment is likely small families or groups.
- Properties designed for 4 guests and 8+ guests dominate the Ipojuca STR market, accounting for 49.0% of listings.
- 44.5% of properties accommodate 6+ guests, serving the market segment for larger families or group travel in Ipojuca.
- On average, properties in Ipojuca are equipped to host 5.3 guests.
Ipojuca Airbnb Booking Patterns (2026): Available vs. Booked Days
Available Days Distribution
Booked Days Distribution
Booking Pattern Insights for Ipojuca
- The most common availability pattern in Ipojuca falls within the 271-366 days range, representing 60.3% of listings. This suggests many properties have significant open periods on their calendars.
- Approximately 83.7% of listings show high availability (181+ days open annually), indicating potential for increased bookings or specific owner usage patterns.
- For booked days, the 31-90 days range is most frequent in Ipojuca (34.5%), reflecting common guest stay durations or potential owner blocking patterns.
- A notable 17.1% of properties secure long booking periods (181+ days booked per year), highlighting successful long-term rental strategies or significant owner usage.
Ipojuca Airbnb Minimum Stay Requirements Analysis
Distribution of Listings by Minimum Night Requirement
1 Night
418 listings
9.7% of total
2 Nights
1982 listings
46.1% of total
3 Nights
170 listings
4% of total
4-6 Nights
75 listings
1.7% of total
7-29 Nights
15 listings
0.3% of total
30+ Nights
1638 listings
38.1% of total
Key Insights
- The most prevalent minimum stay requirement in Ipojuca is 2 Nights, adopted by 46.1% of listings. This highlights the market's preference for shorter, flexible bookings.
- A significant segment (38.1%) caters to monthly stays (30+ nights) in Ipojuca, pointing to opportunities in the extended-stay market.
Recommendations
- Align with the market by considering a 2 Nights minimum stay, as 46.1% of Ipojuca hosts use this setting.
- If feasible, allowing 1-night stays, especially midweek or during low season, could capture last-minute bookings, as only 9.7% currently do.
- A 2-night minimum appears standard (46.1%). Consider this for weekends or peak periods.
- Explore offering discounts for stays of 30+ nights to attract the 38.1% of the market seeking extended stays.
- Adjust minimum nights based on seasonality – potentially shorter during low season and longer during peak demand periods in Ipojuca.
Ipojuca Airbnb Cancellation Policy Trends Analysis (2026)
Non-refundable
6 listings
0.1% of total
Super Strict 60 Days
30 listings
0.7% of total
Refundable
11 listings
0.3% of total
Limited
94 listings
2.2% of total
Super Strict 30 Days
53 listings
1.2% of total
Flexible
757 listings
17.7% of total
Moderate
1351 listings
31.5% of total
Firm
1454 listings
33.9% of total
Strict
529 listings
12.3% of total
Cancellation Policy Insights for Ipojuca
- The prevailing Airbnb cancellation policy trend in Ipojuca is Firm, used by 33.9% of listings.
- There's a relatively balanced mix between guest-friendly (49.2%) and stricter (46.2%) policies, offering choices for different guest needs.
Recommendations for Hosts
- Consider adopting a Firm policy to align with the 33.9% market standard in Ipojuca.
- Using a Strict policy might deter some guests, as only 12.3% of listings use it. Evaluate if potential revenue protection outweighs possible lower booking rates.
- Regularly review your cancellation policy against competitors and market demand shifts in Ipojuca.
Ipojuca STR Booking Lead Time Analysis (2026)
Average Booking Lead Time by Month
Booking Lead Time Insights for Ipojuca
- The overall average booking lead time for vacation rentals in Ipojuca is 48 days.
- Guests book furthest in advance for stays during December (average 66 days), likely coinciding with peak travel demand or local events.
- The shortest booking windows occur for stays in June (average 28 days), indicating more last-minute travel plans during this time.
- Seasonally, Winter (58 days avg.) sees the longest lead times, while Summer (33 days avg.) has the shortest, reflecting typical travel planning cycles.
Recommendations for Hosts
- Use the overall average lead time (48 days) as a baseline for your pricing and availability strategy in Ipojuca.
- For December stays, consider implementing length-of-stay discounts or slightly higher rates for bookings made less than 66 days out to capitalize on advance planning.
- Target marketing efforts for the Winter season well in advance (at least 58 days) to capture early planners.
- Monitor your own booking lead times against these Ipojuca averages to identify opportunities for dynamic pricing adjustments.
Popular & Essential Airbnb Amenities in Ipojuca (2026)
Amenity Prevalence
Amenity Insights for Ipojuca
- Essential amenities in Ipojuca that guests expect include: Air conditioning, Wifi, TV. Lacking these (any) could significantly impact bookings.
- Popular amenities like Kitchen, Pool, Free parking on premises are common but not universal. Offering these can provide a competitive edge.
- A pool is a highly desired but not standard amenity, making it a key feature for attracting guests seeking leisure in Ipojuca.
Recommendations for Hosts
- Ensure your listing includes all essential amenities for Ipojuca: Air conditioning, Wifi, TV.
- Prioritize adding missing essentials: Air conditioning, Wifi, TV.
- Consider adding popular differentiators like Kitchen or Pool to increase appeal.
- Highlight unique or less common amenities you offer (e.g., hot tub, dedicated workspace, EV charger) in your listing description and photos.
- Regularly check competitor amenities in Ipojuca to stay competitive.
Ipojuca Airbnb Guest Demographics & Profile Analysis (2026)
Guest Profile Summary for Ipojuca
- The typical guest profile for Airbnb in Ipojuca consists of primarily domestic travelers (86%), often arriving from nearby Pernambuco, typically belonging to the Post-2000s (Gen Z/Alpha) group (50%), primarily speaking Portuguese or English.
- Domestic travelers account for 86.1% of guests.
- Key international markets include Brazil (86.1%) and Argentina (6.4%).
- Top languages spoken are Portuguese (48.1%) followed by English (26.9%).
- A significant demographic segment is the Post-2000s (Gen Z/Alpha) group, representing 50% of guests.
Recommendations for Hosts
- Target domestic marketing efforts towards travelers from Pernambuco and Recife.
- Tailor amenities and listing descriptions to appeal to the dominant Post-2000s (Gen Z/Alpha) demographic (e.g., highlight fast WiFi, smart home features, local guides).
- Highlight unique local experiences or amenities relevant to the primary guest profile.
- Consider seasonal promotions aligned with peak travel times for key origin markets.
Nearby Short-Term Rental Market Comparison
How does the Ipojuca Airbnb market stack up against its neighbors? Compare key performance metrics like average monthly revenue, ADR, and occupancy rates in surrounding areas to understand the broader regional STR landscape.
| Market | Active Properties | Monthly Revenue | Daily Rate | Avg. Occupancy |
|---|---|---|---|---|
| Passo de Camaragibe | 155 | $2,288 | $323.99 | 30% |
| Sirinhaém | 44 | $1,343 | $225.63 | 25% |
| Porto de Pedras | 434 | $1,180 | $167.35 | 31% |
| Japaratinga | 178 | $895 | $118.94 | 29% |
| Barra de São Miguel | 441 | $875 | $174.19 | 24% |
| Paripueira | 149 | $867 | $150.43 | 26% |
| Tamandaré | 1,255 | $830 | $141.81 | 28% |
| São Miguel dos Milagres | 549 | $801 | $126.23 | 27% |
| Maragogi | 768 | $792 | $120.80 | 29% |
| Maceió | 2,821 | $714 | $69.93 | 42% |