Ilha de Itamaracá Airbnb Market Analysis 2026: Short Term Rental Data & Vacation Rental Statistics in Pernambuco, Brazil
Is Airbnb profitable in Ilha de Itamaracá in 2026? Explore comprehensive Airbnb analytics for Ilha de Itamaracá, Pernambuco, Brazil to uncover income potential. This 2026 STR market report for Ilha de Itamaracá, based on AirROI data from February 2025 to January 2026, reveals key trends in the niche market of 160 active listings.
Whether you're considering an Airbnb investment in Ilha de Itamaracá, optimizing your existing vacation rental, or exploring rental arbitrage opportunities, understanding the Ilha de Itamaracá Airbnb data is crucial. Leveraging the low regulation environment is key to maximizing your short term rental income potential. Let's dive into the specifics.
Key Ilha de Itamaracá Airbnb Performance Metrics Overview
Monthly Airbnb Revenue Variations & Income Potential in Ilha de Itamaracá (2026)
Understanding the monthly revenue variations for Airbnb listings in Ilha de Itamaracá is key to maximizing your short term rental income potential. Seasonality significantly impacts earnings. Our analysis, based on data from the past 12 months, shows that the peak revenue month for STRs in Ilha de Itamaracá is typically January, while August often presents the lowest earnings, highlighting opportunities for strategic pricing adjustments during shoulder and low seasons. Explore the typical Airbnb income in Ilha de Itamaracá across different performance tiers:
- Best-in-class properties (Top 10%) achieve $1,285+ monthly, often utilizing dynamic pricing and superior guest experiences.
- Strong performing properties (Top 25%) earn $725 or more, indicating effective management and desirable locations/amenities.
- Typical properties (Median) generate around $330 per month, representing the average market performance.
- Entry-level properties (Bottom 25%) see earnings around $153, often with potential for optimization.
Average Monthly Airbnb Earnings Trend in Ilha de Itamaracá
Ilha de Itamaracá Airbnb Occupancy Rate Trends (2026)
Maximize your bookings by understanding the Ilha de Itamaracá STR occupancy trends. Seasonal demand shifts significantly influence how often properties are booked. Typically, Marchsees the highest demand (peak season occupancy), while August experiences the lowest (low season). Effective strategies, like adjusting minimum stays or offering promotions, can boost occupancy during slower periods. Here's how different property tiers perform in Ilha de Itamaracá:
- Best-in-class properties (Top 10%) achieve 40%+ occupancy, indicating high desirability and potentially optimized availability.
- Strong performing properties (Top 25%) maintain 27% or higher occupancy, suggesting good market fit and guest satisfaction.
- Typical properties (Median) have an occupancy rate around 15%.
- Entry-level properties (Bottom 25%) average 8% occupancy, potentially facing higher vacancy.
Average Monthly Occupancy Rate Trend in Ilha de Itamaracá
Average Daily Rate (ADR) Airbnb Trends in Ilha de Itamaracá (2026)
Effective short term rental pricing strategy in Ilha de Itamaracá involves understanding monthly ADR fluctuations. The Average Daily Rate (ADR) for Airbnb in Ilha de Itamaracá typically peaks in January and dips lowest during April. Leveraging Airbnb dynamic pricing tools or strategies based on this seasonality can significantly boost revenue. Here's a look at the typical nightly rates achieved:
- Best-in-class properties (Top 10%) command rates of $157+ per night, often due to premium features or locations.
- Strong performing properties (Top 25%) achieve nightly rates of $98 or more.
- Typical properties (Median) charge around $71 per night.
- Entry-level properties (Bottom 25%) earn around $47 per night.
Average Daily Rate (ADR) Trend by Month in Ilha de Itamaracá
Get Live Ilha de Itamaracá Market Intelligence 👇

Explore Real-time Analytics
Airbnb Seasonality Analysis & Trends in Ilha de Itamaracá (2026)
Peak Season (January, March, December)
- Revenue averages $793 per month
- Occupancy rates average 25.6%
- Daily rates average $95
Shoulder Season
- Revenue averages $519 per month
- Occupancy maintains around 19.2%
- Daily rates hold near $86
Low Season (June, July, August)
- Revenue drops to average $418 per month
- Occupancy decreases to average 15.5%
- Daily rates adjust to average $85
Seasonality Insights for Ilha de Itamaracá
- The Airbnb seasonality in Ilha de Itamaracá shows highly seasonal trends requiring careful strategy. While the sections above show seasonal averages, it's also insightful to look at the extremes:
- During the high season, the absolute peak month showcases Ilha de Itamaracá's highest earning potential, with monthly revenues capable of climbing to $833, occupancy reaching a high of 28.4%, and ADRs peaking at $101.
- Conversely, the slowest single month of the year, typically falling within the low season, marks the market's lowest point. In this month, revenue might dip to $386, occupancy could drop to 14.0%, and ADRs may adjust down to $82.
- Understanding both the seasonal averages and these monthly peaks and troughs in revenue, occupancy, and ADR is crucial for maximizing your Airbnb profit potential in Ilha de Itamaracá.
Seasonal Strategies for Maximizing Profit
- Peak Season: Maximize revenue through premium pricing and potentially longer minimum stays. Ensure high availability.
- Low Season: Offer competitive pricing, special promotions (e.g., extended stay discounts), and flexible cancellation policies. Target off-season travelers like remote workers or budget-conscious guests.
- Shoulder Seasons: Implement dynamic pricing that balances peak and low rates. Target weekend travelers or specific events. Offer slightly more flexible terms than peak season.
- Regularly analyze your own performance against these Ilha de Itamaracá seasonality benchmarks and adjust your pricing and availability strategy accordingly.
Best Areas for Airbnb Investment in Ilha de Itamaracá (2026)
Exploring the top neighborhoods for short-term rentals in Ilha de Itamaracá? This section highlights key areas, outlining why they are attractive for hosts and guests, along with notable local attractions. Consider these locations based on your target guest profile and investment strategy.
| Neighborhood / Area | Why Host Here? (Target Guests & Appeal) | Key Attractions & Landmarks |
|---|---|---|
| Praia do Forte | A beautiful beach known for its clear waters and serene atmosphere. Ideal for families and tourists looking for a peaceful retreat close to nature. | Forte de São João Batista, Local seafood restaurants, Kayaking in the mangroves, Relaxing beach spots, Snorkeling opportunities |
| Praia de Catuama | A vibrant beach destination with a lively atmosphere, popular for water sports and beach activities. Attracts both local and international visitors seeking fun and adventure. | Catuama Beach, Jet ski rentals, Beach bars and cafes, Sunset viewing spots, Surfing opportunities |
| Praia do Sossego | Known for its tranquility and natural beauty, this beach is perfect for relaxation and escaping the hustle and bustle. Attracts those looking for a more laid-back experience. | Secluded beach areas, Natural pools, Eco-tourism hikes, Bird watching, Local artisanal markets |
| Ilha de Itamaracá Historic Center | Rich in history and culture, this area is ideal for travelers interested in Brazilian colonial architecture and historical sites. Perfect for cultural tourism. | Igreja da Nossa Senhora da Conceição, Museu Fortim do Queijo, Lighthouse at Ponta de Pedras, Vibrant local crafts market, Historical colonial buildings |
| Praia de Itamaracá | This popular beach draws crowds for its beauty and recreational activities, making it appealing for tourists looking for excitement and entertainment. | Water sports rentals, Beach volleyball courts, Local food stalls, Children's play areas, Sunbathing spots |
| Forte Orange | A historical fort that provides unique insights into Brazil's colonial past. Visitors enjoy photography and exploring the fort's architecture. | Historical fortifications, Panoramic views of the sea, Guided historical tours, Cultural events and reenactments, Nearby beach access |
| Praia do Chapéu | Known for its stunning landscape and less crowded beaches, this area attracts people looking for a natural beach experience with scenic beauty. | Gorgeous beach scenery, Coastal trails, Peaceful picnic spots, Wildlife observation, Tranquil swimming areas |
| Pontal de Itamaracá | A must-visit spot for its breathtaking ocean views and recreational opportunities. Ideal for photographers and those who enjoy outdoor activities. | Natural viewpoints, Dolphin watching tours, Kayaking and boating, Fishing opportunities, Nearby restaurants |
Understanding Airbnb License Requirements & STR Laws in Ilha de Itamaracá (2026)
While Ilha de Itamaracá, Pernambuco, Brazil currently shows low STR regulations, specific Airbnb license requirements might still exist or change. Always verify the latest short term rental regulations and Airbnb license requirements directly with local government authorities for Ilha de Itamaracá to ensure full compliance before hosting.
(Source: AirROI data, 2026, finding no licensed listings among those analyzed)
Top Performing Airbnb Properties in Ilha de Itamaracá (2026)
Benchmark your potential! Explore examples of top-performing Airbnb properties in Ilha de Itamaracábased on Trailing Twelve Month (TTM) revenue. Analyze their characteristics, revenue, occupancy rate, and ADR to understand what drives success in this market.

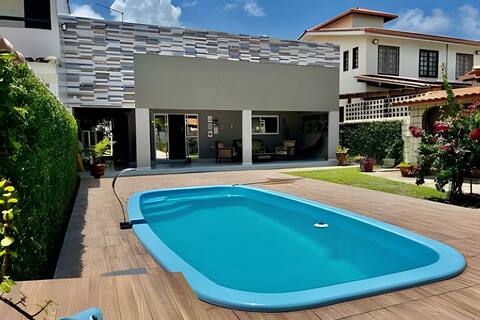
Itamaracá beach house - Pontal da Ilha
Entire Place • 6 bedrooms

Waterfront, swimming pool, 20 beds Pontal de Itamaracá
Entire Place • 7 bedrooms
Casa Itamaracá
Entire Place • 4 bedrooms
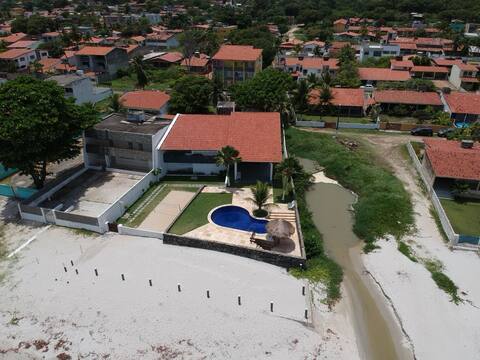
Itamaracá Beachfront – 7 Bedrooms up to 25 Guests
Entire Place • 7 bedrooms

Casa Solar da Ilha /Itamaracá/Vila Velha PE
Entire Place • 3 bedrooms

Grandma Rute's house, nice, quiet, safe,
Entire Place • 6 bedrooms
Note: Performance varies based on location, size, amenities, seasonality, and management quality. Data reflects the past 12 months.
Top Performing Airbnb Hosts in Ilha de Itamaracá (2026)
Learn from the best! This table showcases top-performing Airbnb hosts in Ilha de Itamaracá based on the number of properties managed and estimated total revenue over the past year. Analyze their scale and performance metrics.
| Host Name | Properties | Grossing Revenue | Stay Reviews | Avg Rating |
|---|---|---|---|---|
| Anthony | 13 | $66,908 | 233 | 4.87/5.0 |
| Lucas | 1 | $28,087 | 3 | 5.00/5.0 |
| Monica Erline | 1 | $26,029 | 65 | 4.57/5.0 |
| Jackie & Mark | 6 | $22,592 | 128 | 4.89/5.0 |
| Marcelo | 2 | $21,556 | 46 | 4.93/5.0 |
| Maria José Barros De Vasconcel | 1 | $19,029 | 29 | 4.93/5.0 |
| Rogerio | 10 | $15,917 | 20 | 4.42/5.0 |
| Tati Mota | 1 | $15,538 | 1 | Not Rated |
| Camila Souza | 1 | $15,133 | 22 | 4.73/5.0 |
| Carlos Morais | 1 | $14,831 | 54 | 4.96/5.0 |
Analyzing the strategies of top hosts, such as their property selection, pricing, and guest communication, can offer valuable lessons for optimizing your own Airbnb operations in Ilha de Itamaracá.
Dive Deeper: Advanced Ilha de Itamaracá STR Market Data (2026)
Ready to unlock more insights? AirROI provides access to advanced metrics and comprehensive Airbnb data for Ilha de Itamaracá. Explore detailed analytics beyond this report to refine your investment strategy, optimize pricing, and maximize your vacation rental profits.
Explore Advanced MetricsIlha de Itamaracá Short-Term Rental Market Composition (2026): Property & Room Types
Room Type Distribution
Property Type Distribution
Market Composition Insights for Ilha de Itamaracá
- The Ilha de Itamaracá Airbnb market composition is heavily skewed towards Entire Home/Apt listings, which make up 96.9% of the 160 active rentals. This indicates strong guest preference for privacy and space.
- Looking at the property type distribution in Ilha de Itamaracá, House properties are the most common (71.9%), reflecting the local real estate landscape.
- Houses represent a significant 71.9% portion, catering likely to families or larger groups.
- Smaller segments like hotel/boutique, others (combined 1.2%) offer potential for unique stay experiences.
Ilha de Itamaracá Airbnb Room Capacity Analysis (2026): Bedroom Distribution
Distribution of Listings by Number of Bedrooms
Room Capacity Insights for Ilha de Itamaracá
- The dominant room capacity in Ilha de Itamaracá is 3 bedrooms listings, making up 36.9% of the market. This suggests a strong demand for properties suitable for families or small groups.
- Together, 3 bedrooms and 2 bedrooms properties represent 66.3% of the active Airbnb listings in Ilha de Itamaracá, indicating a high concentration in these sizes.
- A significant 64.5% of listings offer 3+ bedrooms, catering to larger groups and families seeking more space in Ilha de Itamaracá.
Ilha de Itamaracá Vacation Rental Guest Capacity Trends (2026)
Distribution of Listings by Guest Capacity
Guest Capacity Insights for Ilha de Itamaracá
- The most common guest capacity trend in Ilha de Itamaracá vacation rentals is listings accommodating 8+ guests (64.4%). This suggests the primary traveler segment is likely larger groups.
- Properties designed for 8+ guests and 6 guests dominate the Ilha de Itamaracá STR market, accounting for 84.4% of listings.
- 92.5% of properties accommodate 6+ guests, serving the market segment for larger families or group travel in Ilha de Itamaracá.
- On average, properties in Ilha de Itamaracá are equipped to host 7.1 guests.
Ilha de Itamaracá Airbnb Booking Patterns (2026): Available vs. Booked Days
Available Days Distribution
Booked Days Distribution
Booking Pattern Insights for Ilha de Itamaracá
- The most common availability pattern in Ilha de Itamaracá falls within the 271-366 days range, representing 88.8% of listings. This suggests many properties have significant open periods on their calendars.
- Approximately 100.1% of listings show high availability (181+ days open annually), indicating potential for increased bookings or specific owner usage patterns.
- For booked days, the 1-30 days range is most frequent in Ilha de Itamaracá (43.1%), reflecting common guest stay durations or potential owner blocking patterns.
Ilha de Itamaracá Airbnb Minimum Stay Requirements Analysis
Distribution of Listings by Minimum Night Requirement
1 Night
26 listings
16.3% of total
2 Nights
77 listings
48.1% of total
3 Nights
8 listings
5% of total
4-6 Nights
4 listings
2.5% of total
30+ Nights
45 listings
28.1% of total
Key Insights
- The most prevalent minimum stay requirement in Ilha de Itamaracá is 2 Nights, adopted by 48.1% of listings. This highlights the market's preference for shorter, flexible bookings.
- A strong majority (64.4%) of the Ilha de Itamaracá Airbnb data shows acceptance of very short stays (1-2 nights), indicating a dynamic, high-turnover market.
- A significant segment (28.1%) caters to monthly stays (30+ nights) in Ilha de Itamaracá, pointing to opportunities in the extended-stay market.
Recommendations
- Align with the market by considering a 2 Nights minimum stay, as 48.1% of Ilha de Itamaracá hosts use this setting.
- If feasible, allowing 1-night stays, especially midweek or during low season, could capture last-minute bookings, as only 16.3% currently do.
- A 2-night minimum appears standard (48.1%). Consider this for weekends or peak periods.
- Explore offering discounts for stays of 30+ nights to attract the 28.1% of the market seeking extended stays.
- Adjust minimum nights based on seasonality – potentially shorter during low season and longer during peak demand periods in Ilha de Itamaracá.
Ilha de Itamaracá Airbnb Cancellation Policy Trends Analysis (2026)
Limited
1 listings
0.6% of total
Flexible
49 listings
30.6% of total
Moderate
32 listings
20% of total
Firm
56 listings
35% of total
Strict
22 listings
13.8% of total
Cancellation Policy Insights for Ilha de Itamaracá
- The prevailing Airbnb cancellation policy trend in Ilha de Itamaracá is Firm, used by 35% of listings.
- There's a relatively balanced mix between guest-friendly (50.6%) and stricter (48.8%) policies, offering choices for different guest needs.
Recommendations for Hosts
- Consider adopting a Firm policy to align with the 35% market standard in Ilha de Itamaracá.
- Using a Strict policy might deter some guests, as only 13.8% of listings use it. Evaluate if potential revenue protection outweighs possible lower booking rates.
- Regularly review your cancellation policy against competitors and market demand shifts in Ilha de Itamaracá.
Ilha de Itamaracá STR Booking Lead Time Analysis (2026)
Average Booking Lead Time by Month
Booking Lead Time Insights for Ilha de Itamaracá
- The overall average booking lead time for vacation rentals in Ilha de Itamaracá is 41 days.
- Guests book furthest in advance for stays during December (average 61 days), likely coinciding with peak travel demand or local events.
- The shortest booking windows occur for stays in July (average 17 days), indicating more last-minute travel plans during this time.
- Seasonally, Winter (50 days avg.) sees the longest lead times, while Summer (22 days avg.) has the shortest, reflecting typical travel planning cycles.
Recommendations for Hosts
- Use the overall average lead time (41 days) as a baseline for your pricing and availability strategy in Ilha de Itamaracá.
- For December stays, consider implementing length-of-stay discounts or slightly higher rates for bookings made less than 61 days out to capitalize on advance planning.
- Target marketing efforts for the Winter season well in advance (at least 50 days) to capture early planners.
- Monitor your own booking lead times against these Ilha de Itamaracá averages to identify opportunities for dynamic pricing adjustments.
Popular & Essential Airbnb Amenities in Ilha de Itamaracá (2026)
Amenity Prevalence
Amenity Insights for Ilha de Itamaracá
- Essential amenities in Ilha de Itamaracá that guests expect include: Kitchen, Wifi. Lacking these (any) could significantly impact bookings.
- Popular amenities like BBQ grill, TV, Free parking on premises are common but not universal. Offering these can provide a competitive edge.
- A pool is a highly desired but not standard amenity, making it a key feature for attracting guests seeking leisure in Ilha de Itamaracá.
Recommendations for Hosts
- Ensure your listing includes all essential amenities for Ilha de Itamaracá: Kitchen, Wifi.
- Prioritize adding missing essentials: Kitchen, Wifi.
- Consider adding popular differentiators like BBQ grill or TV to increase appeal.
- Highlight unique or less common amenities you offer (e.g., hot tub, dedicated workspace, EV charger) in your listing description and photos.
- Regularly check competitor amenities in Ilha de Itamaracá to stay competitive.
Ilha de Itamaracá Airbnb Guest Demographics & Profile Analysis (2026)
Guest Profile Summary for Ilha de Itamaracá
- The typical guest profile for Airbnb in Ilha de Itamaracá consists of primarily domestic travelers (90%), often arriving from nearby Pernambuco, typically belonging to the Post-2000s (Gen Z/Alpha) group (50%), primarily speaking Portuguese or English.
- Domestic travelers account for 90.1% of guests.
- Key international markets include Brazil (90.1%) and Portugal (1.7%).
- Top languages spoken are Portuguese (42.7%) followed by English (23.9%).
- A significant demographic segment is the Post-2000s (Gen Z/Alpha) group, representing 50% of guests.
Recommendations for Hosts
- Target domestic marketing efforts towards travelers from Pernambuco and Recife.
- Tailor amenities and listing descriptions to appeal to the dominant Post-2000s (Gen Z/Alpha) demographic (e.g., highlight fast WiFi, smart home features, local guides).
- Highlight unique local experiences or amenities relevant to the primary guest profile.
- Consider seasonal promotions aligned with peak travel times for key origin markets.
Nearby Short-Term Rental Market Comparison
How does the Ilha de Itamaracá Airbnb market stack up against its neighbors? Compare key performance metrics like average monthly revenue, ADR, and occupancy rates in surrounding areas to understand the broader regional STR landscape.
| Market | Active Properties | Monthly Revenue | Daily Rate | Avg. Occupancy |
|---|---|---|---|---|
| Sirinhaém | 44 | $1,343 | $225.63 | 25% |
| Ipojuca | 4,298 | $847 | $118.24 | 35% |
| Tamandaré | 1,255 | $830 | $141.81 | 28% |
| Maragogi | 768 | $792 | $120.80 | 29% |
| Bananeiras | 228 | $720 | $130.54 | 24% |
| Tibau do Sul | 1,407 | $717 | $90.98 | 33% |
| Camaragibe | 28 | $680 | $118.56 | 27% |
| Cabo de Santo Agostinho | 126 | $623 | $122.43 | 26% |
| São José da Coroa Grande | 186 | $609 | $85.73 | 32% |
| Areia | 25 | $576 | $80.31 | 27% |