Gravatá Airbnb Market Analysis 2026: Short Term Rental Data & Vacation Rental Statistics in Pernambuco, Brazil
Is Airbnb profitable in Gravatá in 2026? Explore comprehensive Airbnb analytics for Gravatá, Pernambuco, Brazil to uncover income potential. This 2026 STR market report for Gravatá, based on AirROI data from February 2025 to January 2026, reveals key trends in the market of 554 active listings.
Whether you're considering an Airbnb investment in Gravatá, optimizing your existing vacation rental, or exploring rental arbitrage opportunities, understanding the Gravatá Airbnb data is crucial. Leveraging the low regulation environment is key to maximizing your short term rental income potential. Let's dive into the specifics.
Key Gravatá Airbnb Performance Metrics Overview
Monthly Airbnb Revenue Variations & Income Potential in Gravatá (2026)
Understanding the monthly revenue variations for Airbnb listings in Gravatá is key to maximizing your short term rental income potential. Seasonality significantly impacts earnings. Our analysis, based on data from the past 12 months, shows that the peak revenue month for STRs in Gravatá is typically June, while November often presents the lowest earnings, highlighting opportunities for strategic pricing adjustments during shoulder and low seasons. Explore the typical Airbnb income in Gravatá across different performance tiers:
- Best-in-class properties (Top 10%) achieve $1,629+ monthly, often utilizing dynamic pricing and superior guest experiences.
- Strong performing properties (Top 25%) earn $940 or more, indicating effective management and desirable locations/amenities.
- Typical properties (Median) generate around $509 per month, representing the average market performance.
- Entry-level properties (Bottom 25%) see earnings around $261, often with potential for optimization.
Average Monthly Airbnb Earnings Trend in Gravatá
Gravatá Airbnb Occupancy Rate Trends (2026)
Maximize your bookings by understanding the Gravatá STR occupancy trends. Seasonal demand shifts significantly influence how often properties are booked. Typically, Julysees the highest demand (peak season occupancy), while November experiences the lowest (low season). Effective strategies, like adjusting minimum stays or offering promotions, can boost occupancy during slower periods. Here's how different property tiers perform in Gravatá:
- Best-in-class properties (Top 10%) achieve 48%+ occupancy, indicating high desirability and potentially optimized availability.
- Strong performing properties (Top 25%) maintain 32% or higher occupancy, suggesting good market fit and guest satisfaction.
- Typical properties (Median) have an occupancy rate around 18%.
- Entry-level properties (Bottom 25%) average 10% occupancy, potentially facing higher vacancy.
Average Monthly Occupancy Rate Trend in Gravatá
Average Daily Rate (ADR) Airbnb Trends in Gravatá (2026)
Effective short term rental pricing strategy in Gravatá involves understanding monthly ADR fluctuations. The Average Daily Rate (ADR) for Airbnb in Gravatá typically peaks in December and dips lowest during February. Leveraging Airbnb dynamic pricing tools or strategies based on this seasonality can significantly boost revenue. Here's a look at the typical nightly rates achieved:
- Best-in-class properties (Top 10%) command rates of $196+ per night, often due to premium features or locations.
- Strong performing properties (Top 25%) achieve nightly rates of $136 or more.
- Typical properties (Median) charge around $92 per night.
- Entry-level properties (Bottom 25%) earn around $63 per night.
Average Daily Rate (ADR) Trend by Month in Gravatá
Get Live Gravatá Market Intelligence 👇

Explore Real-time Analytics
Airbnb Seasonality Analysis & Trends in Gravatá (2026)
Peak Season (June, July, March)
- Revenue averages $1,049 per month
- Occupancy rates average 30.0%
- Daily rates average $116
Shoulder Season
- Revenue averages $726 per month
- Occupancy maintains around 21.6%
- Daily rates hold near $117
Low Season (February, September, November)
- Revenue drops to average $587 per month
- Occupancy decreases to average 20.2%
- Daily rates adjust to average $113
Seasonality Insights for Gravatá
- The Airbnb seasonality in Gravatá shows highly seasonal trends requiring careful strategy. While the sections above show seasonal averages, it's also insightful to look at the extremes:
- During the high season, the absolute peak month showcases Gravatá's highest earning potential, with monthly revenues capable of climbing to $1,182, occupancy reaching a high of 31.6%, and ADRs peaking at $130.
- Conversely, the slowest single month of the year, typically falling within the low season, marks the market's lowest point. In this month, revenue might dip to $566, occupancy could drop to 18.7%, and ADRs may adjust down to $105.
- Understanding both the seasonal averages and these monthly peaks and troughs in revenue, occupancy, and ADR is crucial for maximizing your Airbnb profit potential in Gravatá.
Seasonal Strategies for Maximizing Profit
- Peak Season: Maximize revenue through premium pricing and potentially longer minimum stays. Ensure high availability.
- Low Season: Offer competitive pricing, special promotions (e.g., extended stay discounts), and flexible cancellation policies. Target off-season travelers like remote workers or budget-conscious guests.
- Shoulder Seasons: Implement dynamic pricing that balances peak and low rates. Target weekend travelers or specific events. Offer slightly more flexible terms than peak season.
- Regularly analyze your own performance against these Gravatá seasonality benchmarks and adjust your pricing and availability strategy accordingly.
Best Areas for Airbnb Investment in Gravatá (2026)
Exploring the top neighborhoods for short-term rentals in Gravatá? This section highlights key areas, outlining why they are attractive for hosts and guests, along with notable local attractions. Consider these locations based on your target guest profile and investment strategy.
| Neighborhood / Area | Why Host Here? (Target Guests & Appeal) | Key Attractions & Landmarks |
|---|---|---|
| Centro de Gravatá | The bustling downtown area offers a mix of cultural attractions, dining, and shopping. It's a prime location for tourists wanting to experience local life and easy access to amenities. | Market Square, São José Church, Gravatá's carnival festivities, Local craft shops |
| Uruaú | Known for its natural beauty and serene environment, Uruaú is ideal for those looking to relax away from the city. It attracts nature lovers and families seeking a peaceful getaway. | Uruaú Beach, Hiking trails, Natural reserves |
| Chã Grande | A small town close to Gravatá, Chã Grande offers a taste of rural life in Pernambuco, appealing to visitors looking for authenticity and local culture. | Local farms, Cultural festivals, Traditional cuisine |
| Jardim Nova Gravatá | A family-friendly neighborhood known for its parks and recreational areas, making it attractive for tourists traveling with children or looking for a relaxed environment. | Parque da Cidade, Children's playgrounds, Local eateries |
| Caminho da Serra | This area provides an escape into nature with beautiful landscapes and hiking opportunities, appealing to eco-tourists and nature enthusiasts. | Hiking trails, Natural beauty spots, Wildlife observation |
| Estrada de São João | A scenic area that offers access to various weekend retreats and leisure activities, appealing to visitors looking for adventure and outdoor experiences. | Adventure parks, Camping sites, Natural pools |
| Sítio do Raposo | A rural area with picturesque views and agricultural tourism, ideal for those wanting to experience the countryside and local farm life. | Agro-tourism, Farm stays, Cultural experiences |
| Vila das Artes | Known for its artistic vibe, this area hosts local artisans and workshops, making it popular among tourists interested in arts and crafts. | Artisan workshops, Craft fairs, Cultural events |
Understanding Airbnb License Requirements & STR Laws in Gravatá (2026)
While Gravatá, Pernambuco, Brazil currently shows low STR regulations, specific Airbnb license requirements might still exist or change. Always verify the latest short term rental regulations and Airbnb license requirements directly with local government authorities for Gravatá to ensure full compliance before hosting.
(Source: AirROI data, 2026, based on 0% licensed listings)
Top Performing Airbnb Properties in Gravatá (2026)
Benchmark your potential! Explore examples of top-performing Airbnb properties in Gravatábased on Trailing Twelve Month (TTM) revenue. Analyze their characteristics, revenue, occupancy rate, and ADR to understand what drives success in this market.
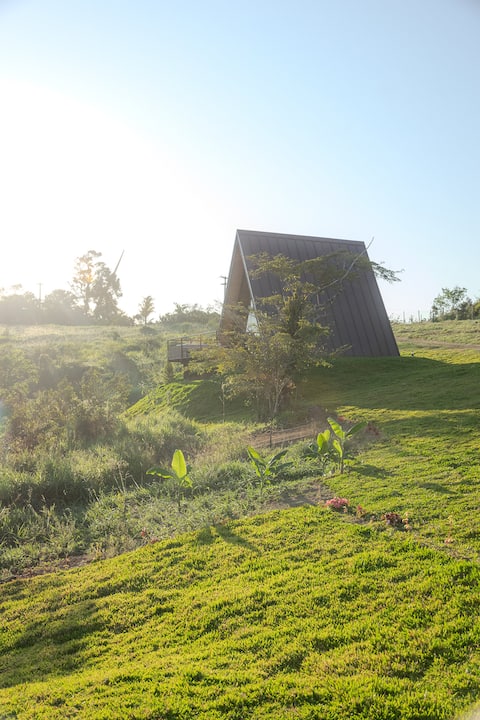
Haven of Lindos - Coelho Chalet
Entire Place • 1 bedroom

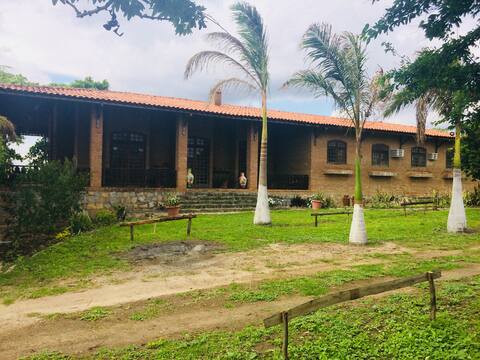
Nice and cozy country house in Gravatá
Entire Place • 8 bedrooms
House in Gravatá 1000 m2 Farm with 7 bedrooms.
Entire Place • 7 bedrooms
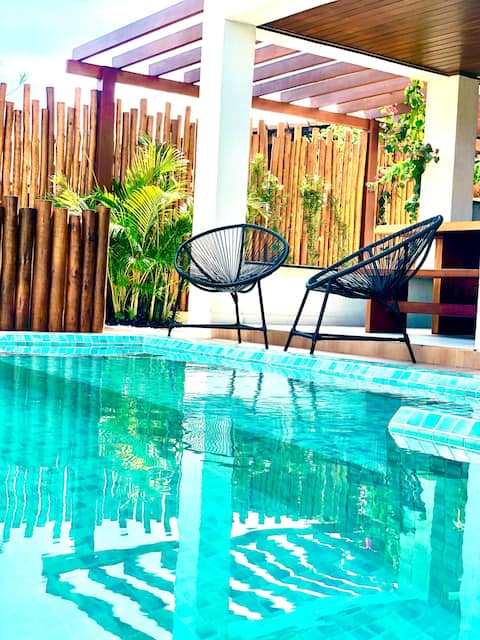
Casa Lua - Beautiful and sophisticated
Entire Place • 4 bedrooms
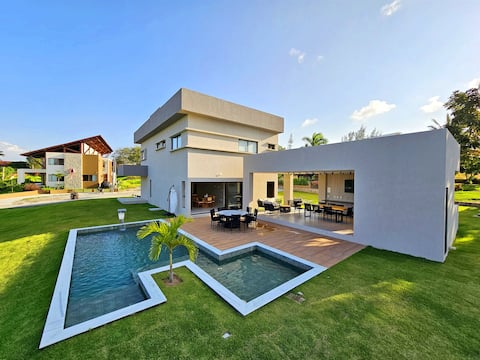
House in Gravatá
Entire Place • 6 bedrooms
Casa Ojuara 6 en-suites. Comfort and lightness in Gravatá
Entire Place • 6 bedrooms
Note: Performance varies based on location, size, amenities, seasonality, and management quality. Data reflects the past 12 months.
Top Performing Airbnb Hosts in Gravatá (2026)
Learn from the best! This table showcases top-performing Airbnb hosts in Gravatá based on the number of properties managed and estimated total revenue over the past year. Analyze their scale and performance metrics.
| Host Name | Properties | Grossing Revenue | Stay Reviews | Avg Rating |
|---|---|---|---|---|
| Felipe | 1 | $53,789 | 42 | 4.98/5.0 |
| Maria Adélia Barros E Silva De | 1 | $49,636 | 17 | 4.94/5.0 |
| André Rocha | 1 | $45,256 | 76 | 4.91/5.0 |
| Cristiane Maria | 1 | $43,521 | 39 | 4.97/5.0 |
| Adriana | 1 | $42,762 | 5 | 5.00/5.0 |
| Karina | 9 | $42,020 | 181 | 4.85/5.0 |
| CoHost | 2 | $40,939 | 35 | 4.74/5.0 |
| Zuleide | 1 | $37,841 | 12 | 5.00/5.0 |
| Locar House | 2 | $34,616 | 65 | 4.75/5.0 |
| Isabela | 1 | $33,234 | 85 | 4.94/5.0 |
Analyzing the strategies of top hosts, such as their property selection, pricing, and guest communication, can offer valuable lessons for optimizing your own Airbnb operations in Gravatá.
Dive Deeper: Advanced Gravatá STR Market Data (2026)
Ready to unlock more insights? AirROI provides access to advanced metrics and comprehensive Airbnb data for Gravatá. Explore detailed analytics beyond this report to refine your investment strategy, optimize pricing, and maximize your vacation rental profits.
Explore Advanced MetricsGravatá Short-Term Rental Market Composition (2026): Property & Room Types
Room Type Distribution
Property Type Distribution
Market Composition Insights for Gravatá
- The Gravatá Airbnb market composition is heavily skewed towards Entire Home/Apt listings, which make up 97.3% of the 554 active rentals. This indicates strong guest preference for privacy and space.
- Looking at the property type distribution in Gravatá, House properties are the most common (67%), reflecting the local real estate landscape.
- Houses represent a significant 67% portion, catering likely to families or larger groups.
- Smaller segments like hotel/boutique, outdoor/unique, others (combined 2.7%) offer potential for unique stay experiences.
Gravatá Airbnb Room Capacity Analysis (2026): Bedroom Distribution
Distribution of Listings by Number of Bedrooms
Room Capacity Insights for Gravatá
- The dominant room capacity in Gravatá is 3 bedrooms listings, making up 26.9% of the market. This suggests a strong demand for properties suitable for families or small groups.
- Together, 3 bedrooms and 2 bedrooms properties represent 53.8% of the active Airbnb listings in Gravatá, indicating a high concentration in these sizes.
- A significant 64.5% of listings offer 3+ bedrooms, catering to larger groups and families seeking more space in Gravatá.
Gravatá Vacation Rental Guest Capacity Trends (2026)
Distribution of Listings by Guest Capacity
Guest Capacity Insights for Gravatá
- The most common guest capacity trend in Gravatá vacation rentals is listings accommodating 8+ guests (63.7%). This suggests the primary traveler segment is likely larger groups.
- Properties designed for 8+ guests and 6 guests dominate the Gravatá STR market, accounting for 81.4% of listings.
- 87.2% of properties accommodate 6+ guests, serving the market segment for larger families or group travel in Gravatá.
- On average, properties in Gravatá are equipped to host 7.0 guests.
Gravatá Airbnb Booking Patterns (2026): Available vs. Booked Days
Available Days Distribution
Booked Days Distribution
Booking Pattern Insights for Gravatá
- The most common availability pattern in Gravatá falls within the 271-366 days range, representing 82.9% of listings. This suggests many properties have significant open periods on their calendars.
- Approximately 97.9% of listings show high availability (181+ days open annually), indicating potential for increased bookings or specific owner usage patterns.
- For booked days, the 1-30 days range is most frequent in Gravatá (45.7%), reflecting common guest stay durations or potential owner blocking patterns.
- A notable 2.4% of properties secure long booking periods (181+ days booked per year), highlighting successful long-term rental strategies or significant owner usage.
Gravatá Airbnb Minimum Stay Requirements Analysis
Distribution of Listings by Minimum Night Requirement
1 Night
104 listings
18.8% of total
2 Nights
299 listings
54% of total
3 Nights
24 listings
4.3% of total
4-6 Nights
8 listings
1.4% of total
7-29 Nights
1 listings
0.2% of total
30+ Nights
118 listings
21.3% of total
Key Insights
- The most prevalent minimum stay requirement in Gravatá is 2 Nights, adopted by 54% of listings. This highlights the market's preference for shorter, flexible bookings.
- A strong majority (72.8%) of the Gravatá Airbnb data shows acceptance of very short stays (1-2 nights), indicating a dynamic, high-turnover market.
- A significant segment (21.3%) caters to monthly stays (30+ nights) in Gravatá, pointing to opportunities in the extended-stay market.
Recommendations
- Align with the market by considering a 2 Nights minimum stay, as 54% of Gravatá hosts use this setting.
- If feasible, allowing 1-night stays, especially midweek or during low season, could capture last-minute bookings, as only 18.8% currently do.
- A 2-night minimum appears standard (54%). Consider this for weekends or peak periods.
- Explore offering discounts for stays of 30+ nights to attract the 21.3% of the market seeking extended stays.
- Adjust minimum nights based on seasonality – potentially shorter during low season and longer during peak demand periods in Gravatá.
Gravatá Airbnb Cancellation Policy Trends Analysis (2026)
Super Strict 30 Days
2 listings
0.4% of total
Limited
9 listings
1.6% of total
Super Strict 60 Days
2 listings
0.4% of total
Flexible
155 listings
28.1% of total
Moderate
144 listings
26.1% of total
Firm
194 listings
35.2% of total
Strict
45 listings
8.2% of total
Cancellation Policy Insights for Gravatá
- The prevailing Airbnb cancellation policy trend in Gravatá is Firm, used by 35.2% of listings.
- There's a relatively balanced mix between guest-friendly (54.2%) and stricter (43.4%) policies, offering choices for different guest needs.
- Strict cancellation policies are quite rare (8.2%), potentially making listings with this policy less competitive unless justified by high demand or property type.
Recommendations for Hosts
- Consider adopting a Firm policy to align with the 35.2% market standard in Gravatá.
- Using a Strict policy might deter some guests, as only 8.2% of listings use it. Evaluate if potential revenue protection outweighs possible lower booking rates.
- Regularly review your cancellation policy against competitors and market demand shifts in Gravatá.
Gravatá STR Booking Lead Time Analysis (2026)
Average Booking Lead Time by Month
Booking Lead Time Insights for Gravatá
- The overall average booking lead time for vacation rentals in Gravatá is 32 days.
- Guests book furthest in advance for stays during June (average 53 days), likely coinciding with peak travel demand or local events.
- The shortest booking windows occur for stays in September (average 17 days), indicating more last-minute travel plans during this time.
- Seasonally, Summer (32 days avg.) sees the longest lead times, while Fall (26 days avg.) has the shortest, reflecting typical travel planning cycles.
Recommendations for Hosts
- Use the overall average lead time (32 days) as a baseline for your pricing and availability strategy in Gravatá.
- For June stays, consider implementing length-of-stay discounts or slightly higher rates for bookings made less than 53 days out to capitalize on advance planning.
- Target marketing efforts for the Summer season well in advance (at least 32 days) to capture early planners.
- Monitor your own booking lead times against these Gravatá averages to identify opportunities for dynamic pricing adjustments.
Popular & Essential Airbnb Amenities in Gravatá (2026)
Amenity Prevalence
Amenity Insights for Gravatá
- Essential amenities in Gravatá that guests expect include: Kitchen, TV, Free parking on premises. Lacking these (any) could significantly impact bookings.
- Popular amenities like Wifi, Pool, Air conditioning are common but not universal. Offering these can provide a competitive edge.
- A pool is a highly desired but not standard amenity, making it a key feature for attracting guests seeking leisure in Gravatá.
- Warning: Wifi is not universally provided but is considered essential globally. Ensure reliable Wifi is offered.
Recommendations for Hosts
- Ensure your listing includes all essential amenities for Gravatá: Kitchen, TV, Free parking on premises.
- Prioritize adding missing essentials: Kitchen, TV, Free parking on premises.
- Consider adding popular differentiators like Wifi or Pool to increase appeal.
- Highlight unique or less common amenities you offer (e.g., hot tub, dedicated workspace, EV charger) in your listing description and photos.
- Regularly check competitor amenities in Gravatá to stay competitive.
Gravatá Airbnb Guest Demographics & Profile Analysis (2026)
Guest Profile Summary for Gravatá
- The typical guest profile for Airbnb in Gravatá consists of primarily domestic travelers (99%), often arriving from nearby Pernambuco, typically belonging to the Post-2000s (Gen Z/Alpha) group (50%), primarily speaking Portuguese or English.
- Domestic travelers account for 98.5% of guests.
- Key international markets include Brazil (98.5%) and United States (0.3%).
- Top languages spoken are Portuguese (55.9%) followed by English (27.9%).
- A significant demographic segment is the Post-2000s (Gen Z/Alpha) group, representing 50% of guests.
Recommendations for Hosts
- Target domestic marketing efforts towards travelers from Pernambuco and Recife.
- Tailor amenities and listing descriptions to appeal to the dominant Post-2000s (Gen Z/Alpha) demographic (e.g., highlight fast WiFi, smart home features, local guides).
- Highlight unique local experiences or amenities relevant to the primary guest profile.
- Consider seasonal promotions aligned with peak travel times for key origin markets.
Nearby Short-Term Rental Market Comparison
How does the Gravatá Airbnb market stack up against its neighbors? Compare key performance metrics like average monthly revenue, ADR, and occupancy rates in surrounding areas to understand the broader regional STR landscape.
| Market | Active Properties | Monthly Revenue | Daily Rate | Avg. Occupancy |
|---|---|---|---|---|
| Passo de Camaragibe | 155 | $2,288 | $323.99 | 30% |
| Sirinhaém | 44 | $1,343 | $225.63 | 25% |
| Porto de Pedras | 434 | $1,180 | $167.35 | 31% |
| Japaratinga | 178 | $895 | $118.94 | 29% |
| Barra de São Miguel | 441 | $875 | $174.19 | 24% |
| Paripueira | 149 | $867 | $150.43 | 26% |
| Ipojuca | 4,298 | $847 | $118.24 | 35% |
| Tamandaré | 1,255 | $830 | $141.81 | 28% |
| São Miguel dos Milagres | 549 | $801 | $126.23 | 27% |
| Maragogi | 768 | $792 | $120.80 | 29% |