Garanhuns Airbnb Market Analysis 2026: Short Term Rental Data & Vacation Rental Statistics in Pernambuco, Brazil
Is Airbnb profitable in Garanhuns in 2026? Explore comprehensive Airbnb analytics for Garanhuns, Pernambuco, Brazil to uncover income potential. This 2026 STR market report for Garanhuns, based on AirROI data from February 2025 to January 2026, reveals key trends in the market of 254 active listings.
Whether you're considering an Airbnb investment in Garanhuns, optimizing your existing vacation rental, or exploring rental arbitrage opportunities, understanding the Garanhuns Airbnb data is crucial. Leveraging the low regulation environment is key to maximizing your short term rental income potential. Let's dive into the specifics.
Key Garanhuns Airbnb Performance Metrics Overview
Monthly Airbnb Revenue Variations & Income Potential in Garanhuns (2026)
Understanding the monthly revenue variations for Airbnb listings in Garanhuns is key to maximizing your short term rental income potential. Seasonality significantly impacts earnings. Our analysis, based on data from the past 12 months, shows that the peak revenue month for STRs in Garanhuns is typically December, while May often presents the lowest earnings, highlighting opportunities for strategic pricing adjustments during shoulder and low seasons. Explore the typical Airbnb income in Garanhuns across different performance tiers:
- Best-in-class properties (Top 10%) achieve $1,556+ monthly, often utilizing dynamic pricing and superior guest experiences.
- Strong performing properties (Top 25%) earn $805 or more, indicating effective management and desirable locations/amenities.
- Typical properties (Median) generate around $367 per month, representing the average market performance.
- Entry-level properties (Bottom 25%) see earnings around $161, often with potential for optimization.
Average Monthly Airbnb Earnings Trend in Garanhuns
Garanhuns Airbnb Occupancy Rate Trends (2026)
Maximize your bookings by understanding the Garanhuns STR occupancy trends. Seasonal demand shifts significantly influence how often properties are booked. Typically, Decembersees the highest demand (peak season occupancy), while May experiences the lowest (low season). Effective strategies, like adjusting minimum stays or offering promotions, can boost occupancy during slower periods. Here's how different property tiers perform in Garanhuns:
- Best-in-class properties (Top 10%) achieve 60%+ occupancy, indicating high desirability and potentially optimized availability.
- Strong performing properties (Top 25%) maintain 38% or higher occupancy, suggesting good market fit and guest satisfaction.
- Typical properties (Median) have an occupancy rate around 22%.
- Entry-level properties (Bottom 25%) average 10% occupancy, potentially facing higher vacancy.
Average Monthly Occupancy Rate Trend in Garanhuns
Average Daily Rate (ADR) Airbnb Trends in Garanhuns (2026)
Effective short term rental pricing strategy in Garanhuns involves understanding monthly ADR fluctuations. The Average Daily Rate (ADR) for Airbnb in Garanhuns typically peaks in July and dips lowest during April. Leveraging Airbnb dynamic pricing tools or strategies based on this seasonality can significantly boost revenue. Here's a look at the typical nightly rates achieved:
- Best-in-class properties (Top 10%) command rates of $153+ per night, often due to premium features or locations.
- Strong performing properties (Top 25%) achieve nightly rates of $94 or more.
- Typical properties (Median) charge around $60 per night.
- Entry-level properties (Bottom 25%) earn around $37 per night.
Average Daily Rate (ADR) Trend by Month in Garanhuns
Get Live Garanhuns Market Intelligence 👇

Explore Real-time Analytics
Airbnb Seasonality Analysis & Trends in Garanhuns (2026)
Peak Season (December, July, June)
- Revenue averages $848 per month
- Occupancy rates average 30.3%
- Daily rates average $83
Shoulder Season
- Revenue averages $683 per month
- Occupancy maintains around 27.4%
- Daily rates hold near $76
Low Season (January, April, May)
- Revenue drops to average $531 per month
- Occupancy decreases to average 23.2%
- Daily rates adjust to average $75
Seasonality Insights for Garanhuns
- The Airbnb seasonality in Garanhuns shows moderate seasonality with distinct peak and low periods. While the sections above show seasonal averages, it's also insightful to look at the extremes:
- During the high season, the absolute peak month showcases Garanhuns's highest earning potential, with monthly revenues capable of climbing to $906, occupancy reaching a high of 33.9%, and ADRs peaking at $89.
- Conversely, the slowest single month of the year, typically falling within the low season, marks the market's lowest point. In this month, revenue might dip to $469, occupancy could drop to 19.0%, and ADRs may adjust down to $72.
- Understanding both the seasonal averages and these monthly peaks and troughs in revenue, occupancy, and ADR is crucial for maximizing your Airbnb profit potential in Garanhuns.
Seasonal Strategies for Maximizing Profit
- Peak Season: Maximize revenue through premium pricing and potentially longer minimum stays. Ensure high availability.
- Low Season: Offer competitive pricing, special promotions (e.g., extended stay discounts), and flexible cancellation policies. Target off-season travelers like remote workers or budget-conscious guests.
- Shoulder Seasons: Implement dynamic pricing that balances peak and low rates. Target weekend travelers or specific events. Offer slightly more flexible terms than peak season.
- Regularly analyze your own performance against these Garanhuns seasonality benchmarks and adjust your pricing and availability strategy accordingly.
Best Areas for Airbnb Investment in Garanhuns (2026)
Exploring the top neighborhoods for short-term rentals in Garanhuns? This section highlights key areas, outlining why they are attractive for hosts and guests, along with notable local attractions. Consider these locations based on your target guest profile and investment strategy.
| Neighborhood / Area | Why Host Here? (Target Guests & Appeal) | Key Attractions & Landmarks |
|---|---|---|
| Centro | The cultural and historical heart of Garanhuns, featuring colonial architecture and vibrant local markets. Ideal for tourists wanting to experience the city's history and culture. | Church of São Antônio, Horto Florestal, Garanhuns Cultural Space, Mundial da Música, Art Museum of Garanhuns |
| Parque Ruber Van Der Linden | A beautiful park area with scenic views, perfect for families and those looking to enjoy nature. Great for Airbnb guests who prefer a calm and relaxing environment. | Lake of Garanhuns, Walking trails, Picnic areas, Vibrant gardens, Birdwatching opportunities |
| São João | Traditional neighborhood known for its annual festival celebrations, attracting visitors who are interested in local culture and festivities. | Festival de Inverno, Local eateries, Cultural events, Traditional crafts, Music performances |
| Heliopólis | A growing area known for its residential appeal and proximity to nature. Ideal for families and long-term stays, as it offers a quieter lifestyle. | Nearby nature reserves, Local markets, Family-friendly parks, Community gatherings |
| Garanhuns’ Historic District | Home to iconic historical landmarks, this district attracts visitors interested in heritage and architecture. A prime area for tourists exploring the city's past. | The Palace of the Princes, Historical museums, Old theaters, Colonial houses, Cultural festivals |
| Garanhuns Golf Club | A resort-style community that offers a mix of relaxation and leisure activities, perfect for tourists looking for an escape and outdoor activities. | Golf courses, Swimming pools, Clubhouse amenities, Nature trails, Wellness and spa options |
| Cerro Azul | A picturesque neighborhood known for its scenic views and tranquility, making it attractive to visitors seeking peace amidst nature and good views. | Scenic lookout points, Walking trails, Local cafes, Nature-inspired activities |
| Matriz de São Pedro | A lively area that hosts local markets and events, providing guests with a taste of local life and fresh produce. | Weekly farmers' market, Local artisan shops, Community events, Artisan crafts |
Understanding Airbnb License Requirements & STR Laws in Garanhuns (2026)
While Garanhuns, Pernambuco, Brazil currently shows low STR regulations, specific Airbnb license requirements might still exist or change. Always verify the latest short term rental regulations and Airbnb license requirements directly with local government authorities for Garanhuns to ensure full compliance before hosting.
(Source: AirROI data, 2026, finding no licensed listings among those analyzed)
Top Performing Airbnb Properties in Garanhuns (2026)
Benchmark your potential! Explore examples of top-performing Airbnb properties in Garanhunsbased on Trailing Twelve Month (TTM) revenue. Analyze their characteristics, revenue, occupancy rate, and ADR to understand what drives success in this market.
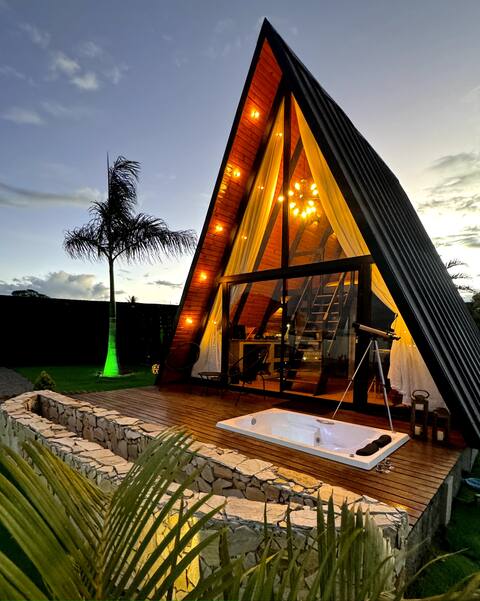
A-Frame Cabin in Garanhuns
Entire Place • 1 bedroom

Loft Domo
Private Room • 1 bedroom

Flat's Tavares 101
Entire Place • 2 bedrooms

Pedras Chalet
Private Room • N/A

Flats Tavares Araujo apt. 202
Entire Place • 2 bedrooms

Flat's Tavares 201
Entire Place • 2 bedrooms
Note: Performance varies based on location, size, amenities, seasonality, and management quality. Data reflects the past 12 months.
Top Performing Airbnb Hosts in Garanhuns (2026)
Learn from the best! This table showcases top-performing Airbnb hosts in Garanhuns based on the number of properties managed and estimated total revenue over the past year. Analyze their scale and performance metrics.
| Host Name | Properties | Grossing Revenue | Stay Reviews | Avg Rating |
|---|---|---|---|---|
| Iara | 4 | $96,946 | 17 | 4.93/5.0 |
| Thiago Tavares | 3 | $74,252 | 158 | 4.97/5.0 |
| Bruno Rodrigo | 3 | $65,674 | 81 | 4.96/5.0 |
| Layane | 1 | $54,791 | 159 | 4.93/5.0 |
| Rafaela | 5 | $28,589 | 70 | 5.00/5.0 |
| Fabio | 3 | $26,482 | 23 | 4.76/5.0 |
| Erika | 1 | $22,178 | 27 | 5.00/5.0 |
| Gilvan | 1 | $19,016 | 14 | 4.79/5.0 |
| Maria Do Carmo | 1 | $17,169 | 13 | 4.92/5.0 |
| Meiryane Aliny | 1 | $16,480 | 76 | 4.99/5.0 |
Analyzing the strategies of top hosts, such as their property selection, pricing, and guest communication, can offer valuable lessons for optimizing your own Airbnb operations in Garanhuns.
Dive Deeper: Advanced Garanhuns STR Market Data (2026)
Ready to unlock more insights? AirROI provides access to advanced metrics and comprehensive Airbnb data for Garanhuns. Explore detailed analytics beyond this report to refine your investment strategy, optimize pricing, and maximize your vacation rental profits.
Explore Advanced MetricsGaranhuns Short-Term Rental Market Composition (2026): Property & Room Types
Room Type Distribution
Property Type Distribution
Market Composition Insights for Garanhuns
- The Garanhuns Airbnb market composition is heavily skewed towards Entire Home/Apt listings, which make up 80.7% of the 254 active rentals. This indicates strong guest preference for privacy and space.
- Looking at the property type distribution in Garanhuns, House properties are the most common (51.6%), reflecting the local real estate landscape.
- Houses represent a significant 51.6% portion, catering likely to families or larger groups.
- Smaller segments like hotel/boutique, outdoor/unique, others, unique stays (combined 6.8%) offer potential for unique stay experiences.
Garanhuns Airbnb Room Capacity Analysis (2026): Bedroom Distribution
Distribution of Listings by Number of Bedrooms
Room Capacity Insights for Garanhuns
- The dominant room capacity in Garanhuns is 2 bedrooms listings, making up 39.8% of the market. This suggests a strong demand for properties suitable for couples or solo travelers.
- Together, 2 bedrooms and 1 bedroom properties represent 59.5% of the active Airbnb listings in Garanhuns, indicating a high concentration in these sizes.
- A significant 24.4% of listings offer 3+ bedrooms, catering to larger groups and families seeking more space in Garanhuns.
Garanhuns Vacation Rental Guest Capacity Trends (2026)
Distribution of Listings by Guest Capacity
Guest Capacity Insights for Garanhuns
- The most common guest capacity trend in Garanhuns vacation rentals is listings accommodating 4 guests (20.1%). This suggests the primary traveler segment is likely small families or groups.
- Properties designed for 4 guests and 8+ guests dominate the Garanhuns STR market, accounting for 38.2% of listings.
- 37.0% of properties accommodate 6+ guests, serving the market segment for larger families or group travel in Garanhuns.
- On average, properties in Garanhuns are equipped to host 4.4 guests.
Garanhuns Airbnb Booking Patterns (2026): Available vs. Booked Days
Available Days Distribution
Booked Days Distribution
Booking Pattern Insights for Garanhuns
- The most common availability pattern in Garanhuns falls within the 271-366 days range, representing 79.5% of listings. This suggests many properties have significant open periods on their calendars.
- Approximately 97.6% of listings show high availability (181+ days open annually), indicating potential for increased bookings or specific owner usage patterns.
- For booked days, the 1-30 days range is most frequent in Garanhuns (49.2%), reflecting common guest stay durations or potential owner blocking patterns.
- A notable 2.8% of properties secure long booking periods (181+ days booked per year), highlighting successful long-term rental strategies or significant owner usage.
Garanhuns Airbnb Minimum Stay Requirements Analysis
Distribution of Listings by Minimum Night Requirement
1 Night
155 listings
61% of total
2 Nights
47 listings
18.5% of total
3 Nights
2 listings
0.8% of total
7-29 Nights
2 listings
0.8% of total
30+ Nights
48 listings
18.9% of total
Key Insights
- The most prevalent minimum stay requirement in Garanhuns is 1 Night, adopted by 61% of listings. This highlights the market's preference for shorter, flexible bookings.
- A strong majority (79.5%) of the Garanhuns Airbnb data shows acceptance of very short stays (1-2 nights), indicating a dynamic, high-turnover market.
- A significant segment (18.9%) caters to monthly stays (30+ nights) in Garanhuns, pointing to opportunities in the extended-stay market.
Recommendations
- Align with the market by considering a 1 Night minimum stay, as 61% of Garanhuns hosts use this setting.
- Explore offering discounts for stays of 30+ nights to attract the 18.9% of the market seeking extended stays.
- Adjust minimum nights based on seasonality – potentially shorter during low season and longer during peak demand periods in Garanhuns.
Garanhuns Airbnb Cancellation Policy Trends Analysis (2026)
Flexible
92 listings
36.2% of total
Moderate
60 listings
23.6% of total
Firm
82 listings
32.3% of total
Strict
20 listings
7.9% of total
Cancellation Policy Insights for Garanhuns
- The prevailing Airbnb cancellation policy trend in Garanhuns is Flexible, used by 36.2% of listings.
- There's a relatively balanced mix between guest-friendly (59.8%) and stricter (40.2%) policies, offering choices for different guest needs.
- Strict cancellation policies are quite rare (7.9%), potentially making listings with this policy less competitive unless justified by high demand or property type.
Recommendations for Hosts
- Consider adopting a Flexible policy to align with the 36.2% market standard in Garanhuns.
- Using a Strict policy might deter some guests, as only 7.9% of listings use it. Evaluate if potential revenue protection outweighs possible lower booking rates.
- Regularly review your cancellation policy against competitors and market demand shifts in Garanhuns.
Garanhuns STR Booking Lead Time Analysis (2026)
Average Booking Lead Time by Month
Booking Lead Time Insights for Garanhuns
- The overall average booking lead time for vacation rentals in Garanhuns is 34 days.
- Guests book furthest in advance for stays during July (average 63 days), likely coinciding with peak travel demand or local events.
- The shortest booking windows occur for stays in February (average 15 days), indicating more last-minute travel plans during this time.
- Seasonally, Summer (35 days avg.) sees the longest lead times, while Winter (20 days avg.) has the shortest, reflecting typical travel planning cycles.
Recommendations for Hosts
- Use the overall average lead time (34 days) as a baseline for your pricing and availability strategy in Garanhuns.
- For July stays, consider implementing length-of-stay discounts or slightly higher rates for bookings made less than 63 days out to capitalize on advance planning.
- Target marketing efforts for the Summer season well in advance (at least 35 days) to capture early planners.
- Monitor your own booking lead times against these Garanhuns averages to identify opportunities for dynamic pricing adjustments.
Popular & Essential Airbnb Amenities in Garanhuns (2026)
Amenity Prevalence
Amenity Insights for Garanhuns
- Essential amenities in Garanhuns that guests expect include: Kitchen, Wifi. Lacking these (any) could significantly impact bookings.
- Popular amenities like TV, Free parking on premises, Dishes and silverware are common but not universal. Offering these can provide a competitive edge.
Recommendations for Hosts
- Ensure your listing includes all essential amenities for Garanhuns: Kitchen, Wifi.
- Prioritize adding missing essentials: Kitchen, Wifi.
- Consider adding popular differentiators like TV or Free parking on premises to increase appeal.
- Highlight unique or less common amenities you offer (e.g., hot tub, dedicated workspace, EV charger) in your listing description and photos.
- Regularly check competitor amenities in Garanhuns to stay competitive.
Garanhuns Airbnb Guest Demographics & Profile Analysis (2026)
Guest Profile Summary for Garanhuns
- The typical guest profile for Airbnb in Garanhuns consists of primarily domestic travelers (99%), often arriving from nearby Pernambuco, typically belonging to the Post-2000s (Gen Z/Alpha) group (50%), primarily speaking Portuguese or English.
- Domestic travelers account for 98.6% of guests.
- Key international markets include Brazil (98.6%) and United States (0.3%).
- Top languages spoken are Portuguese (55.9%) followed by English (27.4%).
- A significant demographic segment is the Post-2000s (Gen Z/Alpha) group, representing 50% of guests.
Recommendations for Hosts
- Target domestic marketing efforts towards travelers from Pernambuco and Recife.
- Tailor amenities and listing descriptions to appeal to the dominant Post-2000s (Gen Z/Alpha) demographic (e.g., highlight fast WiFi, smart home features, local guides).
- Highlight unique local experiences or amenities relevant to the primary guest profile.
- Consider seasonal promotions aligned with peak travel times for key origin markets.
Nearby Short-Term Rental Market Comparison
How does the Garanhuns Airbnb market stack up against its neighbors? Compare key performance metrics like average monthly revenue, ADR, and occupancy rates in surrounding areas to understand the broader regional STR landscape.
| Market | Active Properties | Monthly Revenue | Daily Rate | Avg. Occupancy |
|---|---|---|---|---|
| Passo de Camaragibe | 155 | $2,288 | $323.99 | 30% |
| Sirinhaém | 44 | $1,343 | $225.63 | 25% |
| Porto de Pedras | 434 | $1,180 | $167.35 | 31% |
| Japaratinga | 178 | $895 | $118.94 | 29% |
| Barra de São Miguel | 441 | $875 | $174.19 | 24% |
| Paripueira | 149 | $867 | $150.43 | 26% |
| Tamandaré | 1,255 | $830 | $141.81 | 28% |
| Pão de Açúcar | 28 | $809 | $92.50 | 31% |
| São Miguel dos Milagres | 549 | $801 | $126.23 | 27% |
| Maragogi | 768 | $792 | $120.80 | 29% |